How to enable Google Stackdriver Logging, Monitoring and Error Reporting for .NET apps
Jonathan Simon
Developer Relations
A critical part of creating a great cloud application is making sure it runs today, tomorrow and every day thereafter. Google Stackdriver offers industrial-strength logging, monitoring and error reporting tools for Windows and .NET, so that your applications are consistently available. And companies of all sizes, such as Khan Academy and Wix, are already using Stackdriver to simplify ops.
With Stackdriver Logging and Stackdriver Monitoring, Google Cloud Platform (GCP) now has several excellent tools for .NET developers to stay on top of what's happening with their applications: a Logging agent and client library, a Monitoring agent and a Stackdriver Diagnostics library for error reporting. Let's take a look at these new options available for .NET developers deploying and running applications on GCP.
Logging agent
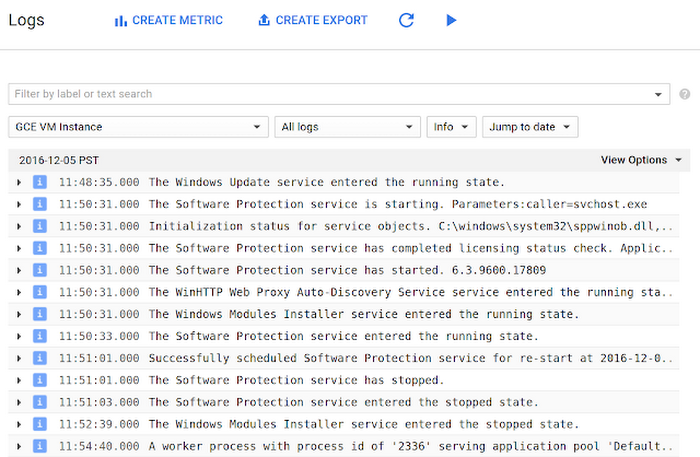
Google Compute Engine virtual machines (VMs) running .NET applications can now automatically collect request and application logs. This is similar to the logging information provided by VMs running in Google App Engine standard and flexible environments. To start logging to Stackdriver, install the Logging agent on your Compute Engine VMs, following these instructions. To confirm things are working, look for a test log entry that reads
textPayload: "Successfully sent to Google Cloud Logging API" in the Stackdriver Logs Viewer. Once the Logging agent is installed in a VM, it starts emitting logs, and you'll have a "log's-eye-view’" of what's happening via auto-generated logs that reflect the events collected by Windows Event Viewer. No matter how many VMs your application requires, the Logs Viewer provides a consolidated view of the Windows logs being generated across your application.
Monitoring agent
Automated logging of warnings and errors from your apps are just the beginning. Monitoring also lets you track specific metrics about your Windows VMs and receive an alert when they cross a predefined threshold. For example, imagine you want to know when a Windows VM's memory usage exceeds 80%. Monitoring agent to the rescue, an optional agent for your Windows VMs that collects CPU and memory utilization, pagefile and volume usage metrics for Monitoring. If the VM is running Microsoft IIS or SQL server, the agent also collects metrics from those services. See the Metrics List page for the full list of metrics it can collect, including metrics from third-party apps, and follow these installation instructions to install it.
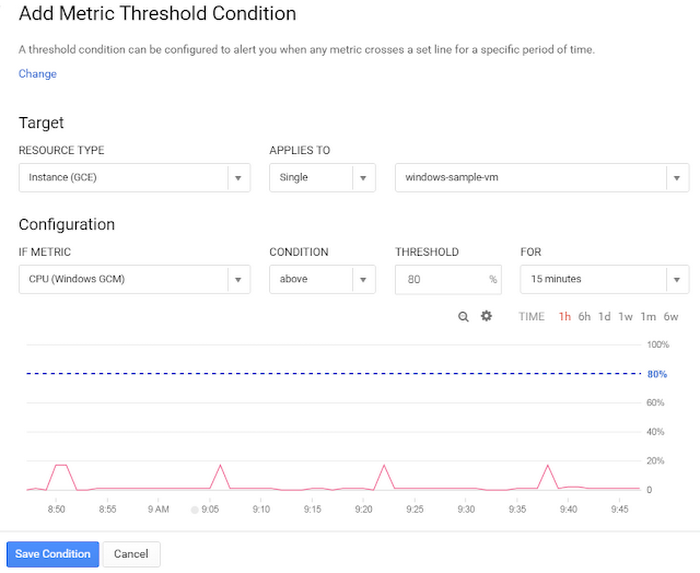
Once the Monitoring agent is up and running, it's time to explore the real power of monitoring — alerting! You can create a policy to alert you when a specific threshold value is crossed. For example, here's how to create a policy that sends a notification when a VM's CPU utilization stays above 80% for more than 15 minutes:
Step 1. Add a metric threshold condition. From the Monitoring main menu select "Alerting > Create a policy." Click "Add Condition." Select a condition type and appropriate threshold.
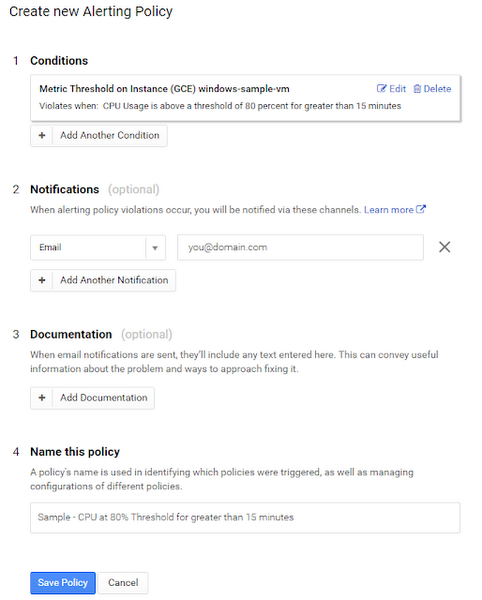
Step 2. Complete the details of the alerting policy. Under "Notification" enter an optional email address to receive alerts via email. Add any other details to the optional "Documentation" field. Finally, name the policy and click "Save Policy."
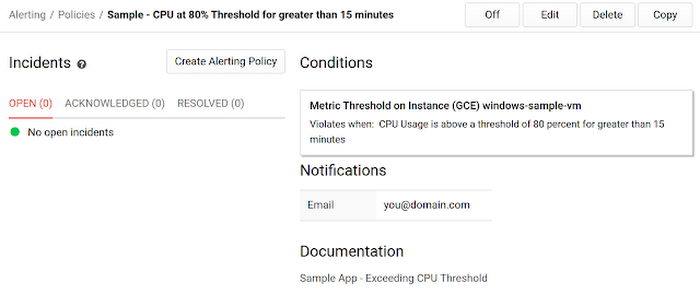
After creating a monitoring policy, you'll see the policy details page along with the status of any incidents:
To monitor web servers, Monitoring has a built-in "Uptime check" alert that continuously pings your VM over HTTP, HTTPS or TCP at a custom interval, helping you ensure that your web server is responding and serving pages as expected.
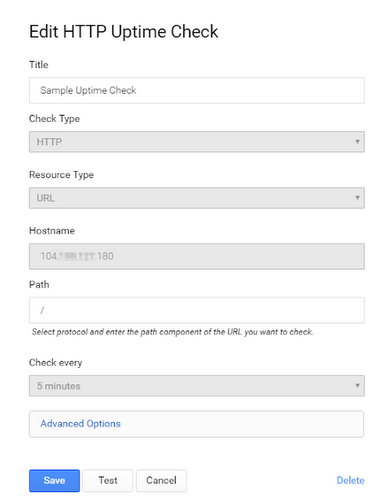
Here's how to create an Uptime check that pings the webserver at the specified hostname every 5 minutes:
- From the Monitoring dashboard click "Create Check" under "Uptime checks."
- Enter the details for the new Uptime check including Name, Check Type, Resource Type, Hostname and Path and specify how often to run the Uptime check under the "Check every" field.
- Click "Save."
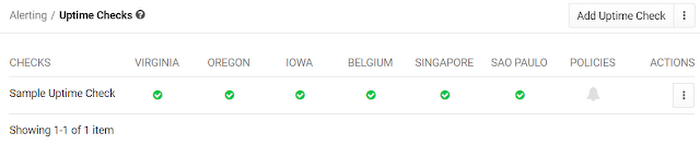
The new Uptime checks page lists the geographic locations from where the checks are being run along with a status indicator:
Logging custom events for .NET Applications
Not only can you monitor resources, but you can also log important events specific to your application. "Google.Cloud.Logging.V2" is a beta .NET client library for Logging that provides an easy way to generate custom event logs using Stackdriver integration with Log4Net.
Step 1: Add the Logging client's Nuget packages to your Visual Studio project.
Right click your solution in Visual Studio and choose "Manage Nuget packages for solution." In the Visual Studio NuGet user interface, check the "Include prerelease" box, search for the package named "Google.Cloud.Logging.V2" and install it. Then install the "Google.Cloud.Logging.Log4Net" package in the same way.
Step 2: Add a Log4Net XML configuration section to your web application's Web.config file containing the following code:
Step 3: Configure Log4net to use Logging by adding the following line of code to your application’s Global.asax.cs file:
. The Application_Start() method in Global.asax.cs should look like this:
Step 4: Add this statement to your application code to include the client libraries:
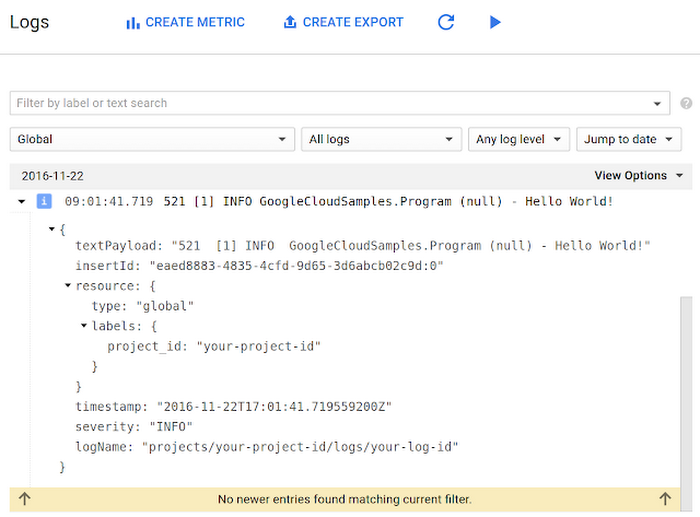
Step 5: To write logs that will appear in the Stackdriver Logs Viewer, add the following code to your application:
Once you build and run this code, you'll get log entries that look like this:
See the "How-To" documentation for installing and using the Logging client Nuget package for .NET applications.
Error Reporting for .NET Applications
Even if your VMs are running perfectly, your application may encounter runtime exceptions due to things like unexpected usage patterns. Good news! We recently released the beta Stackdriver Diagnostics ASP.NET NuGet package for Compute Engine VMs running .NET. With it, all exception errors from your application are automatically logged to Error Reporting.
Step 1: Enable the Error Reporting API.
Step 2: Right-click your solution in Visual Studio, choose "Manage Nuget packages for solution."
Check the "Include prerelease" checkbox. Search for the package named "Google.Cloud.Diagnostics.AspNet" and then install the package.
Step 3: Add the library to your application code:
Step 4: Add the following code to the "Register" method of your .NET web app:
public static void Register(HttpConfiguration config)
Here's an example of the exceptions you'll see in Error Reporting:
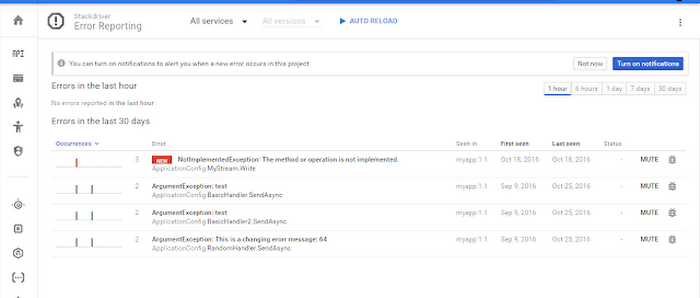
Click on an exception to see its details:
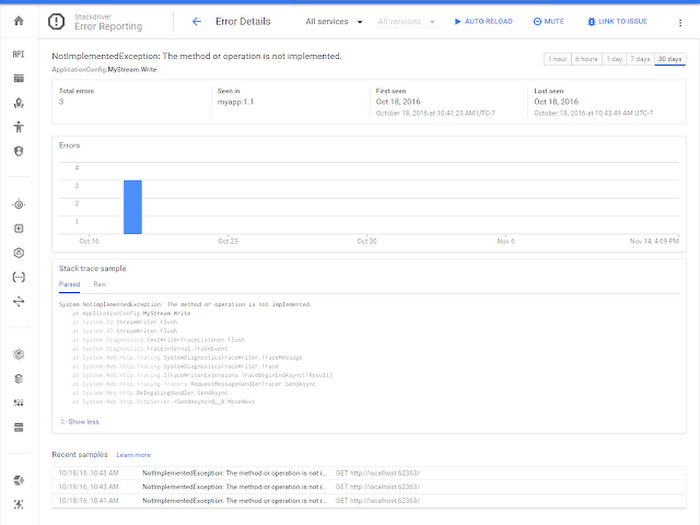
See the "How-To" documentation for installing and using the Stackdriver Diagnostics ASP.NET NuGet package for .NET applications.
Try it out
Now that you know how easy it is to log, monitor and enable error reporting for .NET applications on Google Cloud, go ahead and deploy a .NET application to Google Cloud for yourself. Next install the Logging and Monitoring agents on your VM(s) and add the Stackdriver Diagnostics and Logging client packages to your application. You can rest easier knowing that you're logging exactly what's going on with your application and that you'll be notified whenever something goes bump in the night.