Is your pipeline fine? Managing and monitoring a Cloud Dataflow setup
Ravi Upreti
Platform Engineer Lead, Qubit
Saira Hussain
Editor’s note: Today we’re hearing from Qubit, which builds personalization technology for online customer experiences. Here’s how they’re keeping their data analytics pipelines healthy.
Establishing and maintaining data pipelines is essential for Qubit, delivering the data and insights we need to power real-time personalization for the world’s leading brands. In our previous post, we talked about our journey to build high-throughput, low-latency, streaming data collection and processing pipelines on Google Cloud Platform (GCP) using Cloud Dataflow, Cloud Pub/Sub and BigQuery.
Cloud Dataflow, in particular, is a fully managed service that takes away a lot of the pain of managing a pipeline once it’s up and running. Features such as autoscaling and dynamic work rebalancing make Cloud Dataflow pipelines very efficient, self-sustaining systems that need very little external tuning to keep them functioning. This reduces the cost of maintaining the system to the bare minimum.
However, at our scale, we felt we needed a simpler way to automatically launch and update pipelines. In this post, we’ll discuss how we manage and monitor our Cloud Dataflow pipelines as we work to further automate them, and troubleshoot when problems arise.
Streamlining pipeline management
While writing and testing a pipeline or new pipeline features, it’s common to launch it multiple times, testing out various deployment options. You can either set execution options for the pipeline in code as Cloud Dataflow PipelineOptions, or take them from command-line arguments. This can make it awkward to tweak options when testing or executing the pipeline in different environments, such as development or production, because you have to re-launch it every time It would be much easier to keep the options in environment-specific configuration files and tweak them as needed. Also, it would make hooking up the deployment of the pipeline to a CI/CD tool such as Cloud Build seamless and easy.
With this in mind, we developed the Dataflow launcher, an open-source CLI tool written in Python, to launch and manage our Cloud Dataflow pipelines. The tool reads the pipeline configuration from a configuration file and launches the packaged pipeline code in Cloud Dataflow. This lets you localize your pipeline configurations in simple, easy-to-read and manageable config files, making it simple to update the pipeline options. It also means that configurations for different execution environments, such as staging or production, can be kept separately in their own configuration files, further simplifying integration with CI/CD tools. In addition, this mitigates the risk of accidental deployments to the wrong environment—for example, to production.
You can keep configurations in individual environment-specific files along with the rest of the pipeline code base in a version control system such as GitHub. You can then launch or update the pipeline by configuring your CI/CD tool, like Cloud Build, to trigger on every commit to the release branch. The dataflow launcher also allows you to automate the creation of Cloud Pub/Sub resources like topics or subscriptions, if needed, before launching the pipeline. This eliminates the pain of setting up these resources manually before launching.
The Dataflow launcher has helped us automate the process of Cloud Dataflow pipeline management by further simplifying deployments. We wrote it to support pipelines written in Java. However, Apache Beam now has Python and GO SDKs. The tool does not support pipelines written in these languages at the moment, but adding support for these languages is in the roadmap. The project is also open source and we welcome contributions from the community.
Developing pipeline monitoring
Here at Qubit, we take monitoring customer-specific metrics for our data ingestion pipeline very seriously. The event data emitted from all our customers’ web and mobile endpoints flow through the same ingestion pipeline, which validates, enriches and persists the data in BigQuery. For the purposes of monitoring, reporting and debugging issues, we often need to rely on metrics that are “namespaced”—labeled and identified by customer IDs. For example, problems ingesting data for a specific customer can often be traced back to poor quality of the ingested data points. This means that the events for those customers are invalidated by the validation dataflow. The easiest way to detect this problem is to track the metrics emitted by the validation pipeline and set alarms on these metrics.
We rely on Stackdriver and the Cloud Dataflow monitoring interface to monitor performance, execution, and general health-related metrics for our pipeline. We use Stackdriver to monitor the Cloud Pub/Sub topics that pipe the data between different stages and have extensive Stackdriver dashboards and alerts set up for the general health of the system. We also rely on the Cloud Dataflow monitoring interface and Stackdriver logs to debug any issues. Tracing and debugging any issues is easy and intuitive, since we continually get insights about the internal workings of the pipeline and metrics such as watermarks and system lag.
We also need to monitor custom metrics, like data quality and BigQuery writes, for individual customers. This requires namespaced metrics, a feature that Cloud Dataflow doesn’t currently support. This presented a very interesting and challenging problem: What’s the best way to monitor a fully managed, serverless service such as Cloud Dataflow?
Part of the challenge stems from the fact that we use Prometheus for metric collection and alerts for a lot of our internal systems, and Grafana for our metrics dashboards. Prometheus works on a pull model for metric collection, although it does provide a push gateway too. It requires the service it monitors to run a web endpoint, from which it periodically scrapes metrics. Therefore, ideally, the service needs to expose an HTTP endpoint that can be used for this purpose. This is not possible in Cloud Dataflow.
The Cloud Dataflow pipeline code is converted into an execution graph before it is deployed. (Find more about the execution graph and how a Cloud Dataflow job is deployed.) There’s no easy way to inject code to pipeline code such that each worker can run a web server as well. Even if we could expose a web server somehow, say by starting a web server in every transform and tearing it down when a transform wraps up, we would still have to expose the endpoints in multiple workers so that the Prometheus server could reach them. This is not a viable plan.
An easier solution is to somehow use a push model to send custom metrics to the Prometheus server. This is where StatsD exporter comes into play. The StatsD exporter takes in StatsD-style metrics and exposes an HTTP endpoint from which Prometheus can scrape the metrics, while also translating the StatsD metrics to Prometheus metrics using a configurable mapping. This allows us to add custom metrics to the data pipeline.
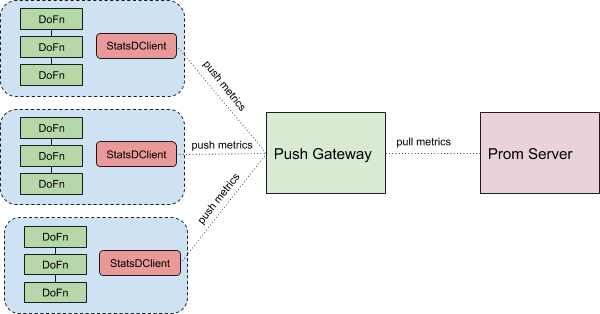
We tag and label the metrics in the pipeline code, for example by client ID and pipeline stage. Using the datadog statsd client, we then send them to the Prometheus gateway, which is an instance of StatsD exported running in a Google Kubernetes Engine (GKE) cluster. Our Prometheus server then scrapes the metrics from the gateway, allowing us to set up alarms and dashboards on the metrics, like we do for all the other services we monitor with Prometheus. You can easily abstract away the code for sending the metrics into a wrapper around the usual DoFn; that way, all the methods to record the metrics are available in the DoFn code and its “startBundle” method sets up and registers the metrics service. Problem solved! Here’s what it looks like:
This hybrid setup, with Stackdriver metrics, alerts and logs for general health and debugging, and Prometheus with StatsD exporter for custom client level metrics, covers all our monitoring and alerting needs for the core ingestion pipeline.
We’ll next discuss how we manage schemas for thousands of event types. In the meantime, learn more about Qubit and about how Cloud Dataflow works.