The Python 2 SDK includes the Appstats library used for profiling the RPC (Remote Procedure Call) performance of your application. An App Engine RPC is a roundtrip network call between your application and an App Engine Service API. For example, all of these API calls are RPC calls:
- Datastore calls such as
ndb.get_multi(),ndb.put_multi(), orndb.gql(). - Memcache calls such as
memcache.get(), ormemcache.get_multi(). - URL Fetch calls such as
urlfetch.fetch(). - Mail calls such as
mail.send().
Optimizing or debugging a scalable application can be a challenge because numerous issues can cause poor performance or unexpected costs. These issues are very difficult to debug with the usual sources of information, like logs or request time stats. Most application requests spend the majority of their time waiting for network calls to complete as part of satisfying the request.
To keep your application fast, you need to know:
- Is your application making unnecessary RPC calls?
- Should it cache data instead of making repeated RPC calls to get the same data?
- Will your application perform better if multiple requests are executed in parallel rather than serially?
The Appstats library helps you answer these questions and verify that your application is using RPC calls in the most efficient way by allowing you to profile your RPC calls. Appstats allows you to trace all RPC calls for a given request and reports on the time and cost of each call.
Optimizing your application's RPC usage may also reduce your bill. See Managing App Resources.
Setup
There is nothing to download or install to begin using Appstats. You just need to configure your application, redeploy, and access the Appstats console as described in the steps below. The Appstats library takes care of the rest.
1. Install the event recorder
To record statistics about web requests, each request handler for your application must invoke Appstats. Depending on the framework used by your application, choose one of the following:
WSGI request handlers
To use Appstats with WSGI request handlers, including WSGI frameworks such as webapp2, you must wrap your WSGI application with the appstats middleware. The simplest way to accomplish this is to define a WSGI middleware to wrap every WSGI application using
appengine_config.py.If it does not already exist, create a file named
appengine_config.pyin your application's root directory. Add the following function to the file:Before invoking your WSGI application, the runtime will import this file and call the
webapp_add_wsgi_middlewarefunction, if found.See Optional Configuration below for more information on
appengine_config.py.Django framework
To install the Appstats middleware in a Django application, edit your
settings.pyfile, and add the following line to be the first item inMIDDLEWARE_CLASSES:MIDDLEWARE_CLASSES = ( 'google.appengine.ext.appstats.recording.AppStatsDjangoMiddleware', # ... )
The Appstats middleware must be the first item, so the profiler can include other middleware in its statistics.
The Django middleware calls Appstats to record events, as appropriate. You do not need to change any other application code.
2. Set the console path
The Appstats console is accessed by visiting a URL for your application in a web browser. You must set the path of the URL in one of two ways:
Default URL
To map Appstats to the default directory (
/_ah/stats/), add theappstatsbuiltin to yourapp.yamlfile:Custom URL
If you need to map Appstats to a directory other than the default, you can use the
urldirective inapp.yaml:- url: /stats.* script: google.appengine.ext.appstats.ui.app
3. Optional configuration
You can configure the behavior of Appstats by adding content to the appengine_config.py file in your application's root directory. For a complete example of configuration options, see the file google/appengine/ext/appstats/sample_appengine_config.py in the SDK.
Some things to know about appengine_config.py:
- If your request handlers modify
sys.path, you must make the same modifications tosys.pathinappengine_config.pyso the Appstats web interface can see all files.
Displaying cost
AppStats can keep track of RPC cost as well as time. If your application is fast enough but more expensive than you expect, look for operations that cost more than you expect. To turn on cost tracking, set appstats_CALC_RPC_COSTS = True in your appengine_config.py file.
4. Test Appstats from the development server
You can test your Appstats setup with the development server. If you configured the console path to use the default URL above, you can access the console at http://localhost:8080/_ah/stats/.
5. Deploy
Once you are satisfied with your Appstats setup, deploy your application. If you configured the console path to use the default URL above, you can access the console at http://your_app_id.appspot.com/_ah/stats.
A tour of the Appstats console
The Appstats Console provides high-level information on RPC calls made, URL paths requested, a history of recent requests, and details of individual requests:
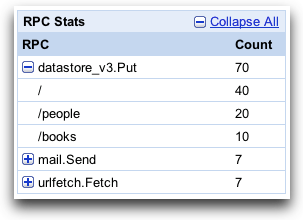
The RPC Stats table shows statistics for each type of RPC made by your application. Clicking a plus button expands the entry to show a breakdown by path request for the RPC:

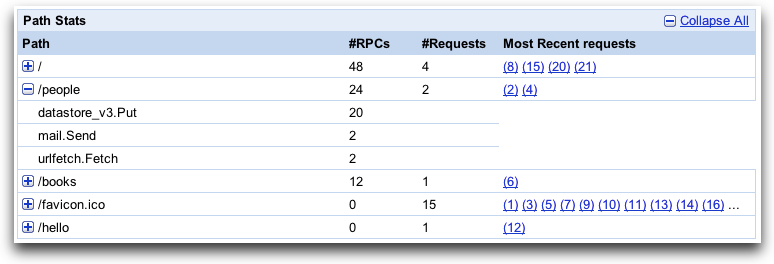
The Path Stats table shows statistics for each path request sent to your application. Clicking a plus button expands the entry to show a breakdown by RPC for the path request:

If you have enabled the API cost tracking feature, this will also display costs.
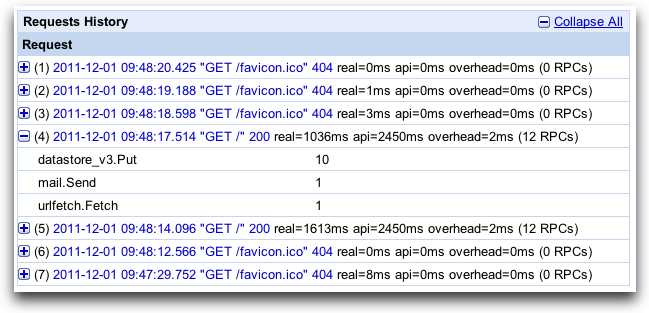
The Requests History table shows data pertaining to individual requests. Clicking a plus button expands the entry to show a breakdown by RPC. Clicking on a request link shows a timeline for the request including individual RPC timing:

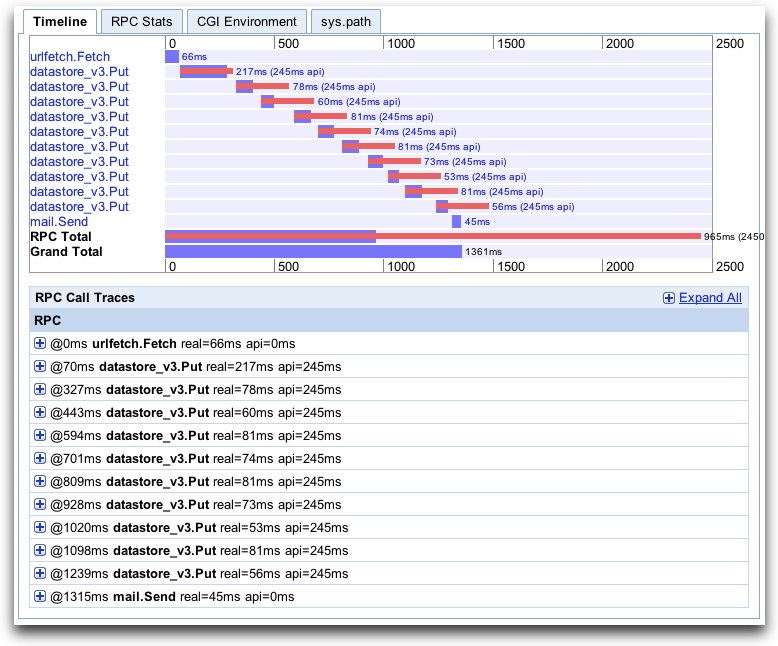
The RPC Timeline graph shows when specific RPC calls were made and how long the requests took to process. The RPC Total bar shows the total time spent waiting on RPC calls, and the Grand Total bar shows total time spent processing the request. As you can see from the timeline below, the majority of time was spent on RPC calls. This is often the case. The other tabs show additional information about the request. Understanding the impact of RPC calls on your application response time is invaluable when analyzing its performance.

The Interactive Playground allows developers to enter arbitrary Python code into a web form and execute it inside their app's environment.
After navigating to Appstats, click the link for the Interactive Playground. A form with a single text area will display. Enter any arbitrary Python code you like in the text area, then submit the form to execute it. Any results that were printed to the standard output are displayed next to the text area, and a Timeline analysis of the RPC calls generated by your code is displayed.
The Interactive Playground can be enabled or disabled. In the SDK, it is enabled by default; in production is disabled by default. To enable it, add the following line to your
appengine_config.pyfile:<pre suppresswarning="yes" class="prettyprint"> appstats_SHELL_OK = True </pre>
How it works
Appstats uses API hooks to add itself to the remote procedure call framework that underlies the App Engine service APIs. It records statistics for all API calls made during the request handler, then stores the data in memcache, using a namespace of __appstats__. Appstats retains statistics for the most recent 1,000 requests. The data includes summary records, about 200 bytes each, and detail records, which can be up to 100 KB each. You can control the amount of detail stored in detail records. (See Optional Configuration and the example configuration file.)
The API hooks add some overhead to the request handlers. Appstats adds a message to the logs at the "info" level to report the amount of resources consumed by the Appstats library itself. The log line looks something like this:
<pre suppresswarning="yes" class="prettyprint">
INFO 2009-08-25 12:04:07,277 recording.py:290] Saved; key: __appstats__:046800, part: 160 bytes, full: 25278 bytes, overhead: 0.019 + 0.018; link: http://your_app_id.[REGION_ID].r.appspot.com/stats/detail?time=1234567890123
</pre>
This line reports the memcache key that was updated, the size of the summary (part) and detail (full) records, and the time (in seconds) spent recording this information. The log line includes the link to the Appstats administrative interface that displays the data for this event.
