This document shows how to create a set of recommended custom dashboards for monitoring your clusters created in Google Distributed Cloud (software only) for VMware.
Permissions for creating dashboards
To create dashboards, your Google Account must have the following permissions to create dashboards:
monitoring.dashboards.createmonitoring.dashboards.deletemonitoring.dashboards.update
You'll have these permissions if your account has one of the following roles. You can check your permissions (in the Google Cloud console):
monitoring.dashboardEditormonitoring.editor- Project
editor - Project
owner
In addition, to use gcloud (gcloud CLI) to create dashboards, your Google Account must have the serviceusage.services.use permission.
Your account will have this permission if it has one of the following roles:
roles/serviceusage.serviceUsageConsumerroles/serviceusage.serviceUsageAdminroles/ownerroles/editor- Project
editor - Project
owner
Recommended dashboards
After you create a cluster (admin or user), a best practice is to create the following dashboards with Cloud Monitoring to let your operations team monitor cluster health:
- Control plane uptime dashboard
- Pod status dashboard
- Node status dashboard
- VM health status dashboard
- Node utilization dashboard
- Anthos utilization dashboard
If your cluster also runs Windows Server OS nodes, you can create the following dashboards to monitor the status of Windows nodes and Pods:
- Windows node status dashboard
- Windows pod status dashboard
The dashboards are automatically created during admin cluster installation if Cloud Monitoring is enabled.
This section describes how to create these dashboards. For more information about the dashboard creation process described in the following sections, see Managing dashboards by API.
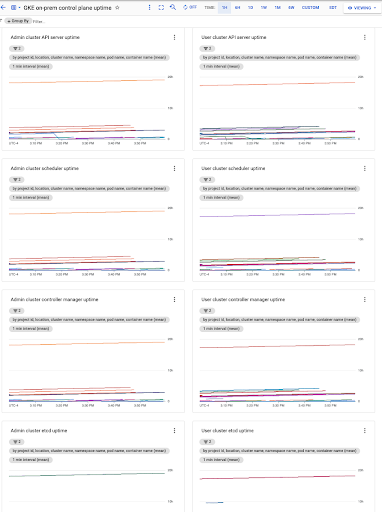
Create a control plane uptime dashboard
The control plane consists of the API server, scheduler, controller manager, and etcd. To monitor the status of the control plane, create a dashboard that monitors the state of these components.
Download the dashboard configuration:
control-plane-uptime.json.Create a custom dashboard with the configuration file by running the following command:
gcloud monitoring dashboards create --config-from-file=control-plane-uptime.json
In the Google Cloud console, select Monitoring, or use the following button:
Select Resources > Dashboards and view the dashboard named GKE on-prem control plane uptime. The control plane uptime of each user cluster is collected from separate namespaces within the admin cluster. The namespace_name field is the user cluster name.
Optionally create alerting policies.
Click to see a sample dashboard.
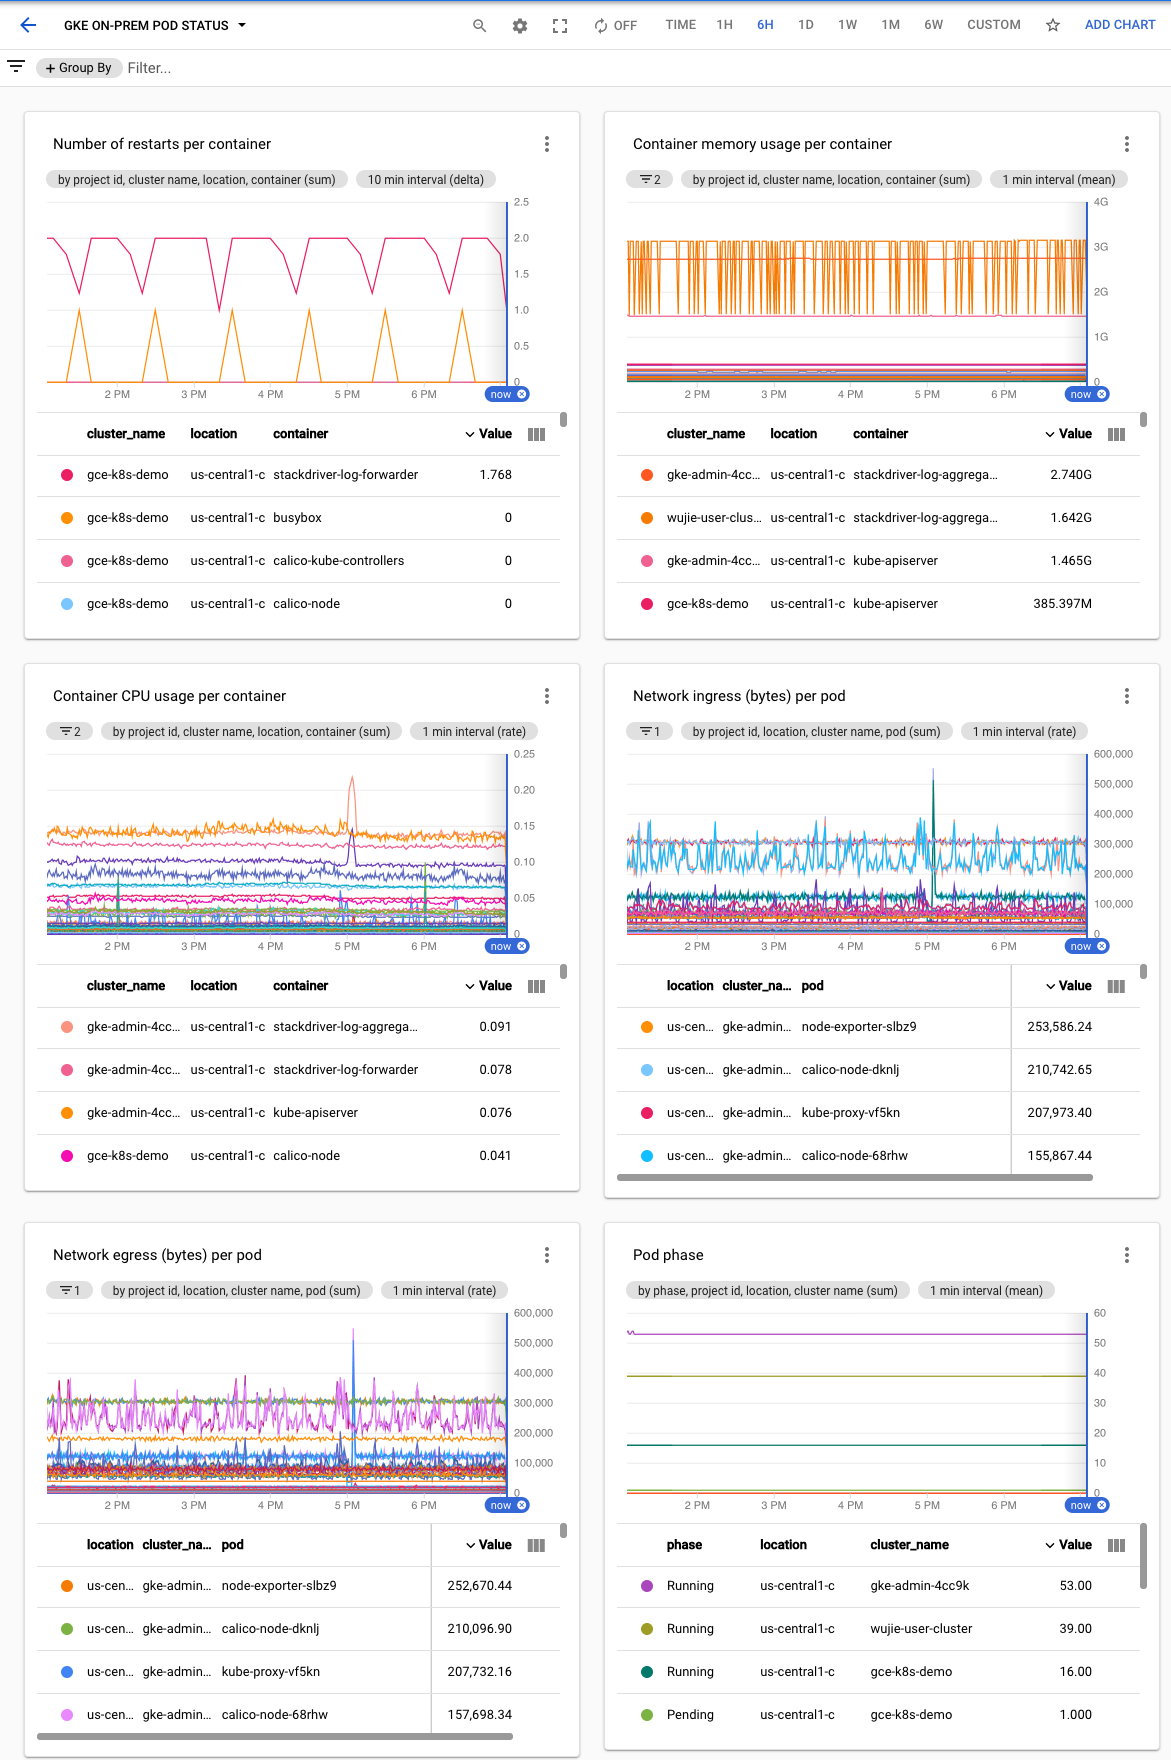
Create a Pod status dashboard
To create a dashboard that includes the phase of each Pod, and the restart times and resource usage of each container, perform the following steps.
Download the dashboard configuration:
pod-status.json.Create a custom dashboard with the configuration file by running the following command:
gcloud monitoring dashboards create --config-from-file=pod-status.json
In the Google Cloud console, select Monitoring, or use the following button:
Select Resources > Dashboards and view the dashboard named GKE on-prem pod status.
Optionally create alerting policies.
Click to see a sample dashboard.
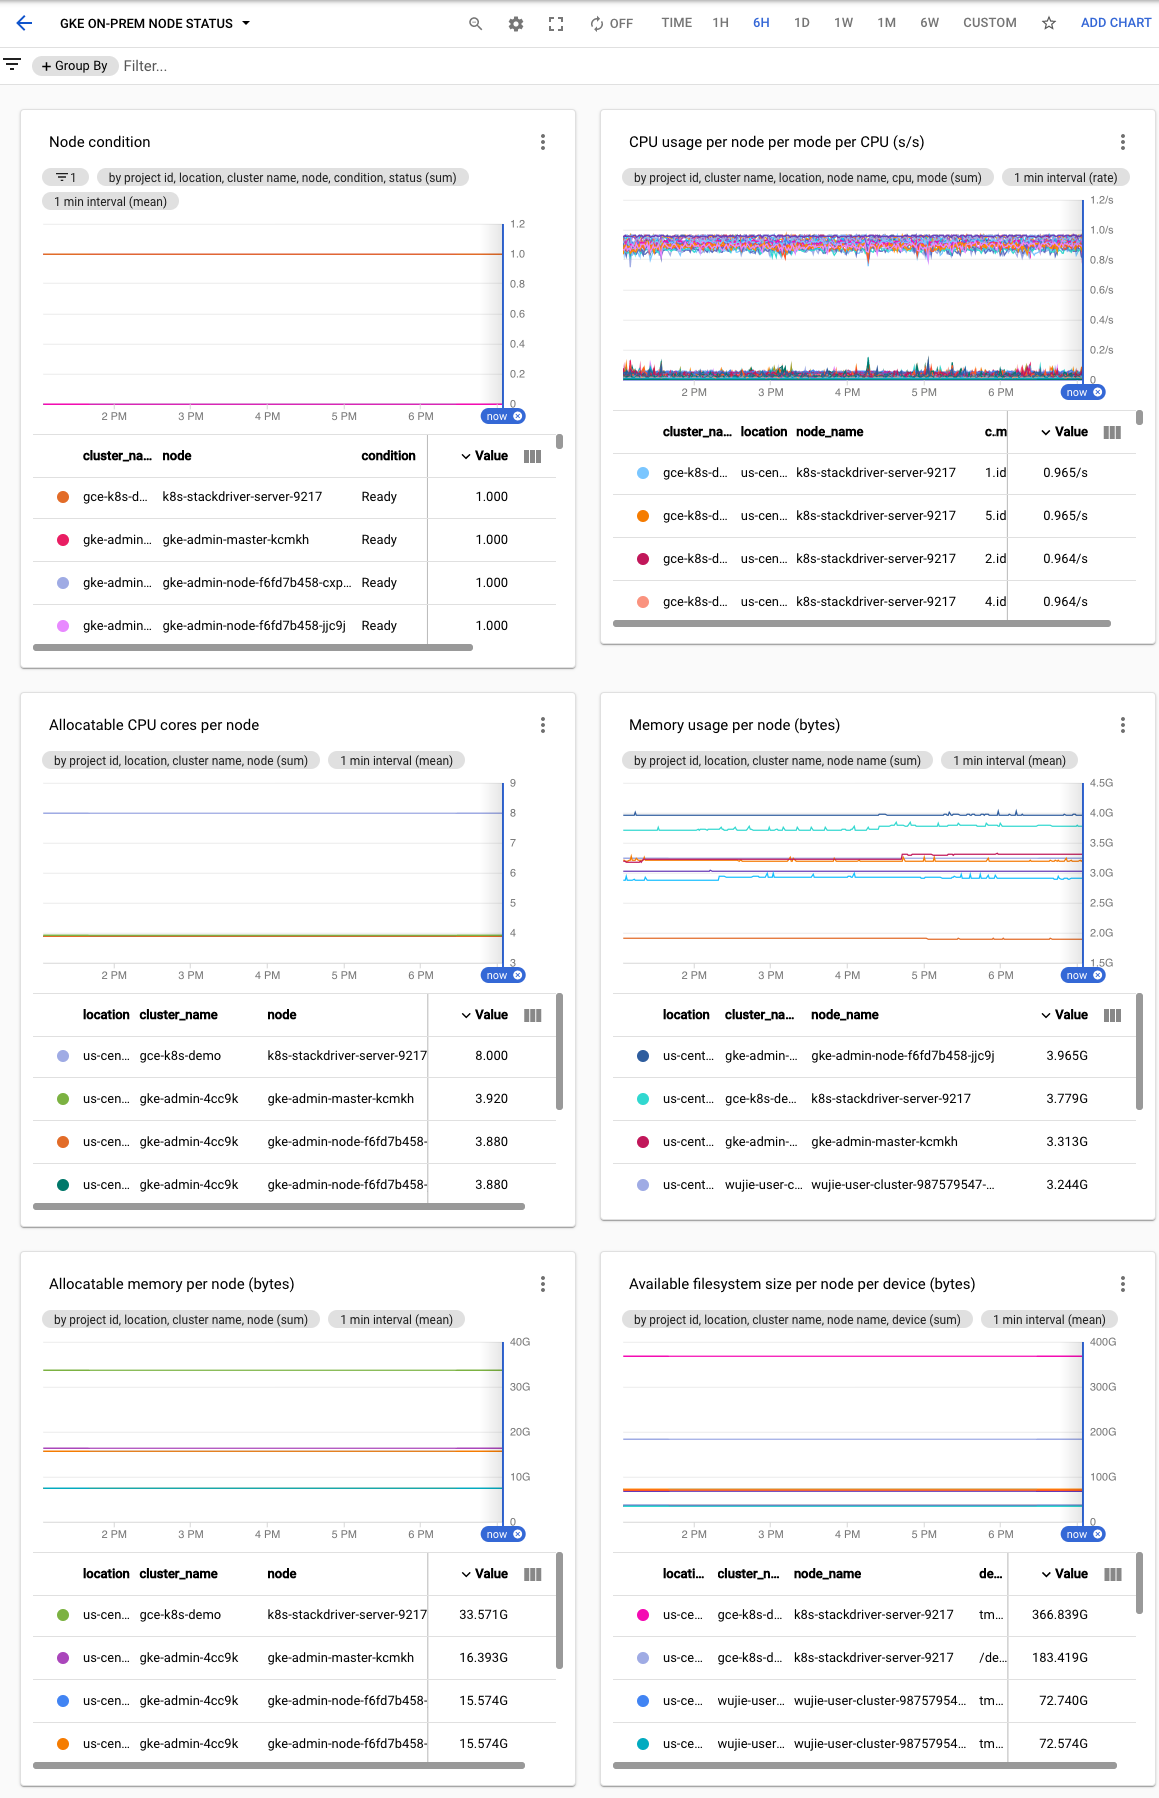
Create a node status dashboard
To create an node status dashboard to monitor the node condition, CPU, memory and disk usage, perform the following steps:
Download the dashboard configuration:
node-status.json.Create a custom dashboard with the configuration file by running the following command:
gcloud monitoring dashboards create --config-from-file=node-status.json
In the Google Cloud console, select Monitoring, or use the following button:
Select Resources > Dashboards and view the dashboard named GKE on-prem node status.
Optionally create alerting policies.
Click to see a sample dashboard.
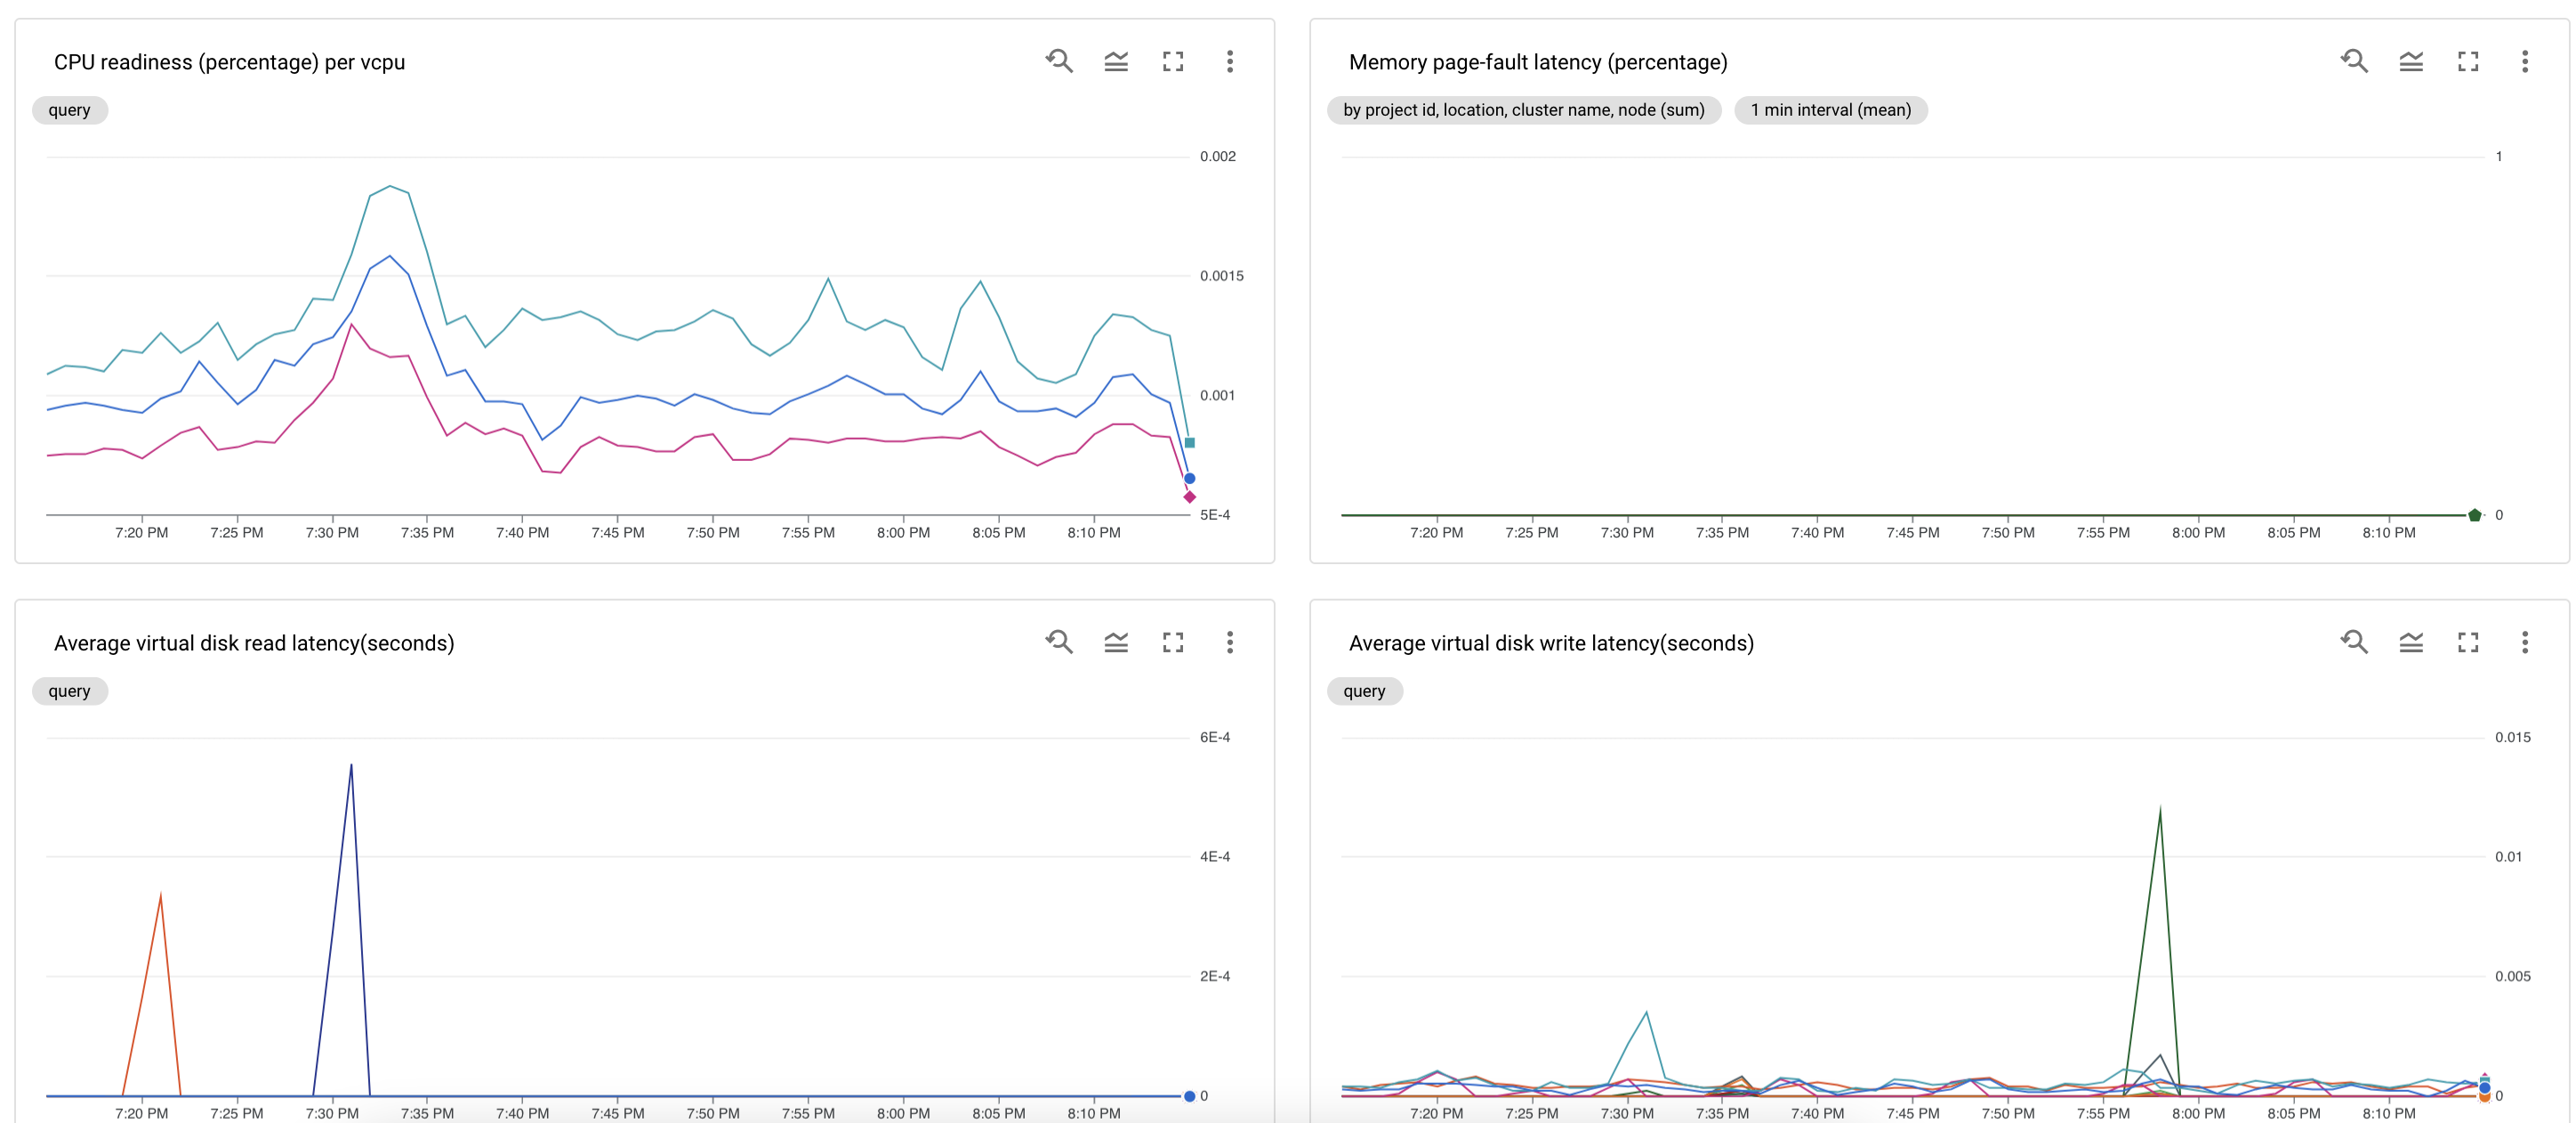
Create a VM health status dashboard
A VM health status dashboard monitors CPU, memory, and disk resource contention signals for VMs in the admin cluster and user clusters.
To create an VM health status dashboard:
Make sure
stackdriver.disableVsphereResourceMetricsis set to false. See User cluster configuration file.Download the dashboard configuration:
vm-health-status.json.Create a custom dashboard with the configuration file by running the following command:
gcloud monitoring dashboards create --config-from-file=vm-health-status.json
In the Google Cloud console, select Monitoring, or use the following button:
Select Resources > Dashboards and view the dashboard named GKE on-prem VM health status.
Optionally create alerting policies.
Click to see a sample dashboard.
Create a node utilization dashboard
A node utilization dashboard shows the following utilization in the cluster:
- Node CPU allocation ratio
- Available vCPUs to schedule Kubernetes workload
- Node memory allocation ratio
- Available memory to schedule k8s workload
- Node disk utilization ratio
To create a node utilization dashboard:
Download the dashboard configuration:
node-utilization.json.Use this configuration file to create a custom dashboard by running the following command:
gcloud monitoring dashboards create --config-from-file=node-utilization.json
In the Google Cloud console, select Monitoring, or use the following button:
Select Resources > Dashboards and view the dashboard named GKE on-prem node utilization.
Optionally create alerting policies.
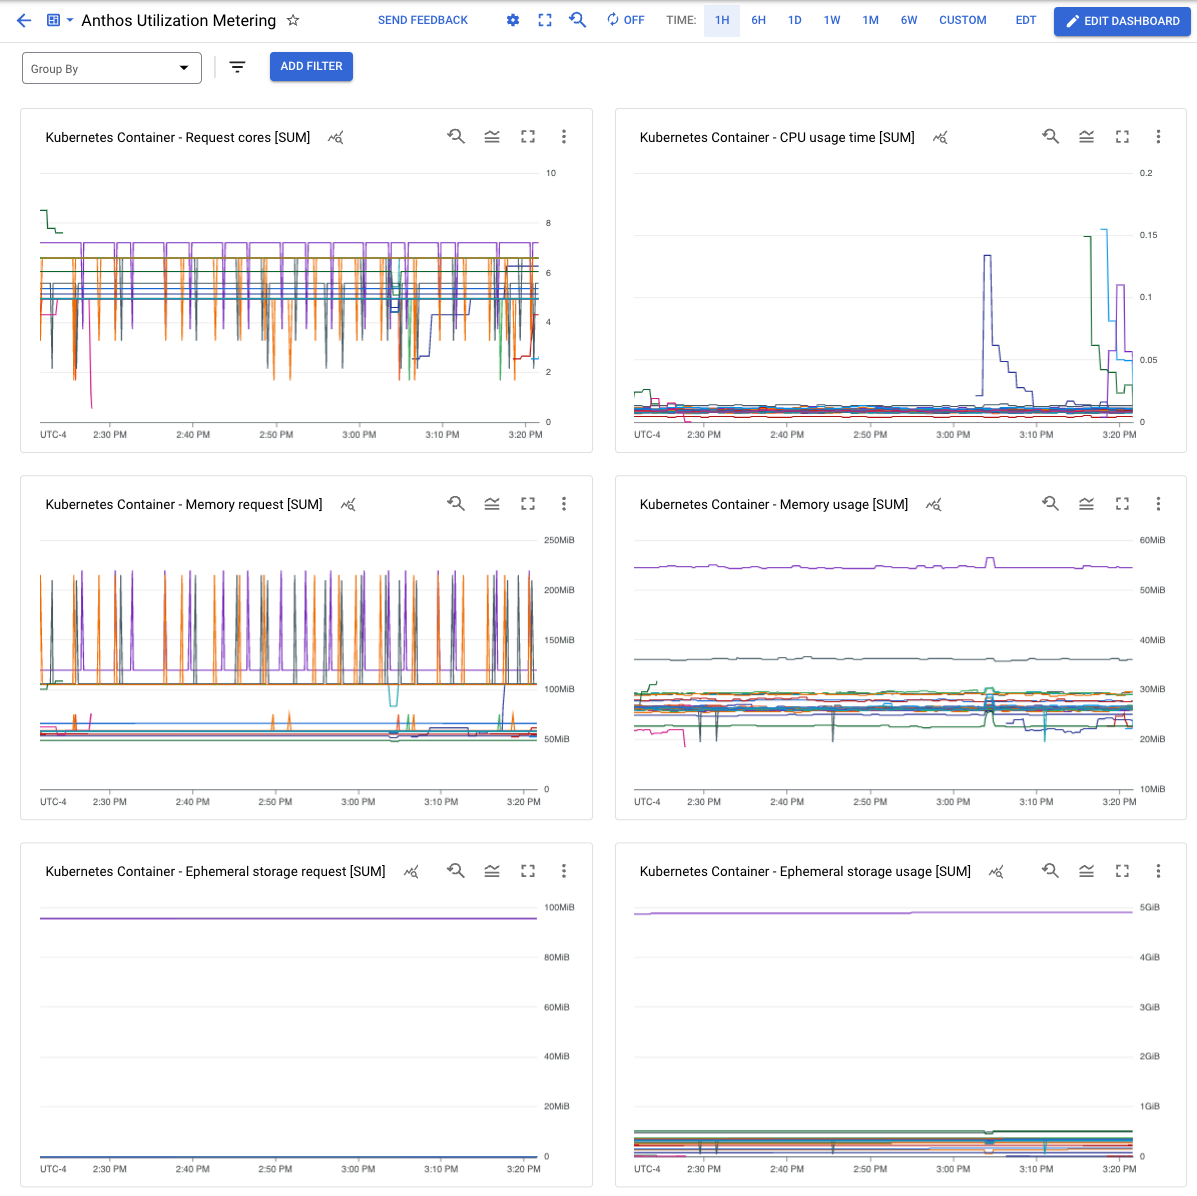
Create an Anthos Utilization Metering dashboard
An Anthos Utilization Metering dashboard shows CPU and memory utilization in the clusters by namespace and Pod labels.
To create an Anthos Utilization Metering dashboard:
Download the dashboard configuration:
anthos-utilization.json.Use this configuration file to create a custom dashboard by running the following command:
gcloud monitoring dashboards create --config-from-file=anthos-utilization.json
In the Google Cloud console, select Monitoring, or use the following button:
Select Resources > Dashboards and view the dashboard named Anthos Utilization Metering.
Optionally create alerting policies.
Click to see a sample dashboard.