Fehlerbehebung bei einem Latenzspitzen für APIs und Dienste
Mit Sammlungen den Überblick behalten
Sie können Inhalte basierend auf Ihren Einstellungen speichern und kategorisieren.
In diesem Dokument wird der Debugging-Prozess beschrieben, um die Nutzung von APIs und Diensten in der Google Cloud -Konsole und den zugehörigen Latenzspitzen nachzuvollziehen.
Gehen Sie zuerst so vor, um Konversations-IDs mit hoher Latenz zu ermitteln:
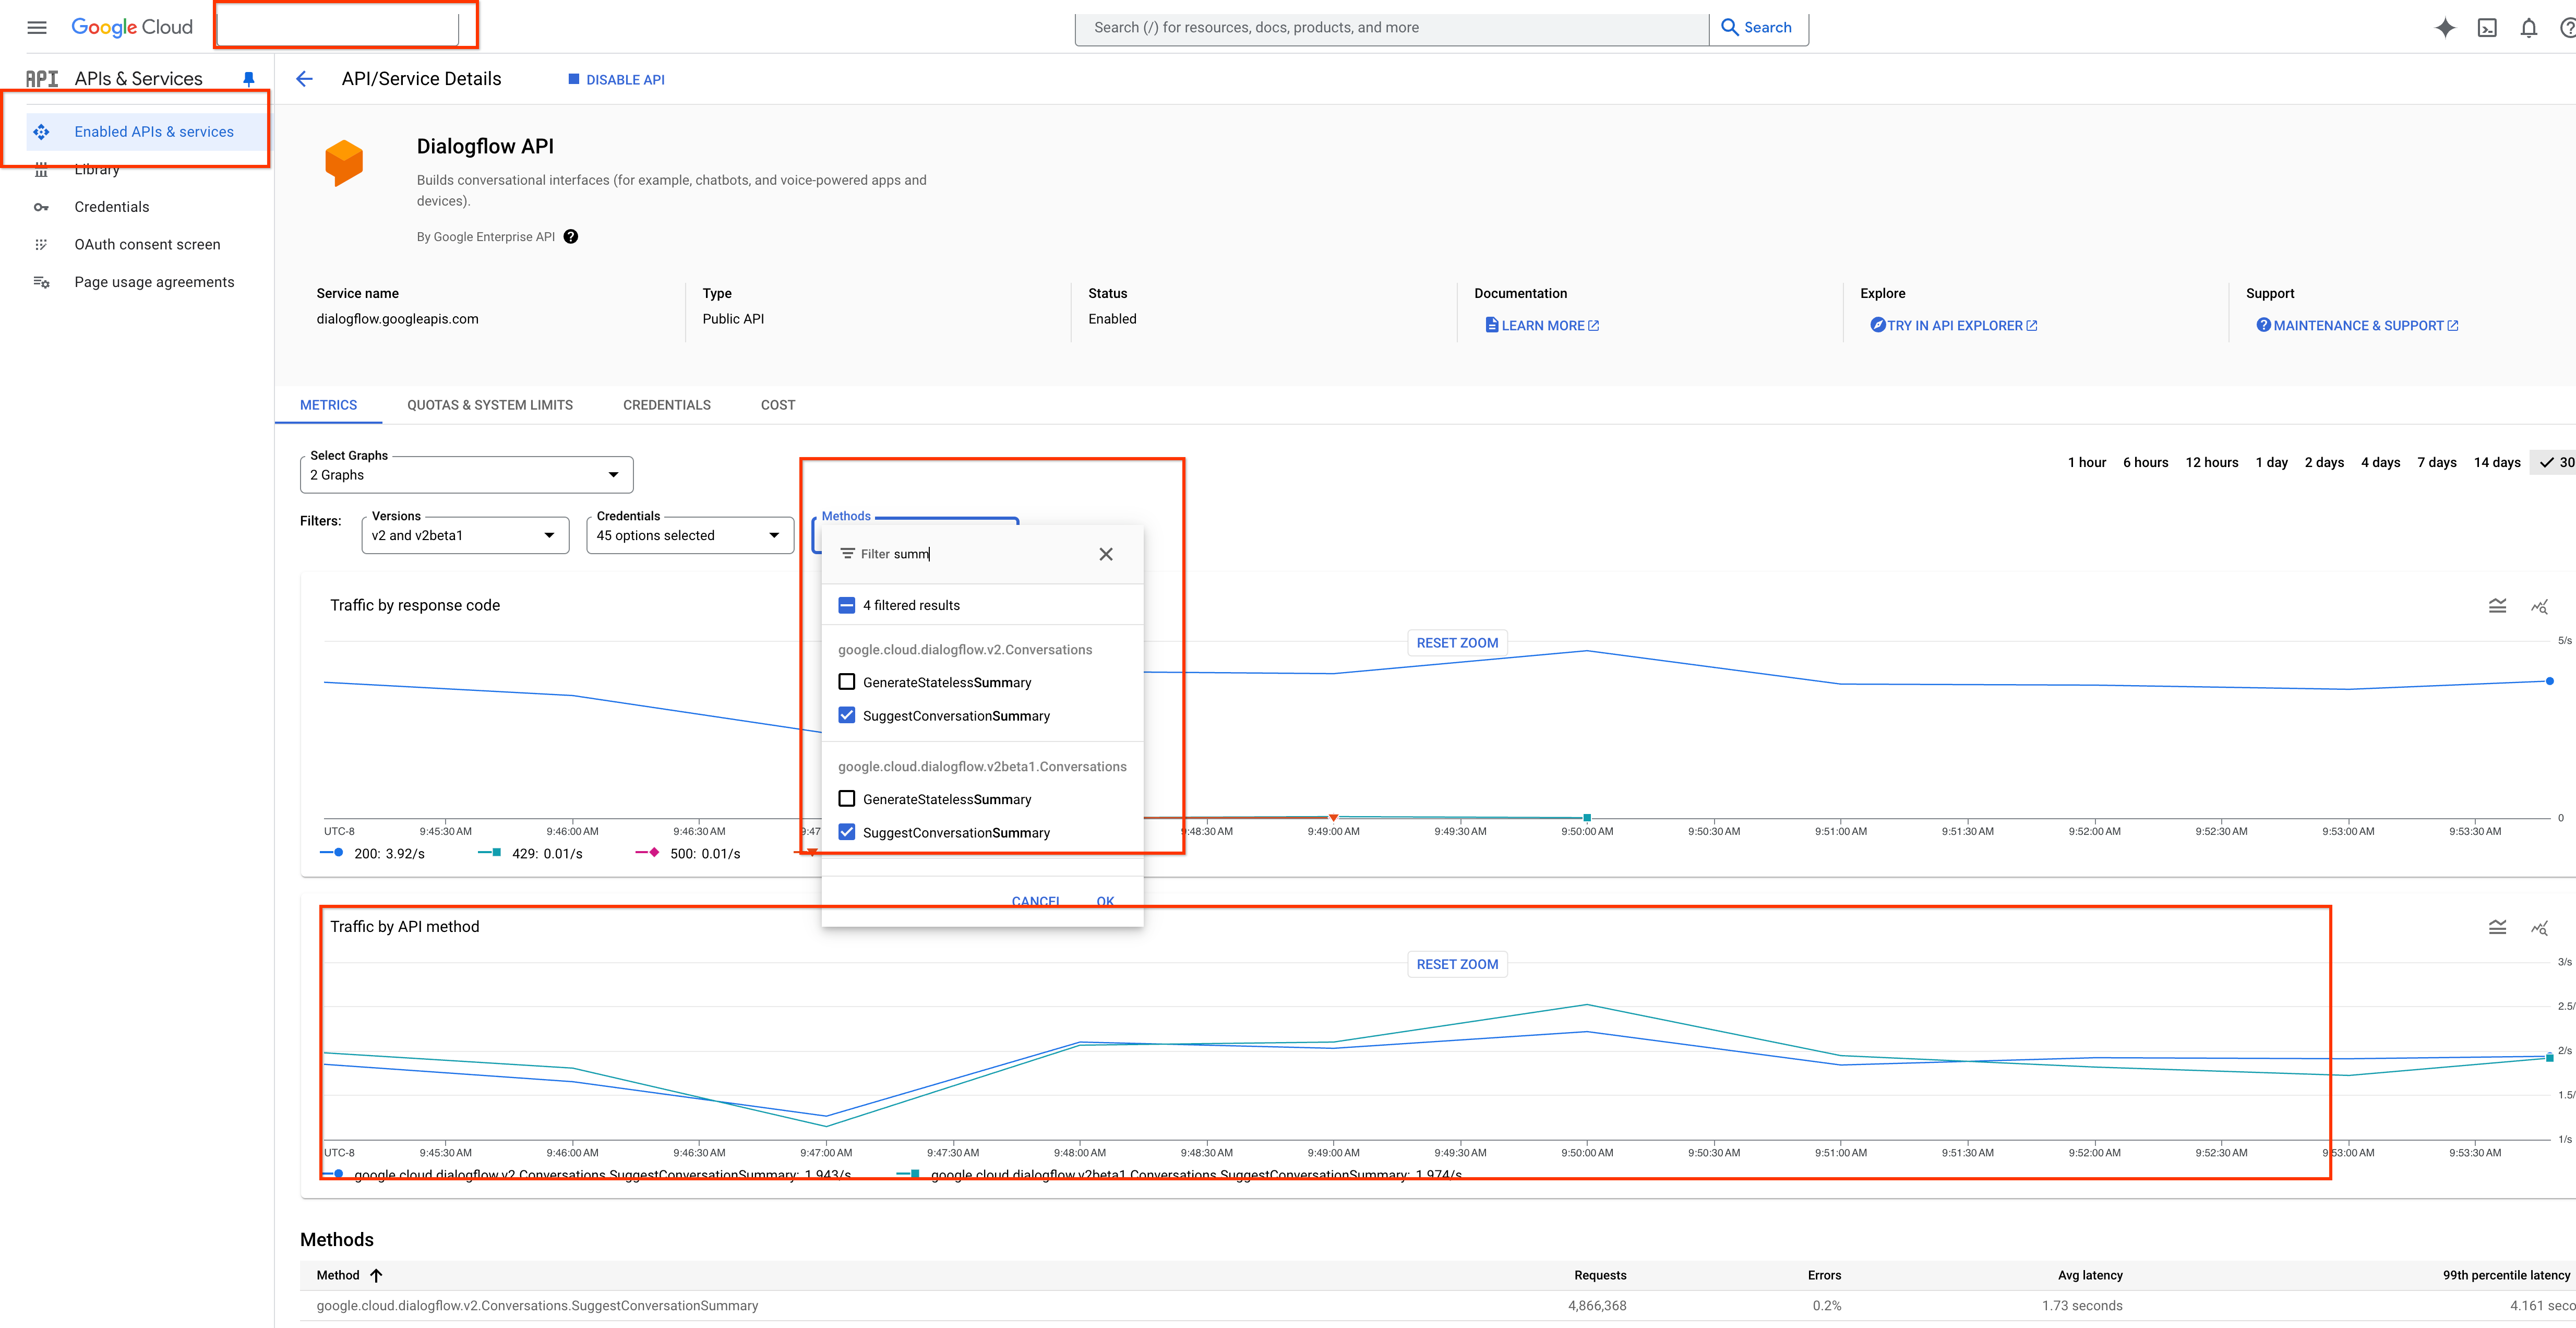
Rufen Sie Messwerte auf und wählen Sie unter Methoden die Option API-Methode aus.
Das Diagramm für die Latenz wird angezeigt und ist mit Traffic nach API-Methode beschriftet.
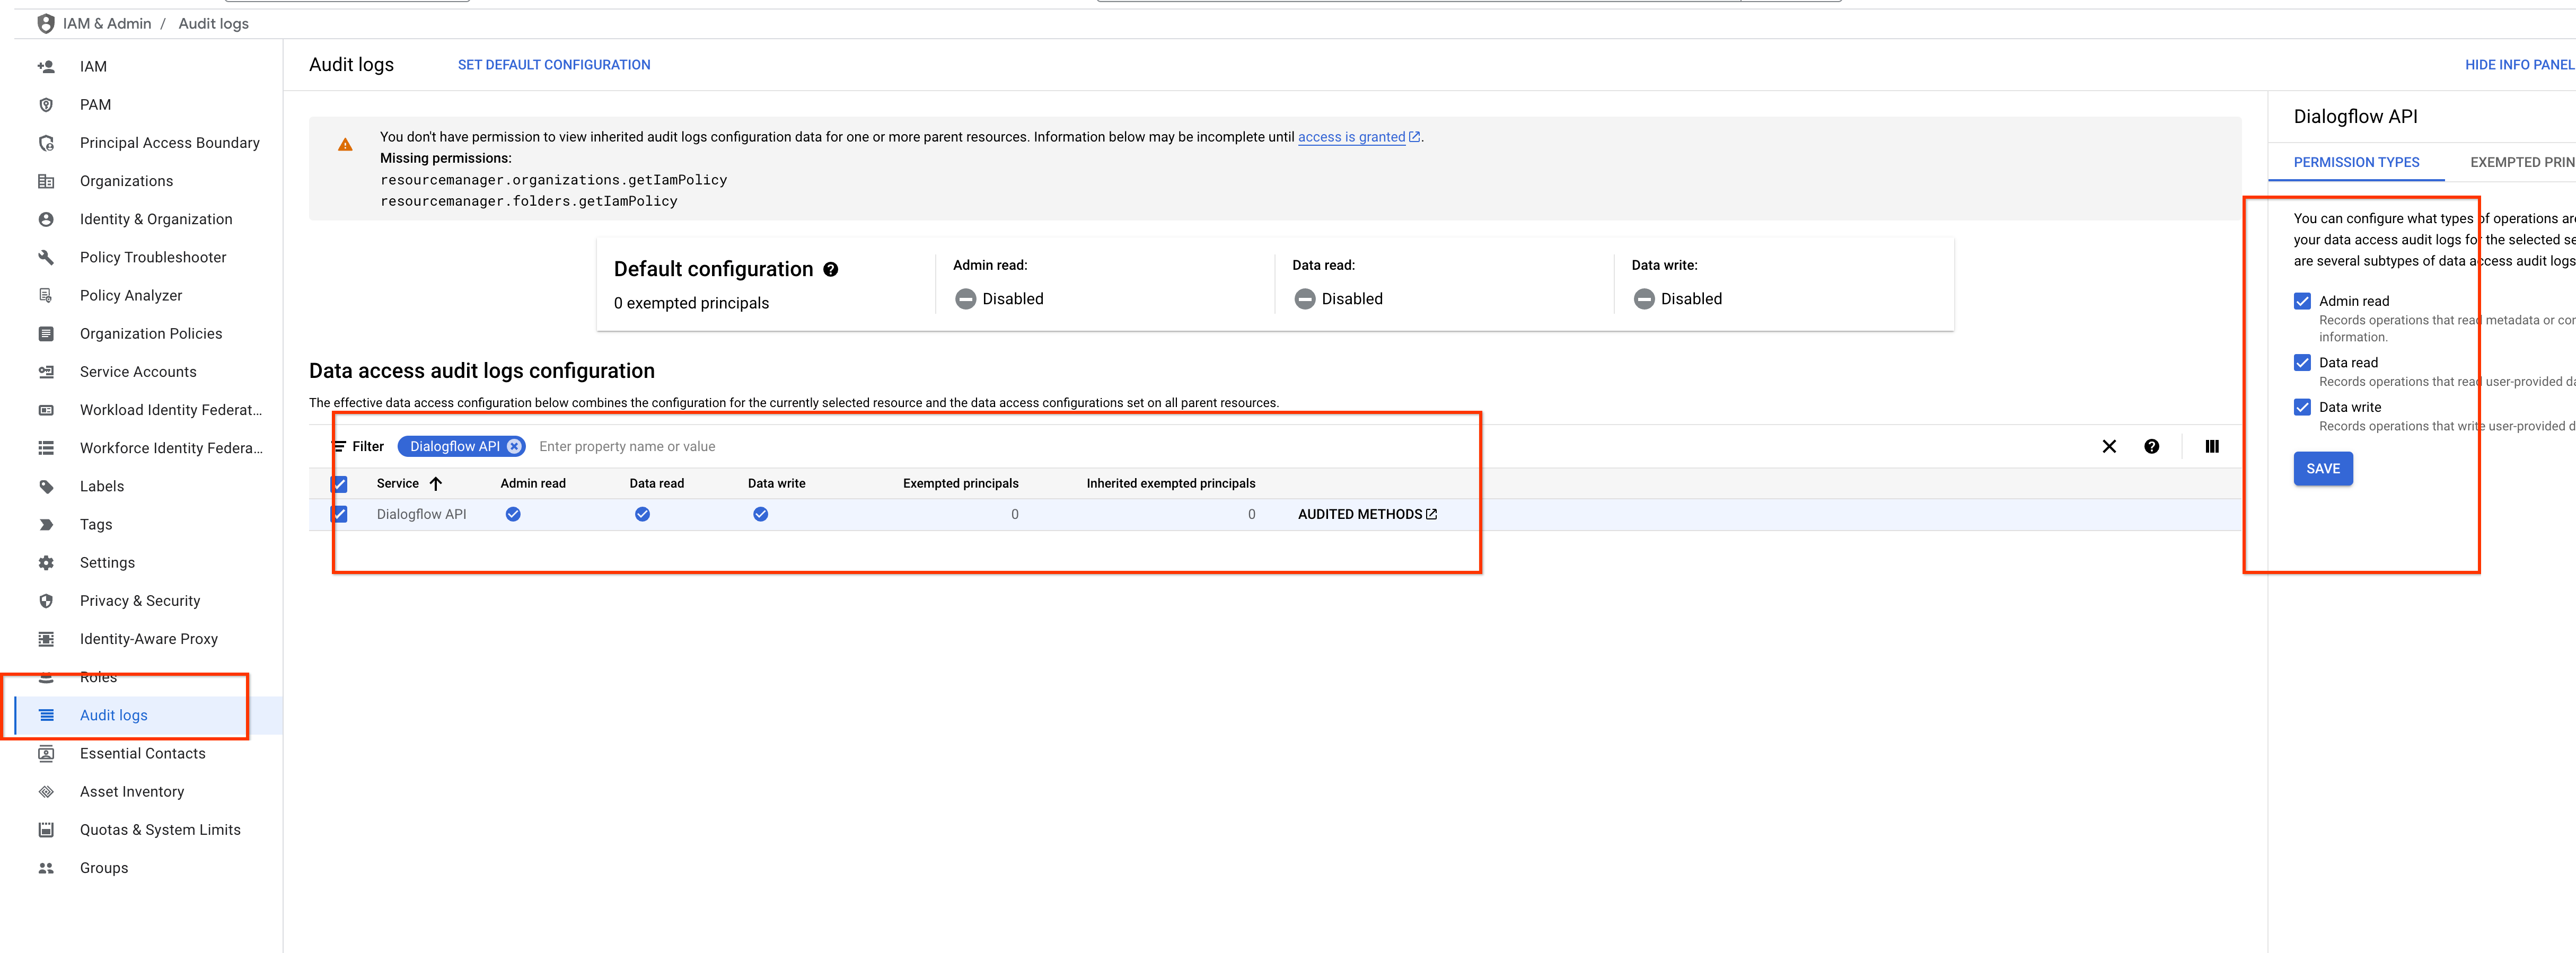
Achten Sie als Nächstes darauf, dass Sie das Audit-Logging aktivieren.
Rufen Sie die Audit-Logs auf.
Aktivieren Sie die Optionen Admin Read, Data Read und Data Write.
Klicken Sie auf Speichern.
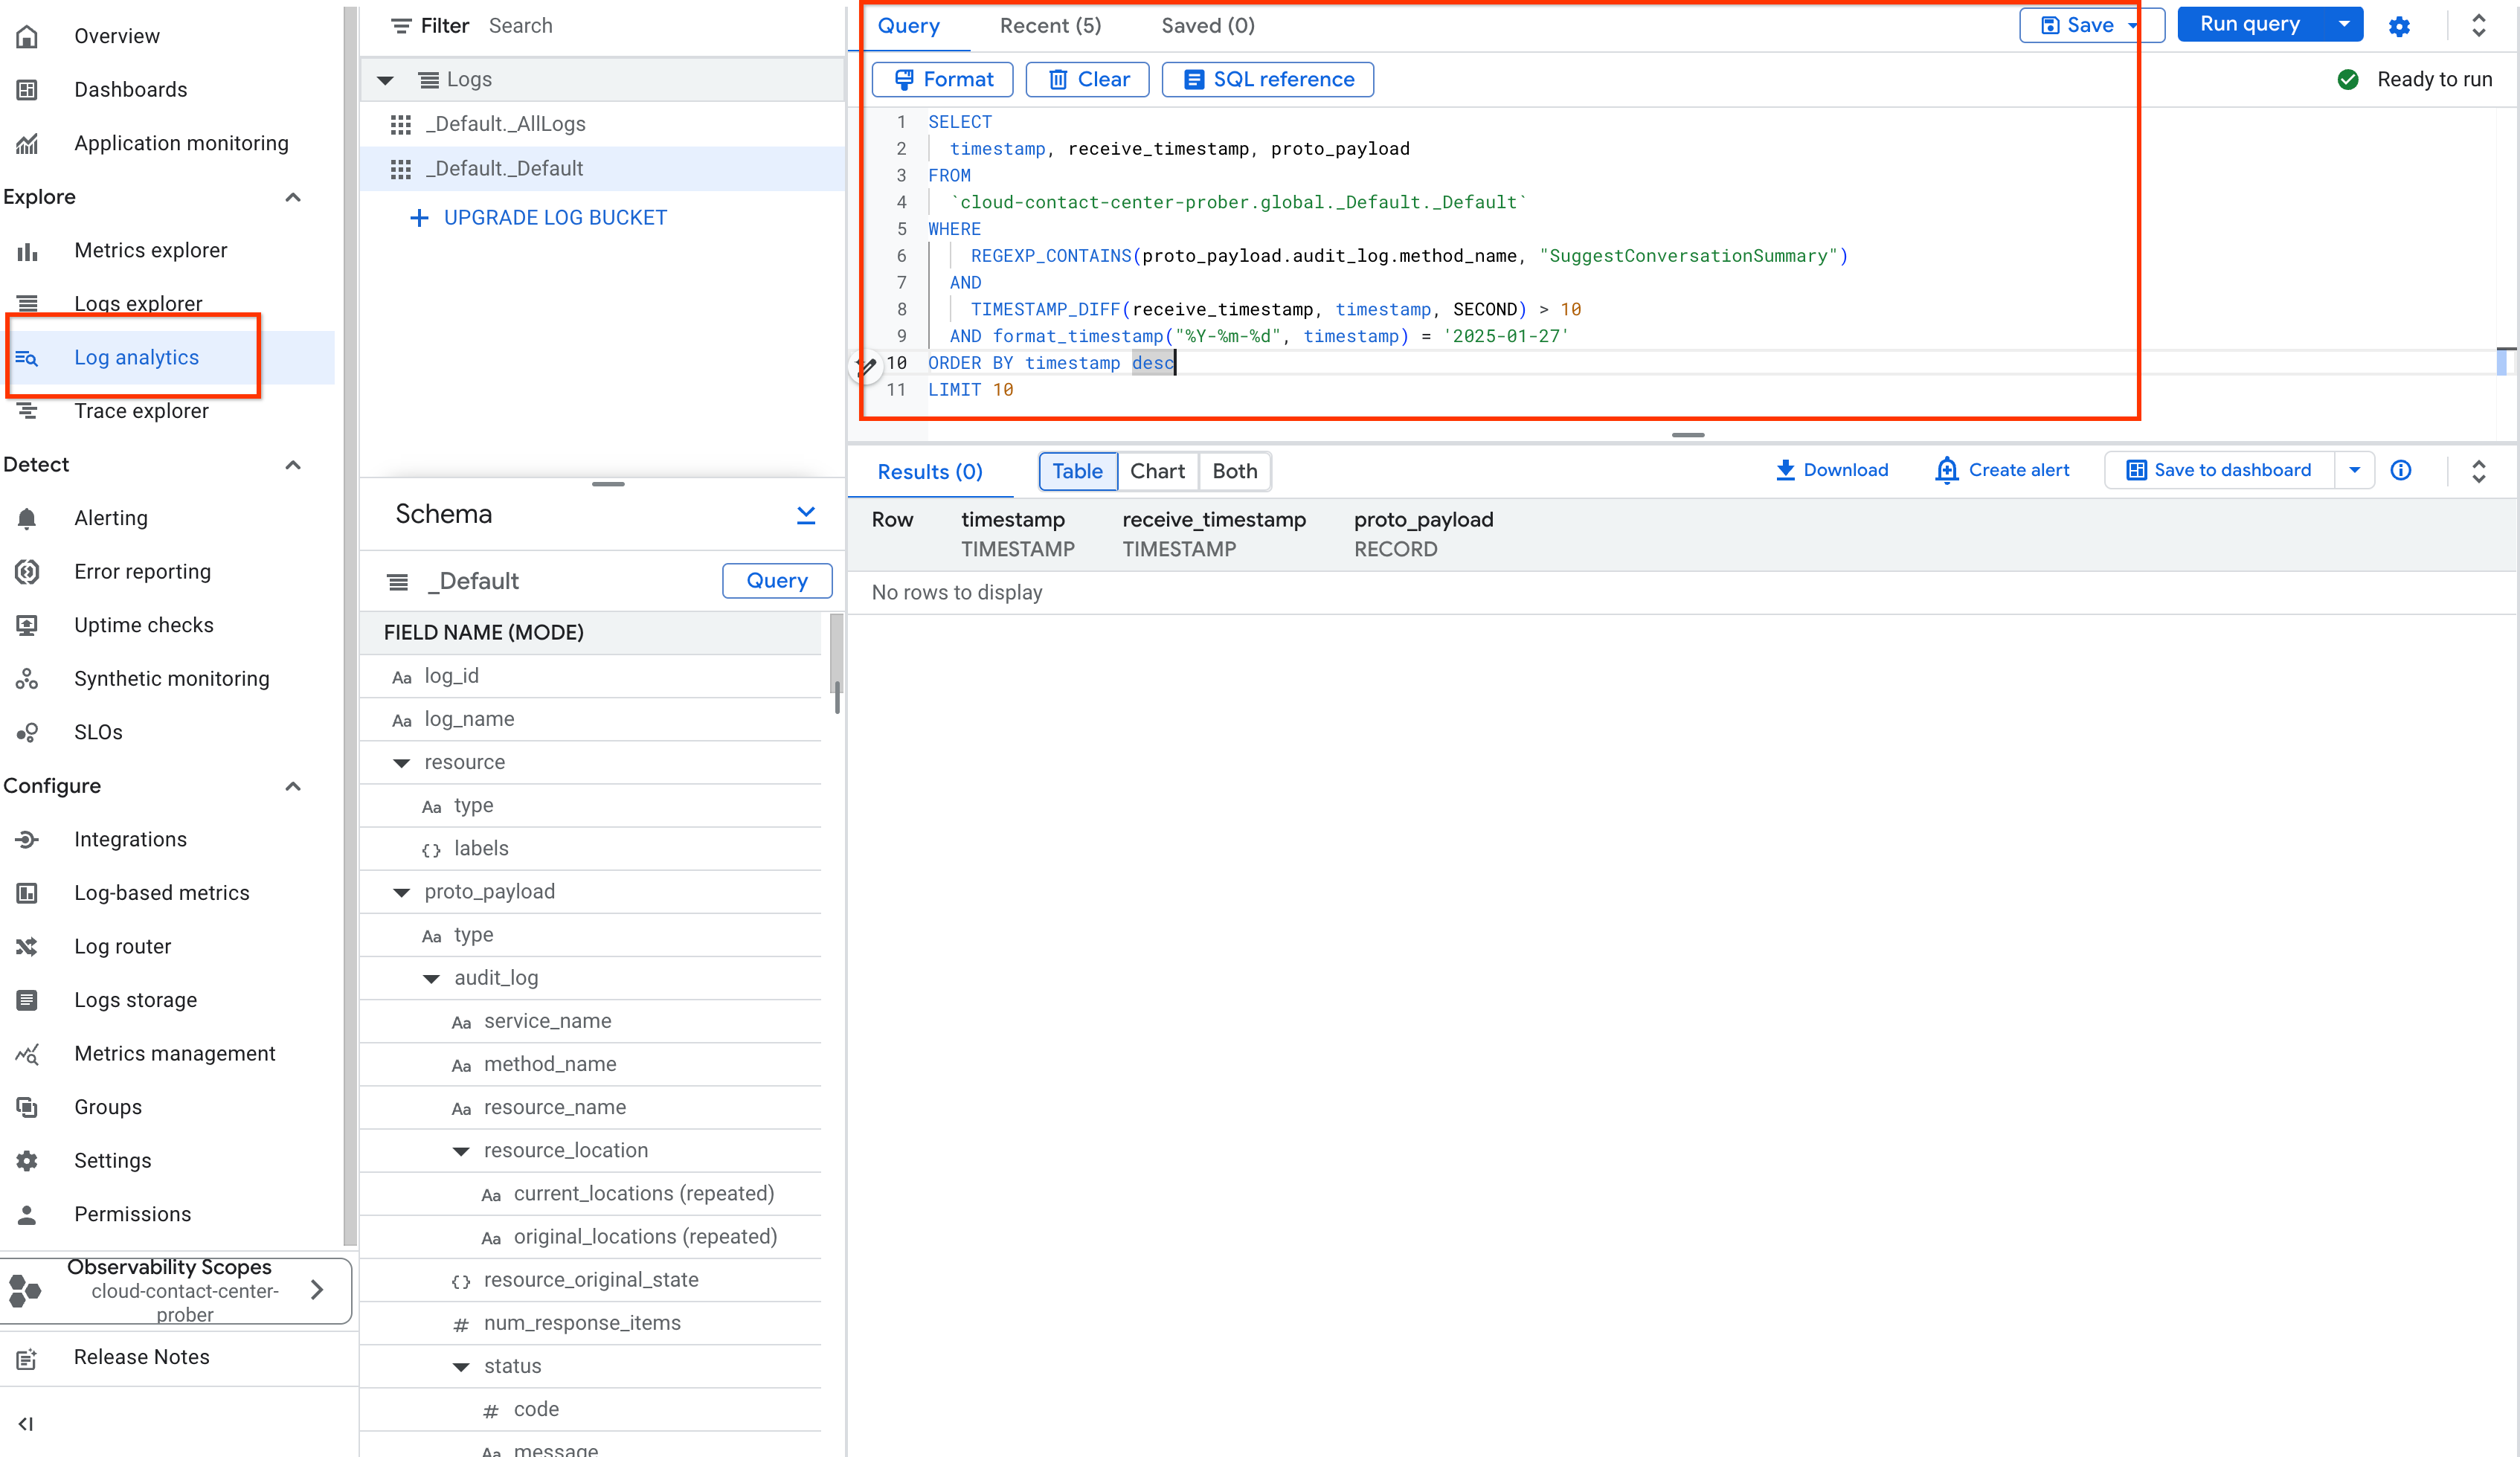
Als Nächstes identifizieren Sie die Konversations-IDs mit einer Latenz, die einen bestimmten Wert in Log analytics überschreitet. Im folgenden Screenshot sehen Sie beispielsweise Unterhaltungen, die an einem bestimmten Tag länger als 10 Sekunden gedauert haben.
Rufen Sie Log Analytics auf.
Geben Sie die Zeit für TIMESTAMP_DIFF an.
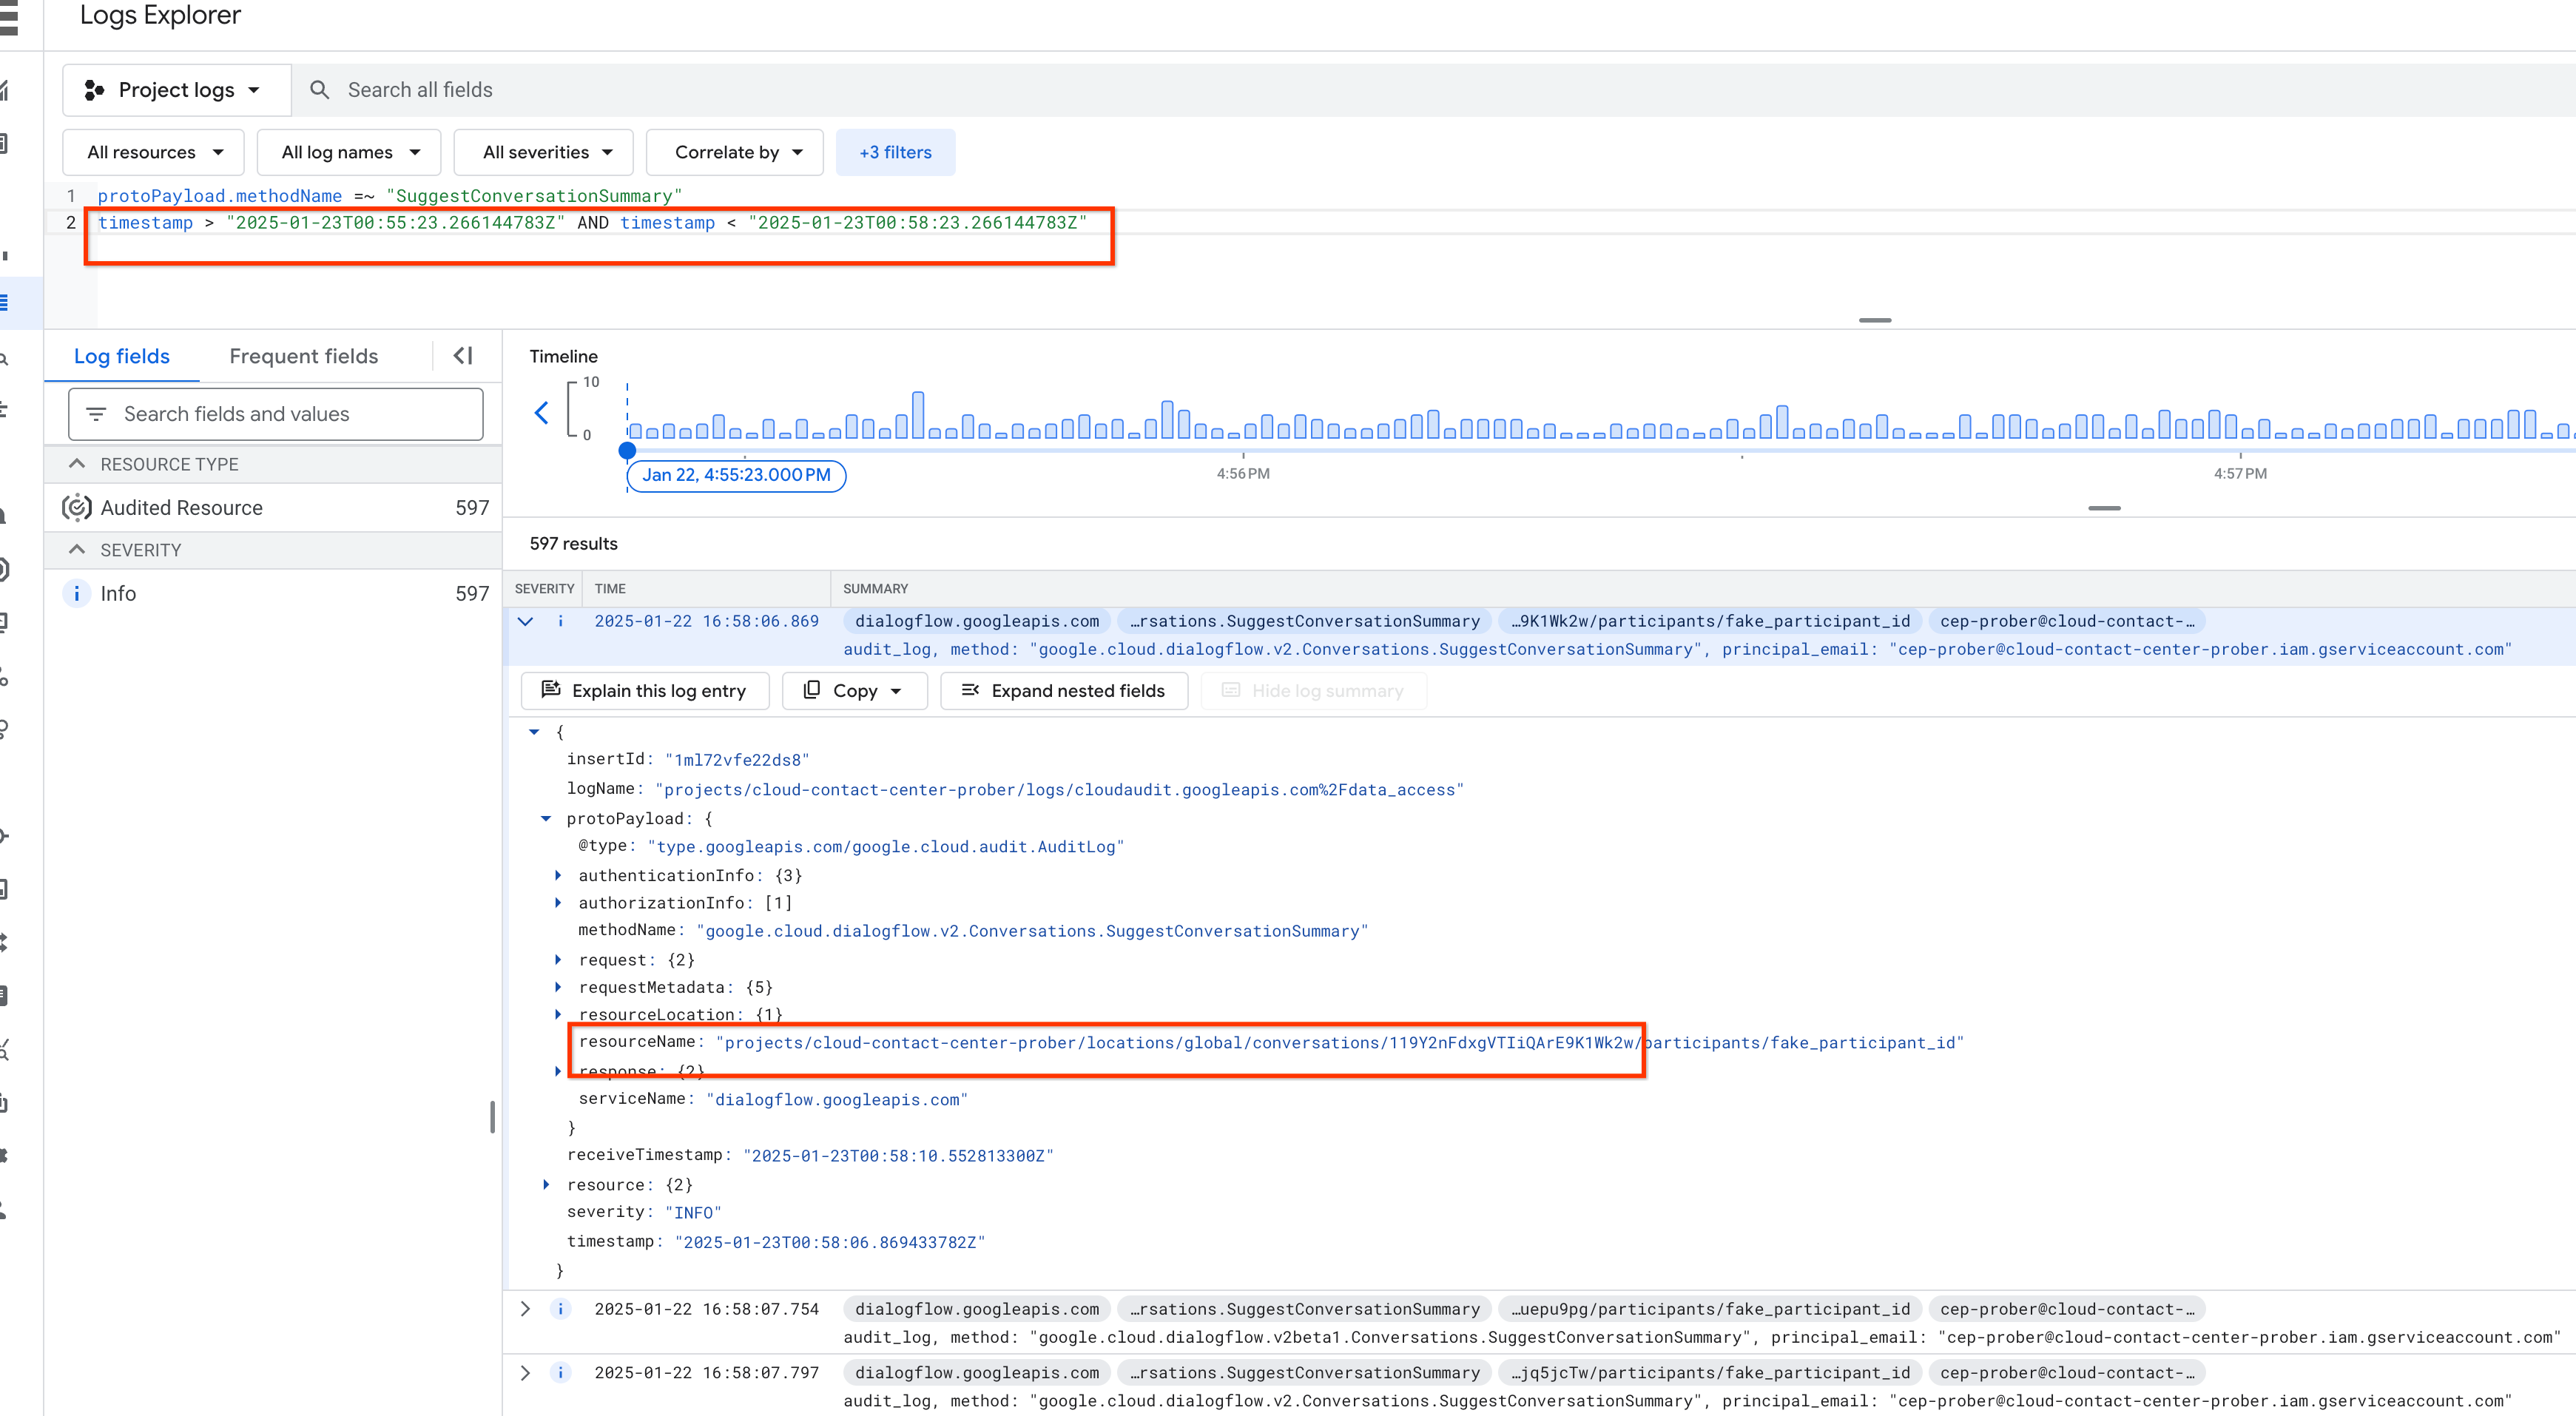
Alternativ können Sie den Zeitstempel verwenden, um bestimmte Unterhaltungen in einem bestimmten Zeitraum in Log explorer zu identifizieren.
Geben Sie den Namen der Methode in protoPayload.methodName ein.
Geben Sie den Zeitraum unter Zeitstempel ein.
Sehen Sie sich die Ergebnisse unter Logfelder an.
Sie können auf alle Agent Assist APIs zugreifen, wenn Cloud Logging aktiviert ist und Sie alle vorherigen Schritte ausgeführt haben.
[[["Leicht verständlich","easyToUnderstand","thumb-up"],["Mein Problem wurde gelöst","solvedMyProblem","thumb-up"],["Sonstiges","otherUp","thumb-up"]],[["Schwer verständlich","hardToUnderstand","thumb-down"],["Informationen oder Beispielcode falsch","incorrectInformationOrSampleCode","thumb-down"],["Benötigte Informationen/Beispiele nicht gefunden","missingTheInformationSamplesINeed","thumb-down"],["Problem mit der Übersetzung","translationIssue","thumb-down"],["Sonstiges","otherDown","thumb-down"]],["Zuletzt aktualisiert: 2025-09-04 (UTC)."],[[["\u003cp\u003eThis document outlines how to debug API and service usage and latency spikes within the Google Cloud console.\u003c/p\u003e\n"],["\u003cp\u003eYou can identify high-latency conversation IDs by using the "Traffic by API method" graph in the \u003cstrong\u003eMetrics\u003c/strong\u003e section of \u003cstrong\u003eEnabled APIs and Services\u003c/strong\u003e.\u003c/p\u003e\n"],["\u003cp\u003eEnabling \u003cstrong\u003eAdmin Read\u003c/strong\u003e, \u003cstrong\u003eData Read\u003c/strong\u003e, and \u003cstrong\u003eData Write\u003c/strong\u003e audit logs is necessary for debugging.\u003c/p\u003e\n"],["\u003cp\u003e\u003ccode\u003eLog analytics\u003c/code\u003e can be used to find conversations with latency exceeding a specific time, such as 10 seconds.\u003c/p\u003e\n"],["\u003cp\u003e\u003ccode\u003eLog explorer\u003c/code\u003e can be used with the method name and timestamp to identify specific conversations during a time period.\u003c/p\u003e\n"]]],[],null,["# Troubleshooting API and services latency spike\n\nThis document gives an overview of the debugging process to understand the usage of **APIs and Services** in the Google Cloud console and also their latency spike.\n\nFirst, follow these steps to identify conversation IDs with high latency:\n\n1. Open **[Google Cloud console](https://console.cloud.google.com)** and go to the **APIs \\& Services**.\n2. Click **Enabled APIs and Services**.\n3. Go to **Metrics** and select the **API method** under **Methods**.\n\nThe latency traffic graph appears, labeled **Traffic by API method**.\n\nNext, ensure that you enable audit logging.\n\n1. Go to **Audit Logs**.\n2. Check the options **Admin Read** , **Data Read** and **Data Write**.\n3. Click **Save**.\n\nNext, identify the conversation IDs with latency longer than a certain value in `Log analytics`. For example, in the following screenshot, you can see conversations longer than 10 seconds on a particular day.\n\n1. Go to **Log analytics**.\n2. Provide the time against **TIMESTAMP_DIFF**.\n\nAlternatively, use the timestamp to identify specific conversations during a certain period in `Log explorer`.\n\n1. Enter the name of the method in **protoPayload.methodName**.\n2. Enter the time range in **Timestamp**.\n3. View the results in **Log fields**.\n\nYou can access any Agent Assist APIs with Cloud Logging enabled by following all of the preceding steps."]]