Mantenha tudo organizado com as coleções
Salve e categorize o conteúdo com base nas suas preferências.
Neste documento, descrevemos como resolver problemas que podem ocorrer ao
usar o serviço de observabilidade para cargas de trabalho do SAP no Gerenciador de cargas de trabalho.
O ID do sistema SAP não está listado no painel de observabilidade
Depois de configurar o agente do Google Cloudpara SAP para observabilidade e
conceder as permissões necessárias às contas de serviço de todas as VMs que hospedam
os diferentes elementos de um sistema SAP (como serviços centrais,
servidores de aplicativos e bancos de dados SAP HANA), o ID do sistema aparece
no painel de observabilidade do SAP. Se o ID do sistema não estiver listado, verifique a configuração e os registros do agente, conforme explicado nas seções a seguir.
Verificar a configuração do agente
Verifique se todos os recursos necessários estão configurados corretamente para o
agente do SAPGoogle Cloud.
Para receber o status dos recursos da instância do agente, execute o seguinte comando:
Nos registros da instância de VM, confira problemas relacionados à incapacidade do agente para SAP de atualizar as informações do sistema SAP.
Para ver os registros, faça o seguinte:
Selecione uma VM para abrir a página Detalhes.
Clique na guia Observabilidade para exibir informações sobre a VM.
Selecione Todos os registros e classifique por "Erro" como a Gravidade.
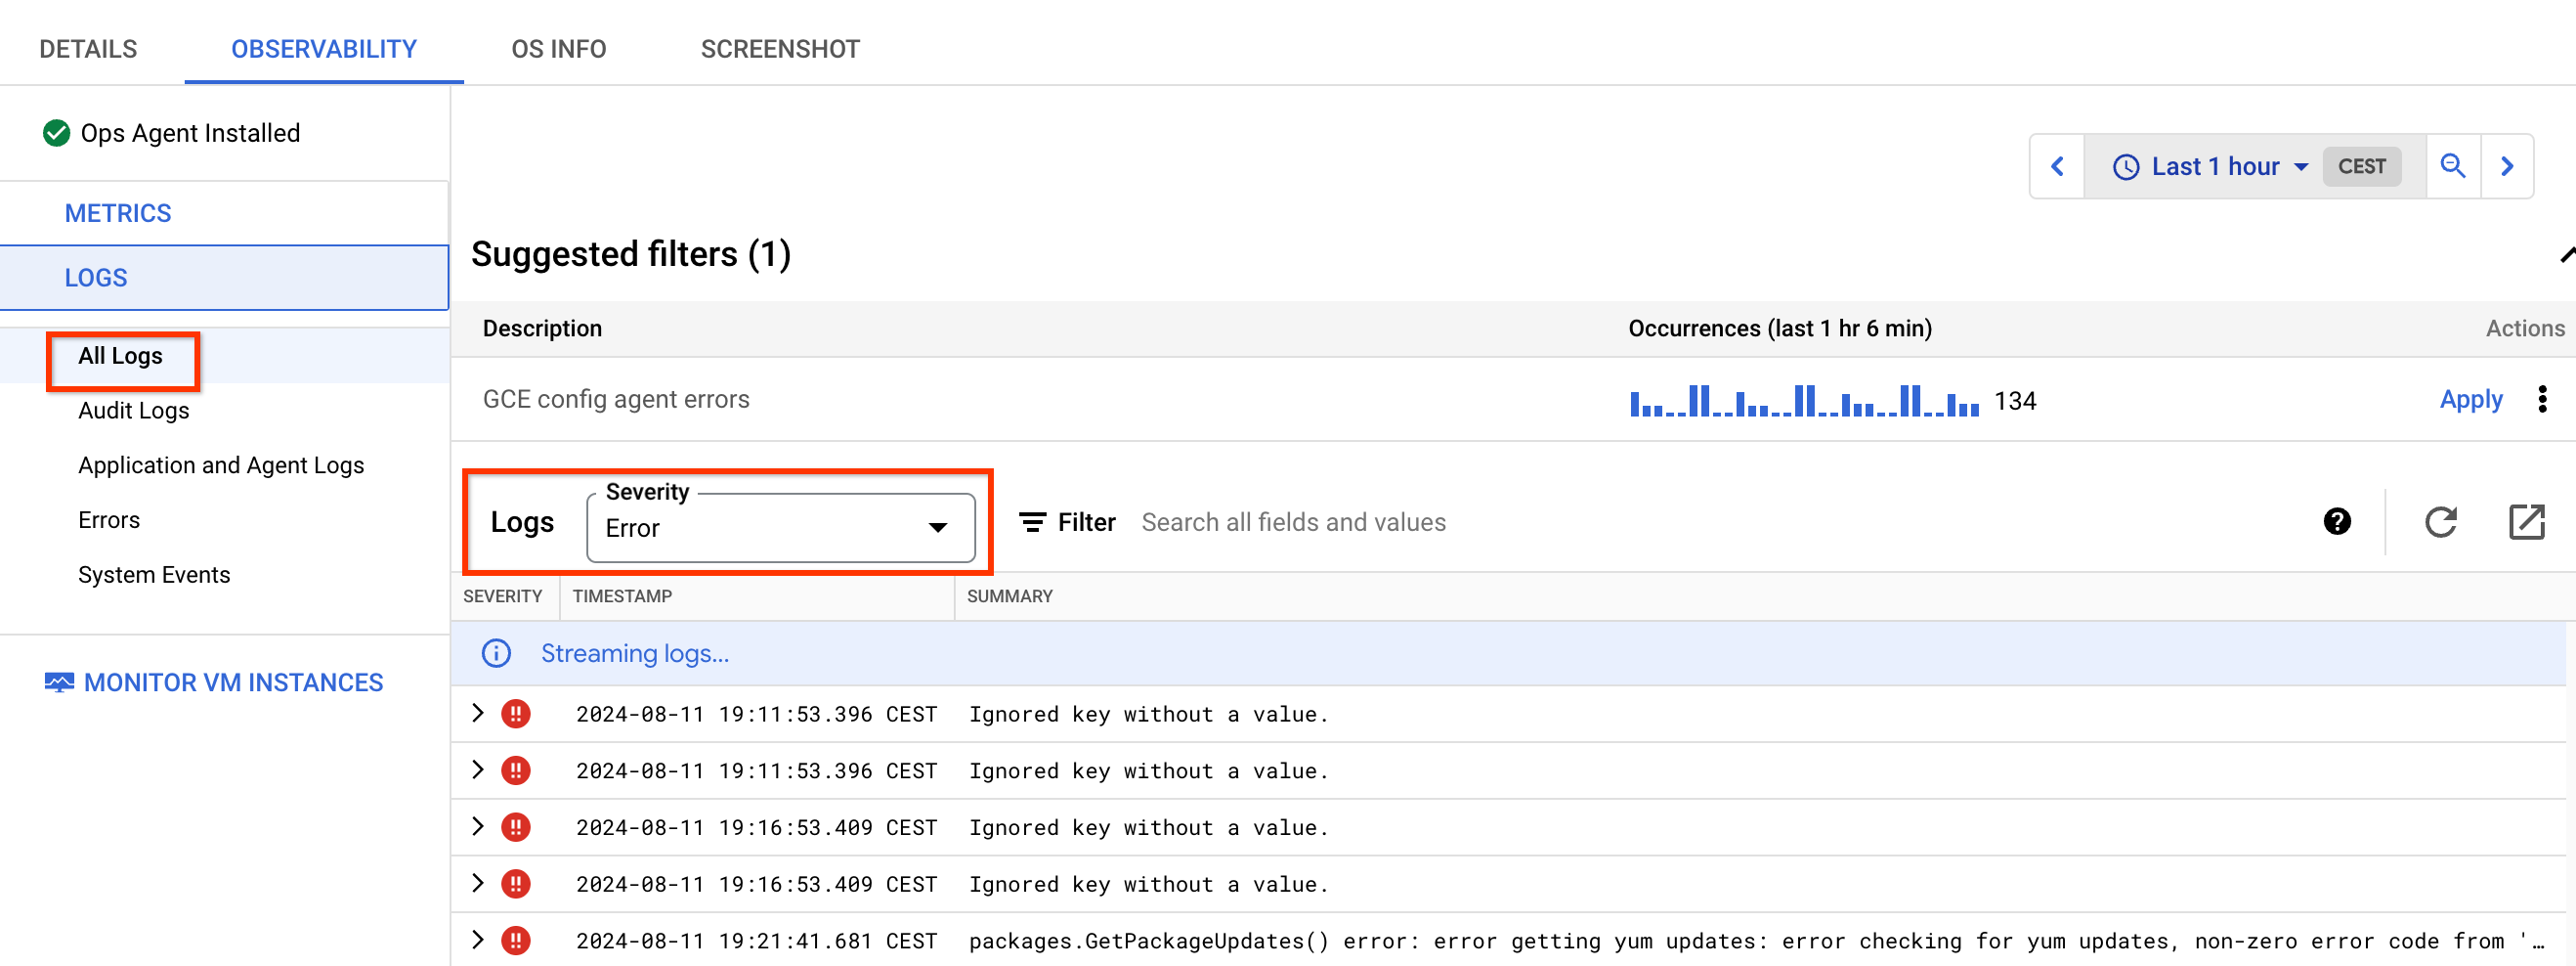
A maioria desses erros está relacionada à falta de permissões para a conta de serviço
anexada à VM. Para resolver esses erros, conceda as permissões necessárias
à conta de serviço.
Verificar registros usando o Cloud Logging
Verifique se o agente para SAP descobre suas cargas de trabalho SAP corretamente.
Para ver as entradas de registro da instância de VM que hospeda o agente, faça o seguinte:
No console Google Cloud , selecione Logging e, em seguida, Análise de registros:
No painel Consulta, selecione Mostrar consulta e insira o seguinte:
jsonPayload.@type:"SapDiscovery"
Se você não encontrar informações das VMs que hospedam o agente, isso significa que ele não está configurado ou funcionando corretamente. Para mais informações, consulte Configurar o agente para SAP.
Opcional: para ver os registros relacionados ao processo quando o agente para SAP
envia os dados de descoberta do SAP, use a seguinte consulta:
O status de integridade aparece como não especificado
Pode haver várias causas principais para o status de integridade Não especificado (cor cinza) do sistema SAP. Esse status é usado para identificar sistemas que não podem ser avaliados corretamente pelo Workload Manager devido à falta de métricas ou configurações.
As causas mais comuns desse status de integridade são:
O agente do Google Cloudpara SAP pode estar parado ou informando as métricas necessárias de maneira incorreta. Para mais informações, consulte Validar a instalação do agente.
Se o agente para SAP estiver funcionando e o status do sistema for Não especificado,
verifique se os recursos Monitoramento de processos e Monitoramento do SAP HANA estão ativados e configurados
corretamente no agente, dependendo dos processos do SAP em execução na VM.
Os Central Services e os Application Servers exigem que o monitoramento de processos esteja ativado, enquanto os bancos de dados SAP HANA exigem que o monitoramento de processos e do SAP HANA estejam ativados.
Os valores padrão para a frequência de coleta das métricas do monitoramento de processos com mudanças rápidas e lentas são 5 segundos e 30 segundos, respectivamente. Se esses valores forem aumentados acima dos padrões, o status de integridade poderá aparecer como Não especificado.
Na página "Visão geral do sistema", verifique se a arquitetura e o tipo de escalonamento foram identificados corretamente para seu sistema. Se um ou ambos os parâmetros estiverem incorretos, haverá um problema subjacente com o agente para SAP doGoogle Cloudou com os dados do SAP enviados para Google Cloud.
Para mais análises, entre em contato com o Cloud Customer Care. Consulte Como receber suporte para o agente do Google Cloudpara SAP.
As funções de cada VM relacionada ao sistema não são identificadas corretamente porque as métricas workload/sap/nw/instance/role ou workload/sap/hana/ha/availability não estão funcionando corretamente ou estão ausentes.
Verifique as funções do SAP identificadas na lista de VMs nos painéis "Aplicativos e bancos de dados".
Os seguintes papéis são necessários para cada um dos tipos de arquitetura:
Arquitetura centralizada: Central Services, Application Server e SAP HANA Primary.
Arquitetura distribuída: Central Services, servidor de aplicativos e SAP HANA Primary.
Distribuído com alta disponibilidade: Central Services, ERC, servidor de aplicativos, SAP HANA primário e SAP HANA secundário.
Todas as VMs na lista precisam ter uma função atribuída.
Verifique se as métricas necessárias têm um valor válido. Para isso, confira a métrica no Cloud Monitoring ou use o método da API timeSeries para receber o valor mais recente enviado pelo agente para SAP. Se a métrica não estiver presente no Cloud Monitoring ou não tiver um valor, o status de integridade será marcado como Não especificado porque não há dados suficientes para avaliar essa métrica.
Em arquiteturas distribuídas com alta disponibilidade, verifique se há uma ação com falha no cluster e faça uma limpeza executando os seguintes comandos:
RHEL
pcs resource cleanup RESOURCE_ID
SLES
crm resource cleanup RESOURCE_ID
Substitua RESOURCE_ID pelo ID do recurso com falha
no cluster.
Uma ação com falha no cluster pode afetar as métricas workload.googleapis.com/sap/cluster/nodes e workload.googleapis.com/sap/cluster/resources e informar valores incorretos.
Verifique se a versão do agente para SAP do Google Cloudestá atualizada e se você está executando a versão mais recente disponível. As versões mais recentes do
agente contêm correções para problemas e bugs relacionados a métricas de observabilidade.
Métricas incorretas podem resultar no status de integridade Não especificado do sistema.
Para bancos de dados SAP HANA replicados em um site secundário, verifique se há uma configuração de cluster válida entre o primário e o secundário.
[[["Fácil de entender","easyToUnderstand","thumb-up"],["Meu problema foi resolvido","solvedMyProblem","thumb-up"],["Outro","otherUp","thumb-up"]],[["Difícil de entender","hardToUnderstand","thumb-down"],["Informações incorretas ou exemplo de código","incorrectInformationOrSampleCode","thumb-down"],["Não contém as informações/amostras de que eu preciso","missingTheInformationSamplesINeed","thumb-down"],["Problema na tradução","translationIssue","thumb-down"],["Outro","otherDown","thumb-down"]],["Última atualização 2025-09-04 UTC."],[],[],null,["# Troubleshoot observability issues for SAP\n\n| **Preview**\n|\n|\n| This product or feature is subject to the \"Pre-GA Offerings Terms\" in the General Service Terms section\n| of the [Service Specific Terms](/terms/service-terms#1).\n|\n| Pre-GA products and features are available \"as is\" and might have limited support.\n|\n| For more information, see the\n| [launch stage descriptions](/products#product-launch-stages).\n\nThis document describes how to resolve issues that you might encounter while\nusing the observability service for SAP workloads in Workload Manager.\n\nSAP system ID is not listed on the observability dashboard\n----------------------------------------------------------\n\nAfter [configuring the Google Cloud's Agent for SAP](/workload-manager/docs/observe/sap/configure-agent) for observability and\ngranting the required permissions to service accounts for all VMs that host\nthe different elements of an SAP system (such as Central Services,\nApplication Servers, and SAP HANA databases), the system ID appears\non the SAP observability dashboard. If the system ID is not listed, check the\nagent configuration and logs as explained in the following sections.\n\n### Verify the agent configuration\n\nYou must ensure that all required features are correctly configured for the\nGoogle Cloud's Agent for SAP.\n\nTo get the status of the features of your agent instance, run the following command: \n\n sudo /usr/bin/google_cloud_sap_agent status\n\nThis command output summarizes the enabled and disabled features. It also\nindicates any missing IAM permissions or configuration issues.\nFor more information, see [Validate the setup for Workload Manager observability](/workload-manager/docs/observe/sap/configure-agent#validate-setup).\n\n### Check the VM instance logs\n\nIn the VM instance logs, view issues related to the Agent for SAP not being able to update the SAP system information.\nTo view logs, do the following:\n\n1. Select a VM to open the **Details** page.\n2. Click the **Observability** tab to display information about the VM.\n3. Select **All logs** and sort by Error as the **Severity**.\n\n Most of these errors are related to missing permissions for the service account\n attached to the VM. To resolve these errors, [grant the required permissions](/workload-manager/docs/observe/sap/prerequisites#service-account)\n to the service account.\n\n### Check logs using Cloud Logging\n\nYou must ensure that the Agent for SAP discovers your SAP workloads correctly.\nTo view log entries for the VM instance that hosts the agent, do the following:\n\n1. In the Google Cloud console, select **Logging** , and then select **Logs Explorer**:\n\n [Go to the Logs Explorer](https://console.cloud.google.com/logs)\n2. In the **Query** pane, select **Show query** and enter the following query:\n\n ```\n jsonPayload.@type:\"SapDiscovery\"\n ```\n\n If you cannot see any information from the VMs that host the agent, then the\n agent might not be configured or working properly. For more information,\n see [Configure Agent for SAP](/workload-manager/docs/observe/sap/configure-agent).\n3. Optional: To view logs related to the process when Agent for SAP\n uploads the SAP discovery data, use the following query:\n\n ```\n -jsonPayload.caller=~\"third_party/sapagent/internal/system/clouddiscovery/cloud_discovery.go\"\n -jsonPayload.caller=~\"third_party/sapagent/internal/system/sapdiscovery\"\n ```\n\nHealth status appears as unspecified\n------------------------------------\n\nThere might be multiple root causes for *Unspecified* (gray color) health status\nof the SAP system. This health status is used to identify systems that cannot\nbe correctly evaluated by Workload Manager due to missing metrics or settings.\nThe most common causes for this health status are as follows:\n\n- The Google Cloud's Agent for SAP might be stopped or incorrectly\n reporting the required metrics. For more information, see [Validate your installation of the agent](/sap/docs/agent-for-sap/latest/install-config-on-vm#validate-agent4sap-installation).\n\n- If Agent for SAP is up and running and the system status is *Unspecified* ,\n check that the [Process Monitoring](/sap/docs/agent-for-sap/latest/process-monitoring) and [SAP HANA Monitoring](/sap/docs/agent-for-sap/latest/monitoring-sap-hana) features are enabled and configured\n correctly in the agent depending on the SAP processes running on the VM.\n Central Services and Application Servers require Process Monitoring to be enabled\n while SAP HANA databases require Process Monitoring and SAP HANA Monitoring enabled.\n\n - The default values for the [collection frequency](/sap/docs/agent-for-sap/latest/process-monitoring#pm_metric_types) of the fast-changing and slow-changing Process Monitoring metrics are 5 seconds and 30 seconds respectively. If these values are increased above the default values, you might see the health status as *Unspecified*.\n- On the System overview page, check whether the **Architecture** and **Scale-Type**\n are correctly identified for your system. If any or both of these parameters\n are incorrect, then there is an underlying issue with either the\n Google Cloud's Agent for SAP or the uploaded SAP data to Google Cloud.\n For further analysis, contact Cloud Customer Care. See [Getting support\n for Google Cloud's Agent for SAP](/sap/docs/agent-for-sap/latest/troubleshooting#getting_support_for_agent).\n\n- The roles for each VM related to the system are not correctly identified due\n to the metrics `workload/sap/nw/instance/role`\n or `workload/sap/hana/ha/availability` not working correctly or missing.\n Check the identified SAP roles in the list of VMs on the Applications and Databases dashboards.\n\n | **Note:** On the observability dashboards, the *role* for a VM represents the SAP service hosted on that VM.\n\n The following roles are required for each of the architecture types:\n - Centralized Architecture: Central Services, Application Server, and SAP HANA Primary.\n - Distributed Architecture: Central Services, Application Server, and SAP HANA Primary.\n - Distributed with HA: Central Services, ERC, Application Server, SAP HANA Primary, and SAP HANA Secondary.\n\n All the VMs in the list should have a role assigned to them.\n- Verify that [the required metrics](/workload-manager/docs/observe/sap/view-dashboards#metrics) have a valid value by either checking\n the metric inside Cloud Monitoring or by using the [timeSeries](/monitoring/api/ref_v3/rest/v3/projects.timeSeries) API method\n to have the latest value pushed by the Agent for SAP. If the metric is not present in Cloud Monitoring or has no value,\n then the health status is marked as *Unspecified* because there is not enough data to evaluate such a metric.\n\n- On Distributed with HA architectures, check if there is a failed action\n in the cluster and perform a cleanup by running the following commands:\n\n ### RHEL\n\n ```sh\n pcs resource cleanup RESOURCE_ID\n ```\n\n ### SLES\n\n\n ```sh\n crm resource cleanup RESOURCE_ID\n ```\n\n \u003cbr /\u003e\n\n Replace \u003cvar translate=\"no\"\u003eRESOURCE_ID\u003c/var\u003e with the ID of the failed resource\n in the cluster.\n\n Failed action in the cluster might impact the metrics `workload.googleapis.com/sap/cluster/nodes`\n and `workload.googleapis.com/sap/cluster/resources` and it reports incorrect values.\n- Check whether the Google Cloud's Agent for SAP version is up to date and that\n you are running the latest version available. Newer versions of the\n agent contains fixes for issues and bugs related to observability metrics.\n Incorrect metrics might result in the *Unspecified* health status of the system.\n\n- For SAP HANA databases replicating to a secondary site, check if there is a valid cluster configuration between primary and secondary."]]