本文档介绍如何在 Cloud Tools for Visual Studio 的 Error Reporting 标签页中访问和查看 Google Cloud Observability 错误报告。
准备工作
配置应用以在 Cloud Logging 中记录异常。
访问 Error Reporting 标签页
要在 Visual Studio 中访问此标签页并查看错误报告,请依次选择工具 - > Google Cloud Tools - > 显示 Stackdriver Error Reporting。
有关错误报告的信息
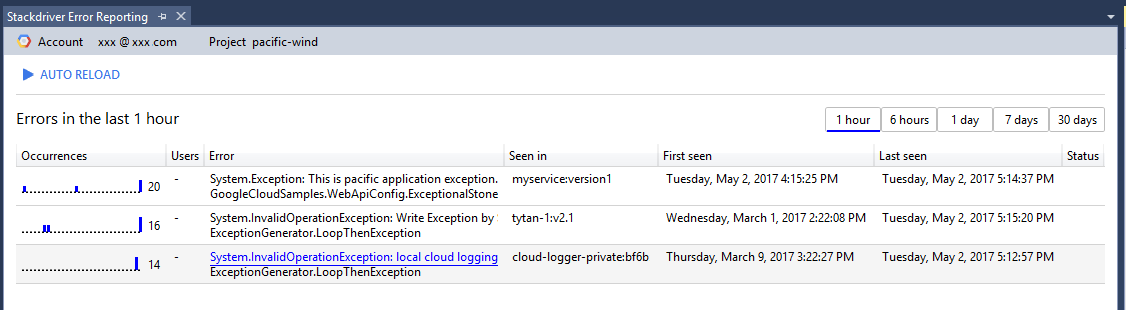
报告会显示以下内容:
| 列 | 说明 |
|---|---|
| 出现次数 | 在所选时间范围内发生该错误的次数。 |
| 用户 | 在所选时间范围内受该错误影响的用户数。 |
| 错误 | 提供从堆栈轨迹中提取的错误信息,包括错误消息及其代码位置。 |
| 错误出处 | 列出发生错误的服务和版本。 |
| 首次出现时间 | 该错误首次出现的时间。对此列进行排序可帮助发现最近开始发生的错误。 |
| 上次出现时间 | 上次发生该错误的时间。对此列进行排序可帮助查看仍在发生的错误。您也可以通过反向排序查看哪些错误已停止。 |
| 状态 | 随该错误一起返回的 HTTP 状态代码(如果有)。 |
Error Reporting 会分析堆栈轨迹以移除重复错误,并根据应用的编程语言所使用的通用框架对错误进行分组。
您可以选择时间范围按钮来仅显示在指定时间范围内发生的错误。例如,点击 1 小时可显示过去一小时内发生的错误。
您可以点击自动重新加载,让系统每 10 秒刷新一次列表。
查看错误的详细信息
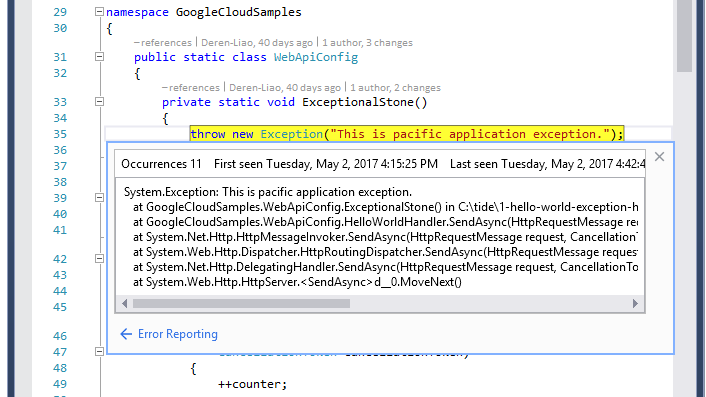
要查看有关特定错误的详细信息,请在错误列表中点击相应的行。随即会显示错误的详细信息视图标签页。

您可以检查所选错误的历史记录,并访问一系列相关错误样本所对应的诊断信息。C# 应用会生成这些样本,其中包含已解析的堆栈轨迹。
Error Reporting 会将类似错误汇总在一起,因此它只保留 1000 个错误样本,然后进行推算。对于每个样本,界面都会显示向 Error Reporting 提供的数据。
查看错误的源代码
C# 应用和调试版本中的错误包含堆栈帧处的源代码位置信息。要浏览源代码,请点击来源链接。在此之前,您必须在当前的 Visual Studio 解决方案中加载包含该文件的项目。