Introduction
Forecasting and anomaly detection over billions of time series is computationally intensive. Most existing systems run forecasting and anomaly detection as batch jobs (for example, risk pipelines, traffic forecasting, demand planning, and so on). This severely limits the type of analysis that you can perform online, such as deciding whether to alert based on a sudden increase or decrease across a set of event dimensions.
The main goals of the Timeseries Insights API are:
- Scale to billions of time series that are dynamically constructed from raw events and their properties, based on query parameters.
- Provide real-time forecasting and anomaly detection results. That is, within a few seconds, detect trends and seasonality across all time series and decide whether any slices are spiking or decreasing unexpectedly.
API functionality
- Manage datasets
- Index and load a dataset consisting of multiple data sources stored on Cloud Storage. Allow appending new events in a streaming fashion.
- Unload a no longer needed dataset.
- Ask for the processing status of a dataset.
- Query datasets
- Retrieve the time series that matches the given property values. The time series is forecast up to a specified time horizon. The time series is also evaluated for anomalies.
- Automatically detect combinations of property values for anomalies.
- Update datasets
- Ingest new events recently occurred and incorporate them into the index in nearly real-time (seconds to minutes delay).
Disaster recovery
The Timeseries Insights API does not serve as a backup for Cloud Storage or return raw streaming updates. Clients are responsible to store and backup data separately.
After a regional outage, the service performs a best effort recovery. Metadata (information about dataset and operational status) and streamed user data updated within 24 hours of the start of the outage might not be recovered.
During recovery, queries and streaming updates to datasets might not be available.
Input data
It is common that numerical and categorical data is collected over time. For example, the following figure shows the CPU usage, memory usage, and status of a single running job in a data center for every minute over a period of time. The CPU usage and memory usage are numerical values, and the status is a categorical value.
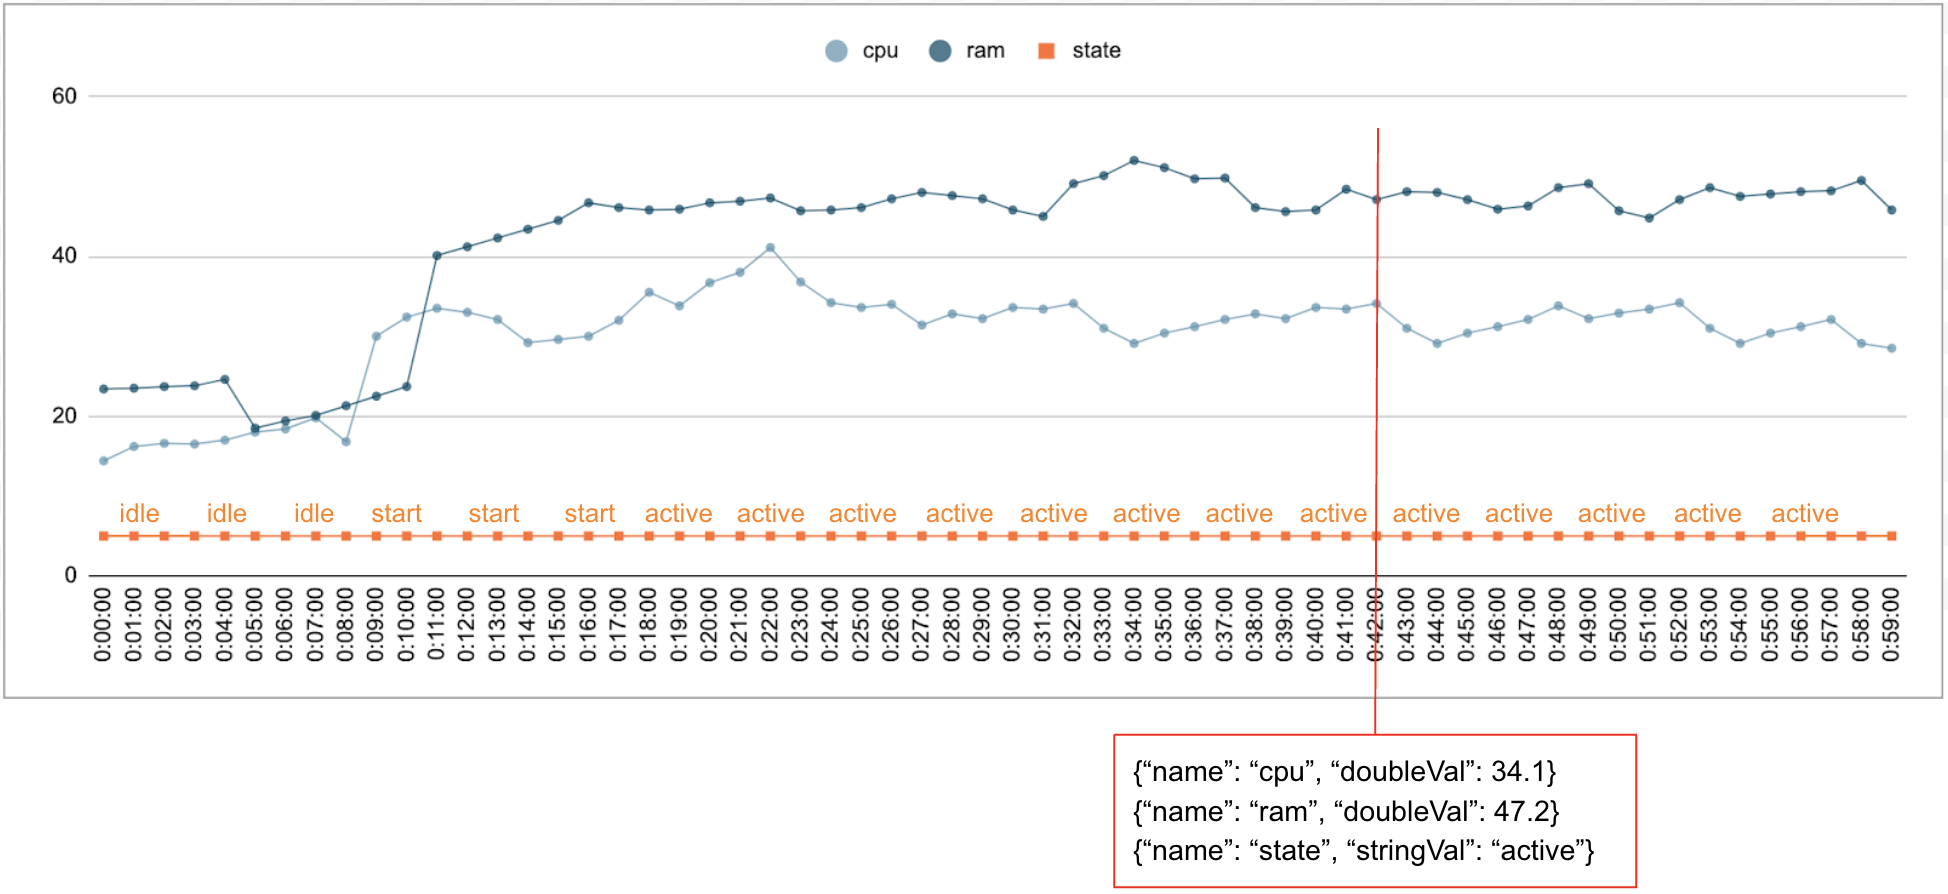
Event
The Timeseries Insights API uses events as the basic data entry. Each event has a timestamp and a collection of dimensions, that is, key value pairs where the key is the dimension name. This simple representation allows us to handle data in the scale of trillions. For example, the data center, user, job names, and task numbers are included to fully represent a single event. The above figure shows a series of events recorded for a single job illustrating a subset of dimensions.
{"name":"user","stringVal":"user_64194"},
{"name":"job","stringVal":"job_45835"},
{"name":"data_center","stringVal":"data_center_30389"},
{"name":"task_num","longVal":19},
{"name":"cpu","doubleVal":3840787.5207877564},
{"name":"ram","doubleVal":1067.01},
{"name":"state","stringVal":"idle"}
DataSet
A DataSet is a collection of events. Queries are performed within the same dataset. Each project can have multiple datasets.
A dataset is built from batch and streaming data. Batch data build reads from multiple Cloud Storage URIs as data sources. After batch build completes, the dataset can be updated with streaming data. Using batch build for historical data, the system can avoid cold-start problems.
A dataset needs to be built or indexed before it can be queried or updated. Indexing starts when the dataset is created, and typically takes minutes to hours to complete, depending on the amount of data. More specifically, the data sources are scanned once during the initial indexing. If the contents of the Cloud Storage URIs change after initial indexing completes, they are not scanned again. Use streaming updates for additional data. Streaming updates get indexed continuously in near real time.
Timeseries and anomaly detection
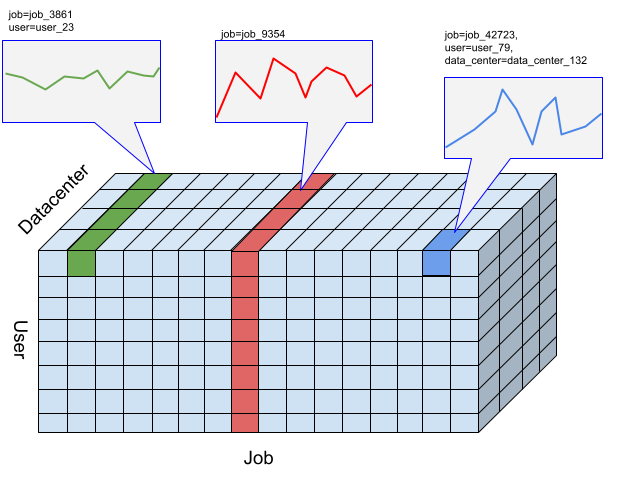
For the Timeseries Insights API, a slice is a collection of events with a certain combination of dimension values. We are interested in a measure of events falling into these slices over time.
For a given slice, the events are aggregated into numerical values per user-specified resolution of time intervals, which are the time series to detect anomalies. The preceding figure illustrates different choices of slices resulted from different combinations of "user", "job", and "data_center" dimensions.
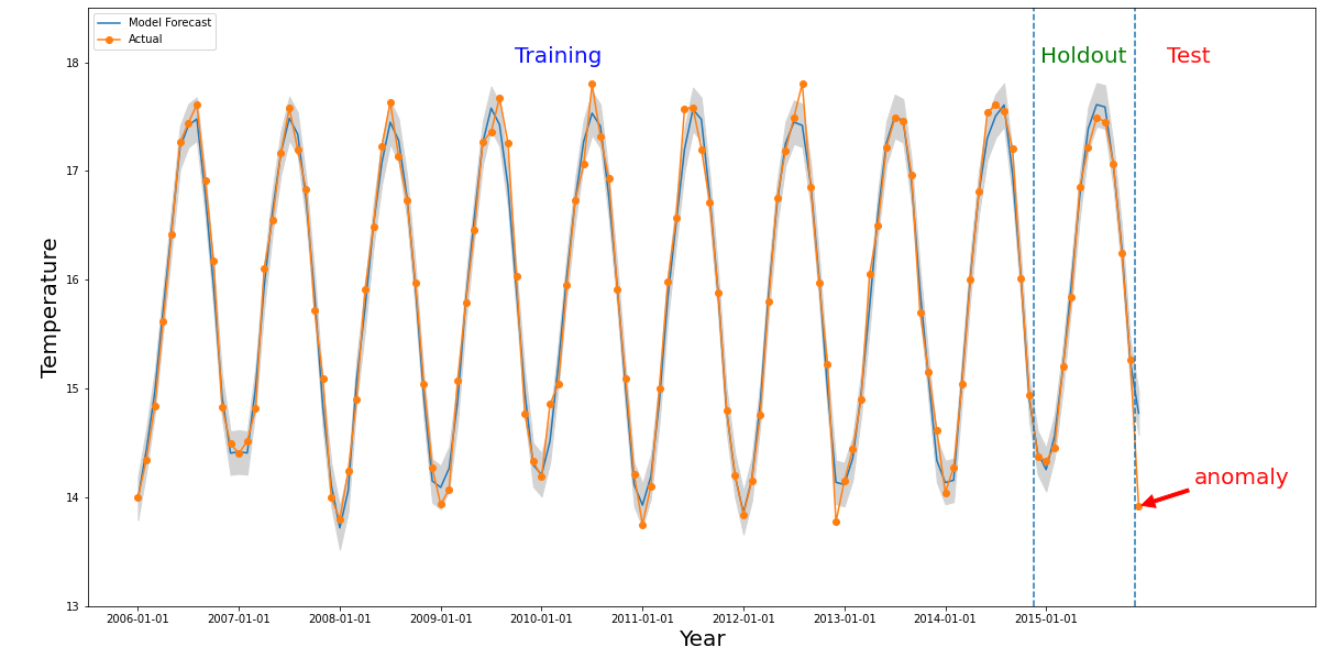
An anomaly happens for a certain slice if the numerical value from the time
interval of interest is significantly different from the values in the past. The
above figure illustrates a time series based on temperatures measured across the
world over 10 years. Suppose we are interested in whether the last month of
2015 is an anomaly. A query to the system specifies the time of interest,
detectionTime, to be "2015/12/01" and the granularity to be "1 month". The
retrieved time series before the detectionTime is partitioned into an earlier
training period followed by a holdout period. The system uses data from
the training period to train a model, and uses the holdout period to verify that
the model can reliably predict the next values. For this example, the holdout
period is 1 year. The picture shows the actual data and predicted values from
the model with upper and lower bounds. The temperature for 2015/12 is marked
anomaly because the actual value is outside the predicted bounds.