このドキュメントでは、Agent Development Kit(ADK)フレームワークで構築された AI エージェントを計測する方法について説明します。この計測は、OpenTelemetry を活用したもので、ユーザー プロンプト、エージェントの回答、エージェントの選択を収集できます。
ADK フレームワーク自体も OpenTelemetry で計測され、エージェントの実行の主要なステップからテレメトリーがキャプチャされます。これにより、アプリケーションの貴重なオブザーバビリティをすぐに利用できます。ただし、このオブザーバビリティは、アプリケーションのユースケースには十分でない可能性があります。OpenTelemetry を使用してアプリの他の部分からテレメトリーをキャプチャしたり、独自のカスタム計測を使用してアプリケーション固有のデータをキャプチャしたりして、他の計測ライブラリを追加することで、よりきめ細かいオブザーバビリティを実現できます。
たとえば、アプリケーションで次のような計測コードを記述できます。
- エージェントが起動したツールのリソース消費量を追跡する。
- アプリケーション固有の検証の失敗、ビジネスルールの違反、カスタムエラー回復メカニズムを追跡する。
- ドメイン固有の基準に基づいて、エージェントの回答の品質スコアを追跡する。
生成 AI アプリケーションを計測してテレメトリーを収集する
AI エージェントを計測してログ、指標、トレースデータを収集する手順は次のとおりです。
- OpenTelemetry パッケージをインストールする
- テレメトリーを収集して送信するように OpenTelemetry を構成する
- 構成した OpenTelemetry を挿入するカスタム エントリ ポイントを作成する
このセクションの残りの部分では、上記の手順について説明します。
OpenTelemetry パッケージをインストールする
次の OpenTelemetry 計測パッケージとエクスポータ パッケージを追加します。
pip install 'opentelemetry-instrumentation-google-genai' \
  'opentelemetry-instrumentation-sqlite3' \
  'opentelemetry-exporter-gcp-logging' \
  'opentelemetry-exporter-gcp-monitoring' \
  'opentelemetry-exporter-otlp-proto-grpc' \
  'opentelemetry-instrumentation-vertexai>=2.0b0'
ログデータと指標データは、Cloud Logging API または Cloud Monitoring API を使用して Google Cloud プロジェクトに送信されます。opentelemetry-exporter-gcp-logging ライブラリと opentelemetry-exporter-gcp-monitoring ライブラリは、これらの API のエンドポイントを呼び出します。
トレースデータは、OTLP 形式をサポートする Telemetry(OTLP)API を使用して Google Cloud に送信されます。このエンドポイントを介して受信されたデータも OTLP 形式で保存されます。opentelemetry-exporter-otlp-proto-grpc ライブラリは、Telemetry(OTLP)API エンドポイントを呼び出します。
テレメトリーを収集して送信するように OpenTelemetry を構成する
ADK エージェントの初期化コードで、テレメトリーをキャプチャして Google Cloud プロジェクトに送信するように OpenTelemetry を構成するコードを追加します。
サンプル全体を表示するには、[more_vert その他] をクリックして、[GitHub で表示] を選択します。
構成した OpenTelemetry を使用するカスタム エントリ ポイントを作成する
計測に OpenTelemetry を使用するには、ADK アプリケーションのカスタム エントリ ポイントを作成します。カスタム エントリ ポイントは、ADK エージェントを起動する前に OpenTelemetry を構成する必要があります。
サンプル アプリケーションでは、main メソッドは、OpenTelemetry を初期化してから、エージェントとやり取りできる FastAPI サーバーを起動するカスタム エントリ ポイントとして機能します。
サンプル全体を表示するには、[more_vert その他] をクリックして、[GitHub で表示] を選択します。
サンプル アプリケーションをダウンロードして実行する
このサンプルコードは、ADK を使用して構築された生成 AI エージェントを実装します。エージェントは OpenTelemetry で計測され、指標、トレース、ログを Google Cloud プロジェクトに送信するように構成されています。プロジェクトに送信されるテレメトリーには、生成 AI のプロンプトと回答が含まれます。
ADK エージェントのペルソナ
生成 AI エージェントは、エフェメラル SQLite データベースへの完全アクセス権を持つ SQL エキスパートとして定義されます。エージェントは Agent Development Kit で構築され、SQLDatabaseToolkit を使用してデータベースにアクセスします。データベースは最初は空です。
始める前に
-
In the Google Cloud console, activate Cloud Shell.
At the bottom of the Google Cloud console, a Cloud Shell session starts and displays a command-line prompt. Cloud Shell is a shell environment with the Google Cloud CLI already installed and with values already set for your current project. It can take a few seconds for the session to initialize.
-
Enable the Vertex AI, Telemetry, Cloud Logging, Cloud Monitoring, and Cloud Trace APIs:
gcloud services enable aiplatform.googleapis.com
telemetry.googleapis.com logging.googleapis.com monitoring.googleapis.com cloudtrace.googleapis.com -
サンプル アプリケーションがログ、指標、トレースデータを書き込むために必要な権限を取得するには、プロジェクトに対する次の IAM ロールを付与するよう管理者に依頼してください。
-
Cloud テレメトリー トレース書き込み(
roles/telemetry.tracesWriter) -
ログ書き込み(
roles/logging.logWriter) -
モニタリング指標の書き込み(
roles/monitoring.metricWriter) -
Vertex AI ユーザー(
roles/aiplatform.user)
-
Cloud テレメトリー トレース書き込み(
アプリケーションを起動する
サンプルアプリケーションを起動する手順は次のとおりです。
-
In the Google Cloud console, activate Cloud Shell.
At the bottom of the Google Cloud console, a Cloud Shell session starts and displays a command-line prompt. Cloud Shell is a shell environment with the Google Cloud CLI already installed and with values already set for your current project. It can take a few seconds for the session to initialize.
リポジトリのクローンを作成します。
git clone https://github.com/GoogleCloudPlatform/opentelemetry-operations-python.gitサンプル ディレクトリに移動します。
cd opentelemetry-operations-python/samples/adk-sql-agent仮想環境を作成してサンプルを実行します。
python -m venv venv/
source venv/bin/activate
pip install -r requirements.txt
env $(cat opentelemetry.env | xargs) python main.py
アプリケーションにより、次のようなメッセージが表示されます。
Appplication startup complete
Uvicorn running on http://0.0.0.0:8080
エージェントとやり取りするには、ブラウザを開き、前の手順に記載されたアドレスに移動します。
[Select an agent] を開き、エージェントのリストから
sql_agentを選択します。
エージェントとやり取りする
エージェントに質問したり、指示を出したりして、エージェントとやり取りします。たとえば、次のような質問をします。
What can you do for me ?
同様に、sql_agent のペルソナは SQL エキスパートであるため、アプリケーションのテーブルを作成し、作成したテーブルを操作するクエリを記述するように依頼することもできます。エージェントは、アプリケーションを実行しているマシンで作成された .db ファイルを使用するエフェメラル データベースのみを作成できます。
sql_agent とユーザーのやり取りの例を以下に示します。
Create a table for me to store weather data and also insert sample data in
the table. At the end show all data in the table you created.
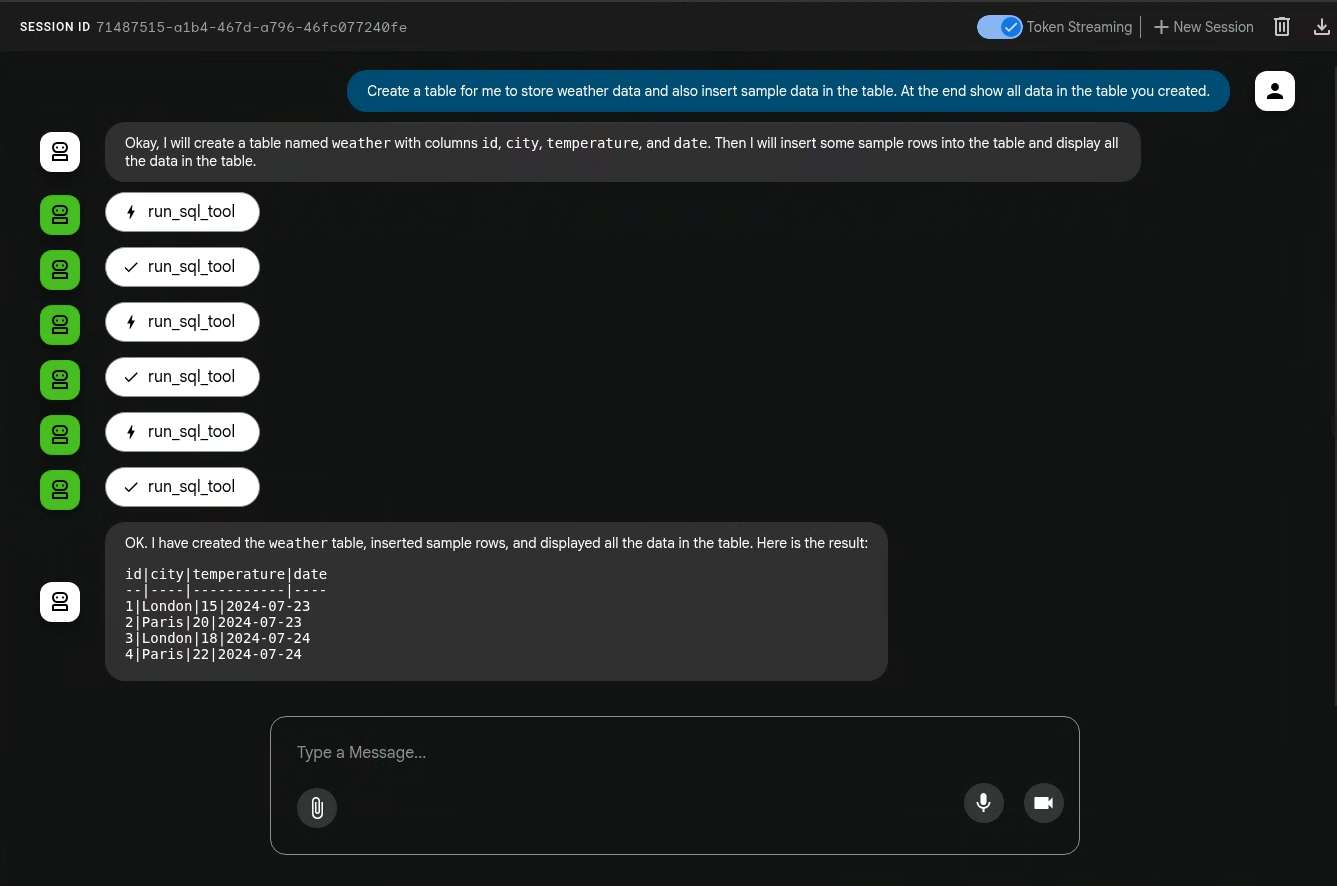
生成 AI エージェントによって実行されるアクションは決定的ではないため、同じプロンプトでも回答が異なる場合があります。
アプリケーションを終了する
アプリケーションを終了するには、アプリケーションの起動に使用したシェルで Ctrl-C キーを押します。
トレース、指標、ログを表示する
このセクションでは、生成 AI イベントを表示する方法について説明します。
始める前に
ログ、指標、トレースデータを表示するために必要な権限を取得するには、プロジェクトに対する次の IAM ロールを付与するよう管理者に依頼してください。
-
ログ閲覧者(
roles/logging.viewer) -
モニタリング閲覧者(
roles/monitoring.viewer) -
Cloud トレース ユーザー(
roles/cloudtrace.user)
ロールの付与については、プロジェクト、フォルダ、組織に対するアクセス権の管理をご覧ください。
必要な権限は、カスタムロールや他の事前定義ロールから取得することもできます。
テレメトリーを表示する
アプリケーションによって作成された生成 AI イベントを表示するには、[Trace エクスプローラ] ページを使用します。
-
Google Cloud コンソールで、[Trace エクスプローラ] ページに移動します。
このページは、検索バーを使用して見つけることもできます。
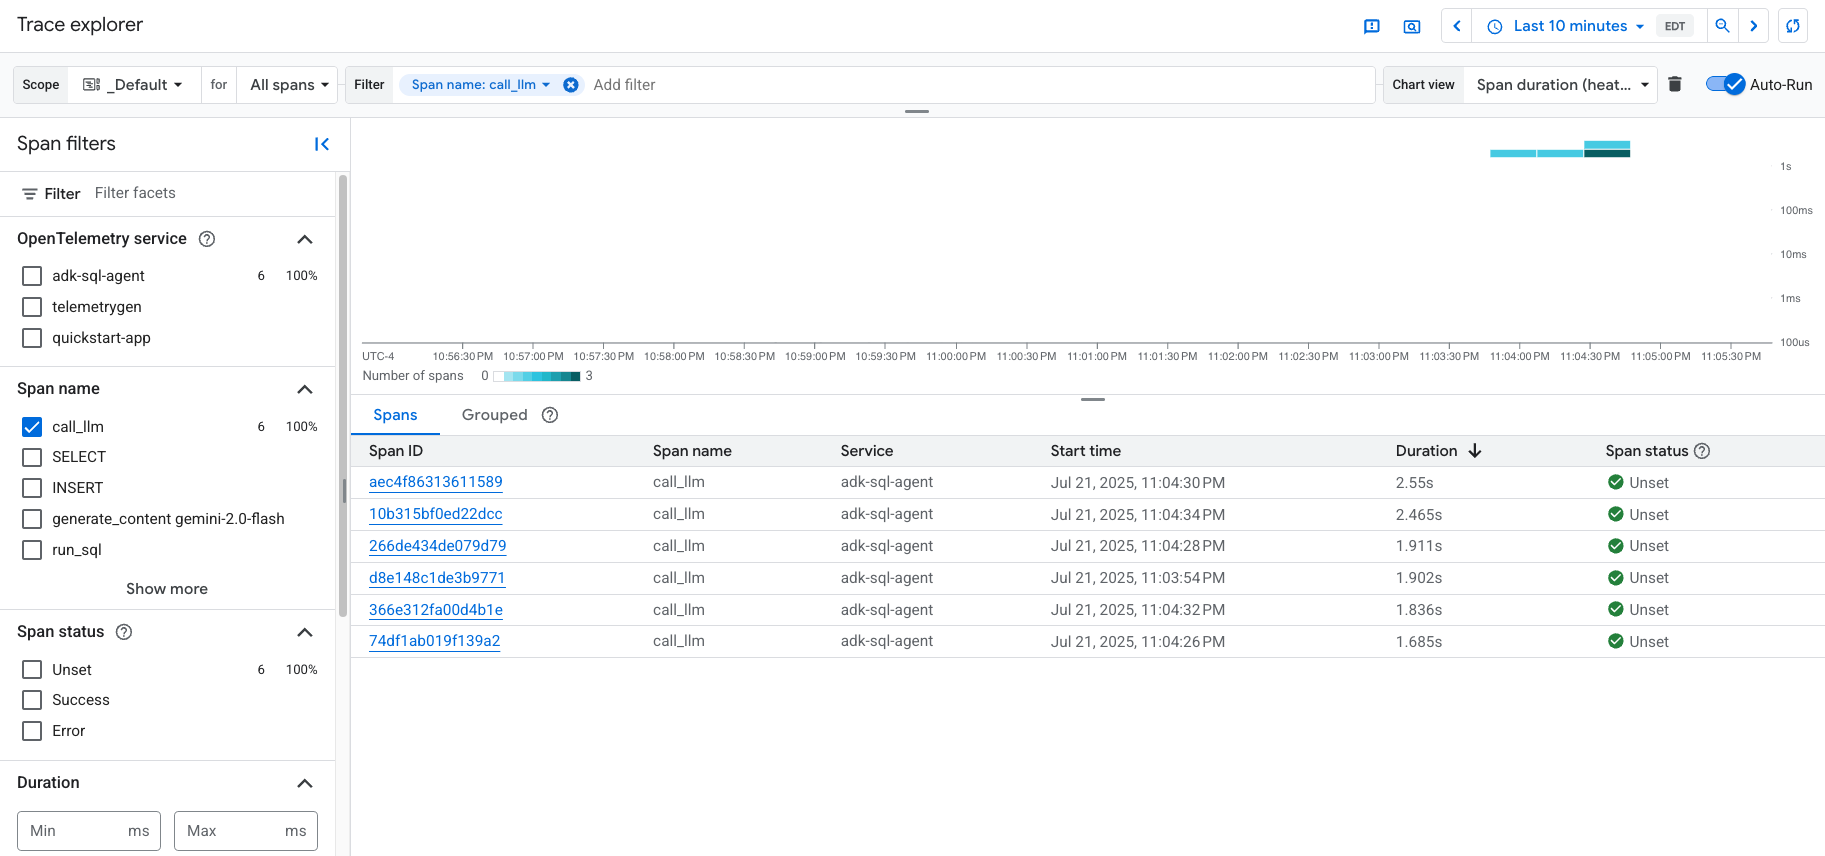
ツールバーで [フィルタを追加]、[スパン名]、[
call_llm] の順に選択します。データのフィルタリング後の [Trace エクスプローラ] ページを以下に示します。
Cloud Trace を初めて使用する場合は、Google Cloud Observability によって、トレースデータを保存するデータベースが作成される必要があります。データベースの作成には数分かかることがあり、その間トレースデータを表示することはできません。
スパンデータとログデータを調べるには、[スパン] テーブルでスパンを選択します。
[詳細] ページが開きます。このページには、関連するトレースとそのスパンが表示されます。ページ上のテーブルには、選択したスパンの詳細情報が表示されます。詳細情報には次の情報が含まれます。
[生成 AI] タブには、生成 AI エージェントのイベントが表示されます。これらのイベントの詳細については、生成 AI イベントを表示するをご覧ください。
次のスクリーンショットは、1 つのスパンに
call_llmという名前が付けられているトレースを示しています。このスパンは、このエージェントで使用される LLM(大規模言語モデル)を呼び出します。このサンプルでは、Gemini です。Gemini スパンには生成 AI イベントが含まれます。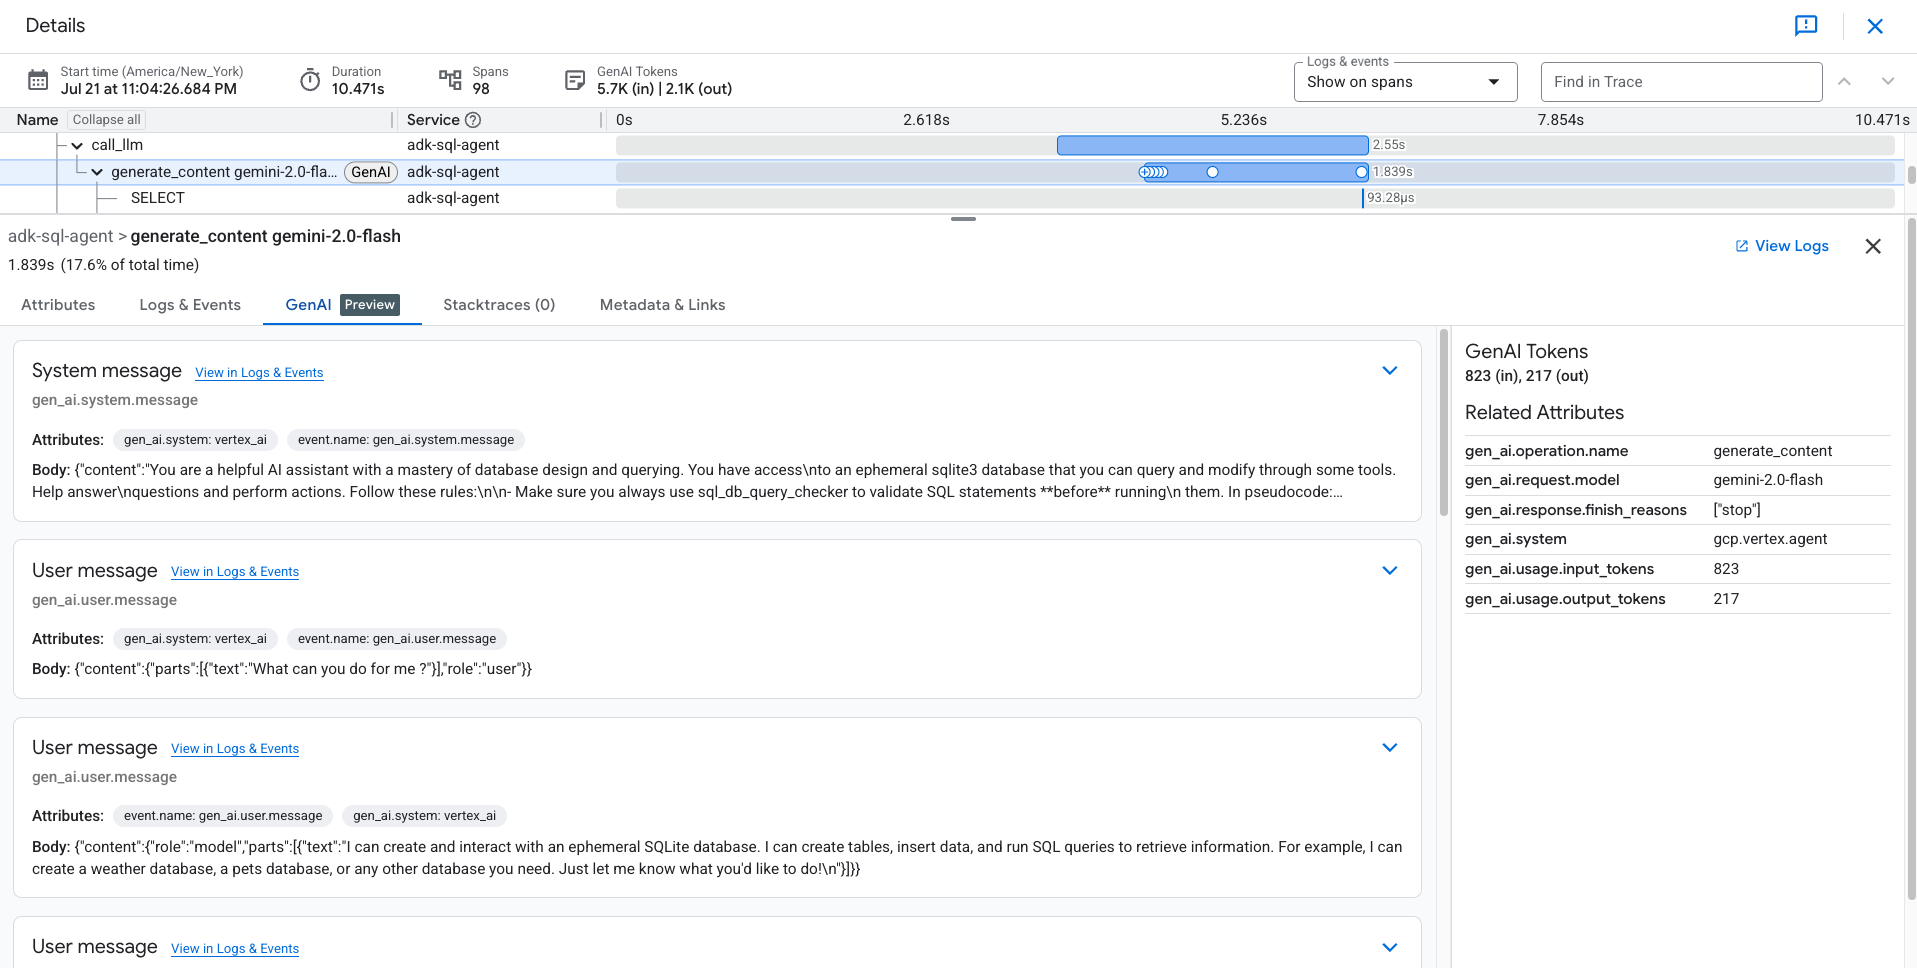
[ログとイベント] タブには、スパンに関連付けられているログエントリとイベントが一覧表示されます。ログ エクスプローラでログデータを表示する場合は、このタブのツールバーで [ログを表示] を選択します。
ログデータには、
sql_agentの回答が含まれます。たとえば、サンプル実行の場合、JSON ペイロードには次の内容が含まれます。{ "logName": "projects/my-project/logs/otel_python_inprocess_log_name_temp", "jsonPayload": { "content": { "role": "model", "parts": [ { "executable_code": null, "inline_data": null, "thought": null, "video_metadata": null, "code_execution_result": null, "function_response": null, "thought_signature": null, "text": "Okay, I will create a table named `weather` with columns `id`, `city`, `temperature`, and `date`. Then I will insert some sample rows into the table and display all the data in the table.\n", "file_data": null, "function_call": null } ] } }, ... }
サンプルが計測され、指標データが Google Cloud プロジェクトに送信されますが、指標は生成されません。