Cloud Profiler는 Flame 그래프를 사용하여 프로파일링 데이터를 표시합니다. 트리 및 그래프와 달리 Flame 그래프는 많은 양의 정보를 작고 읽기 쉬운 형식으로 표시하여 화면 공간을 효율적으로 사용합니다.
Flame 그래프를 설명하기 위해 이 페이지에서는 트리를 Flame 그래프로 변환하는 방법을 보여주고 Flame 그래프의 주요 특징을 간략하게 설명합니다.
Flame 그래프 만들기
트리에서 Flame 그래프를 만들려면 다음 다이어그램에 설명된 단계를 완료합니다.
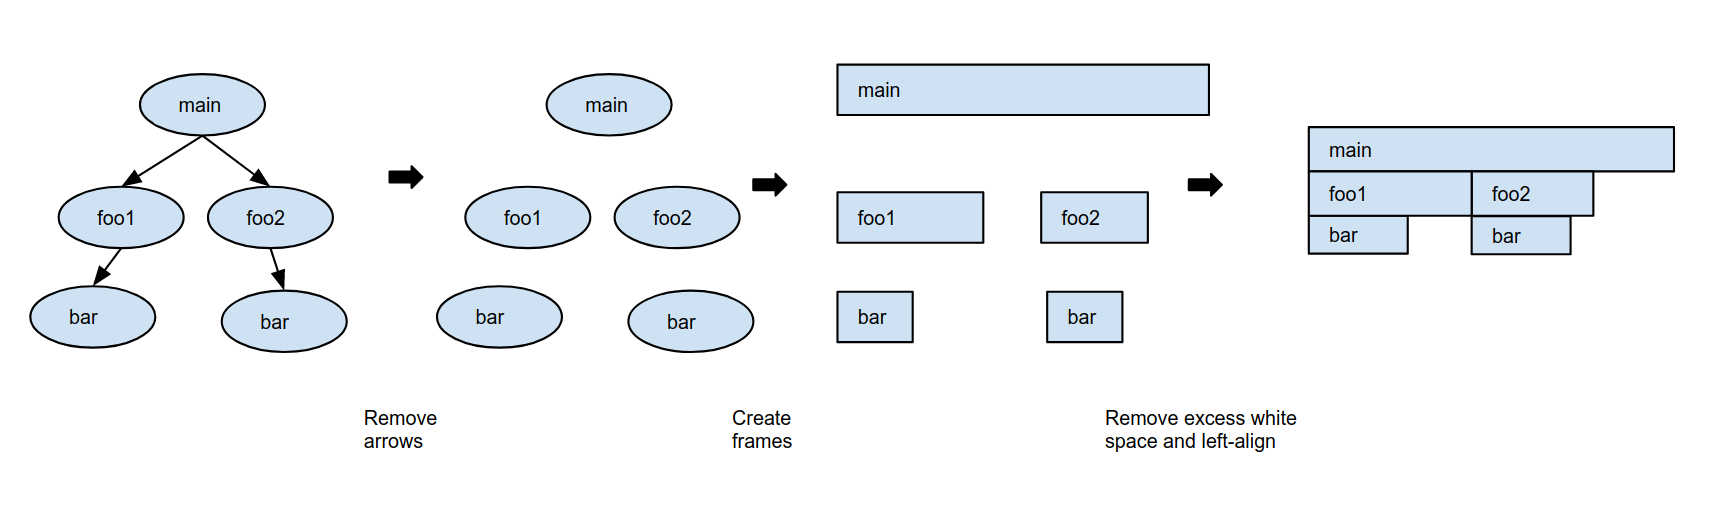
함수 호출을 나타내는 화살표를 트리에서 삭제합니다.
각 트리 노드를 프레임으로 바꿉니다.
프레임 모양은 직사각형이며 모든 프레임의 높이는 동일합니다.
이 페이지의 예시에서는 프레임에 명명된 함수가 사용하는 총 CPU 시간에 따라 프레임 너비가 결정됩니다.
다음 테이블에는 각 함수의 의사 코드가 설명되어 있습니다. 자체 CPU 시간은 함수 실행 중에 수행된 CPU를 많이 사용하는 작업으로 정의됩니다.
함수 의사 코드
자체 CPU 시간 (초)
총 CPU 시간 (초)
func main():
foo1()
foo2()
// CPU intensive work
// for 2 seconds
2
4 + 3 + 2 = 9
func foo1():
bar()
// CPU intensive work
// for 1.5 seconds
1.5
2.5 + 1.5 = 4
func foo2():
bar()
// CPU intensive work
// for 0.5 seconds
0.5
2.5 + 0.5 = 3
func bar():
// CPU intensive work
// for 2.5 seconds
2.5
2.5
다음 단계로, 호출 시퀀스를 유지하면서 프레임과 왼쪽 맞춤 프레임 사이의 세로 공간을 없앱니다.
원하는 경우 색 구성표를 정의하고 이러한 정의에 따라 프레임 색상을 지정할 수 있습니다. 예를 들어 패키지, 총 CPU 시간, 자체 CPU 시간 또는 다른 측정항목을 기준으로 프레임 색상을 지정할 수 있습니다.
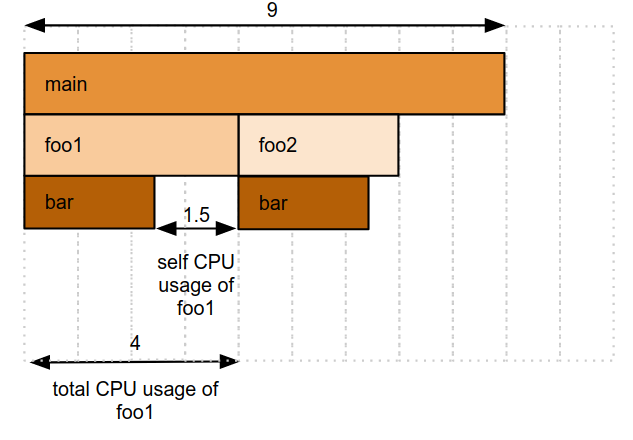
과도한 공백을 없애고 자체 CPU 시간별로 프레임 색상을 지정한 Flame 그래프는 다음과 같습니다.
이제 foo2로 시작하는 호출 스택이 foo1 프레임 옆에 있더라도 foo1 및 foo2의 호출 스택이 유지된다는 점에 주목하세요.
요약
위의 간단한 예시로 알 수 있는 사항은 다음과 같습니다.
Flame 그래프는 트리를 간결하게 표현한 그래프로, 위에서 아래로 프레임을 추적하여 호출 스택을 다시 만들 수 있습니다.
프레임은 함수이고, 프레임 너비는 함수의 총 CPU 시간을 상대적으로 측정한 값입니다.
이 예시에서는 foo2의 총 CPU 시간이 main의 총 CPU 시간의 1/3이므로 foo2의 프레임은 main의 프레임 너비의 1/3입니다.
프레임 아래의 빈 공간 너비는 프레임에서 명명된 함수의 자체 CPU 시간을 상대적으로 측정한 값입니다.
예를 들어 프레임 foo1 아래에서 1.5단위가 비어 있고 2.5단위는 bar에서 사용됩니다. 따라서 foo1의 자체 CPU 시간은 총 CPU 시간의 37.5%(1.5초)입니다.
피호출자의 총 CPU 시간은 호출자의 총 CPU 시간을 초과할 수 없으므로 호출 스택을 따라갈수록 프레임 너비가 줄어듭니다. 이에 따라 프레임 모양이 형성됩니다.
이 예시에서 foo1은 bar를 호출하고 foo1의 총 CPU 시간은 bar의 총 CPU 시간에 foo1의 자체 CPU 시간을 더한 값으로 정의됩니다. 따라서 bar의 총 CPU 시간은 foo1의 총 CPU 시간보다 길 수 없습니다.
[[["이해하기 쉬움","easyToUnderstand","thumb-up"],["문제가 해결됨","solvedMyProblem","thumb-up"],["기타","otherUp","thumb-up"]],[["이해하기 어려움","hardToUnderstand","thumb-down"],["잘못된 정보 또는 샘플 코드","incorrectInformationOrSampleCode","thumb-down"],["필요한 정보/샘플이 없음","missingTheInformationSamplesINeed","thumb-down"],["번역 문제","translationIssue","thumb-down"],["기타","otherDown","thumb-down"]],["최종 업데이트: 2025-09-04(UTC)"],[],[],null,["# Flame graphs\n============\n\nCloud Profiler displays profiling data by using\n[Flame Graphs](http://www.brendangregg.com/flamegraphs.html). Unlike trees and graphs,\nflame graphs make efficient use of screen space by representing a large amount\nof information in a compact and readable format.\n\nTo introduce flame graphs, this page illustrates how to convert a tree\ninto a flame graph and summarizes key features of flame graphs.\n\nCreating a flame graph\n----------------------\n\nTo create a flame graph from a tree, complete the steps illustrated in the\nfollowing diagram:\n\n1. Remove from the tree the arrows that indicate function calls.\n\n2. Replace each tree node with a *frame*.\n\n Frames are rectangular in shape and all frames have the same height.\n For the example on this page, the total CPU time used by the function named\n in the frame determines the frame width.\n | **Key Point:** In profiling, a functions' *total CPU time* is the CPU time used by the function including the CPU time used by all functions it calls. A function's *self CPU time* is the CPU time used by a function excluding the CPU time used by the functions it calls.\n\n The pseudo code for each of the functions is described in the following\n table. The CPU intensive work performed during a function's execution\n defines the self CPU time:\n\n \u003cbr /\u003e\n\n3. The next step is to remove the *vertical* space between the frames\n and left align frames while preserving call sequences.\n Optionally, you can define a color scheme and color the frames according\n to the definition. For example, you can color frames by their package,\n by total CPU time, by self CPU time, or by a different measure.\n\n After removing excess whitespace and coloring frames by the self\n CPU time, the flame graph now appears as follows:\n\n Notice that the call stacks for `foo1` and `foo2`\n have been preserved, even though the call stack starting with `foo2` is\n now next to the frame for `foo1`.\n\nSummary\n-------\n\nThis simple example illustrates the following:\n\n- Flame graphs are a compact representation of a tree and you can recreate a call stack by tracing frames from the top downwards.\n- Frames name a function and the frame width is the relative measure of that function's total CPU time. In this example, because the total CPU time of `foo2` is one third of the total CPU time of `main`, the frame for `foo2` is one third the width of the frame for `main`.\n- The width of the empty space below a frame is the relative measure of the self CPU time for the function named in the frame. For example, below the frame `foo1`, 1.5 units are empty and 2.5 units are occupied by `bar`. Therefore the self CPU time of `foo1` is 37.5% of its total CPU time, or 1.5 s.\n- As you follow a call stack, the widths of the frames decrease because the\n total CPU time of a callee can never be more than the total CPU time\n of the caller. This behavior is what causes the flame shape.\n\n In the example, `foo1` calls `bar` and the total CPU time of `foo1`\n is defined to be the total CPU time of `bar` *plus* the self CPU time of\n `foo1`. Therefore, the total CPU time of `bar` cannot be more than the\n total CPU time of `foo1`.\n\nWhat's next\n-----------\n\n- [Select the profiles to analyze](/profiler/docs/selecting-profiles)\n- [Interact with the flame graph](/profiler/docs/interacting-flame-graph)\n- [Filter the flame graph](/profiler/docs/filtering-profiles)\n- [Focus the flame graph](/profiler/docs/focusing-profiles)\n- [Compare profiles](/profiler/docs/comparing-profiles)"]]