Monitor services
This guide describes how to use the underlying Google Cloud services and Manufacturing Data Engine (MDE) metrics to proactively identify processing pipeline issues, diagnose configuration or system problems, and monitor system scaling in response to current load.
Metrics published by MDE
MDE publishes custom metrics for its different services, all of them offer a p50, p95, and max percentiles.
| Metric | Definition |
|---|---|
| custom/mde/configuration/error/count | Errors encountered processing messages in configuration manager service . |
| custom/mde/configuration/messages/count | Number of messages processed by the configuration manager service. |
| custom/mde/configuration/processing/time | Message processing time in the configuration manager service. |
| custom/mde/configuration/tags/cached/count | Total count of the cached tag requested from the configuration manager service. |
| custom/mde/configuration/tags/created/count | Total count of the created tags requested from the configuration manager service. |
| custom/mde/configuration/messages/pubsub/shift/publishing | Time difference between publishing the message to PubSub and the event timestamp in the configuration manager. |
| custom/mde/configuration/messages/pubsub/shift/receiving | Time difference between receiving the message from PubSub and the event timestamp in the configuration manager. |
| custom/mde/metadata/error/count | Errors encountered processing messages in metadata service. |
| custom/mde/metadata/messages/count | Number of messages processed by the metadata service. |
| custom/mde/metadata/processing/time | Message processing time in the metadata service. |
| custom/mde/metadata/instance/cached | Total count of the cached metadata instances as they are received by the metadata service. |
| custom/mde/metadata/instance/created | Total count of the created metadata instances as they are received by the metadata service. |
| custom/mde/metadata/messages/pubsub/shift/publishing | Time difference between publishing the message to PubSub and the event timestamp in the metadata service. |
| custom/mde/metadata/messages/pubsub/shift/receiving | Time difference between receiving the message from PubSub and the event timestamp in the metadata service. |
| custom/mde/mapper/error/count | Errors encountered processing messages in mapper service. |
| custom/mde/mapper/messages/count | Number of messages processed by the mapper service. |
| custom/mde/mapper/processing/time | Message processing time in the mapper service. |
| custom/mde/mapper/messages/pubsub/shift/publishing | Time difference between publishing the message to PubSub and the event timestamp in the mapper service. |
| custom/mde/mapper/messages/pubsub/shift/receiving | Time difference between receiving the message from PubSub and the event timestamp in the mapper service. |
| custom/mde/federation/request/processing/bq | Request processing time in the MDE federation service for BigQuery requests. |
| custom/mde/federation/request/processing/bt | Request processing time in the MDE federation service for Big table requests. |
| custom/mde/federation/request/processing/cfg | Request processing time in the MDE federation service for Config requests. |
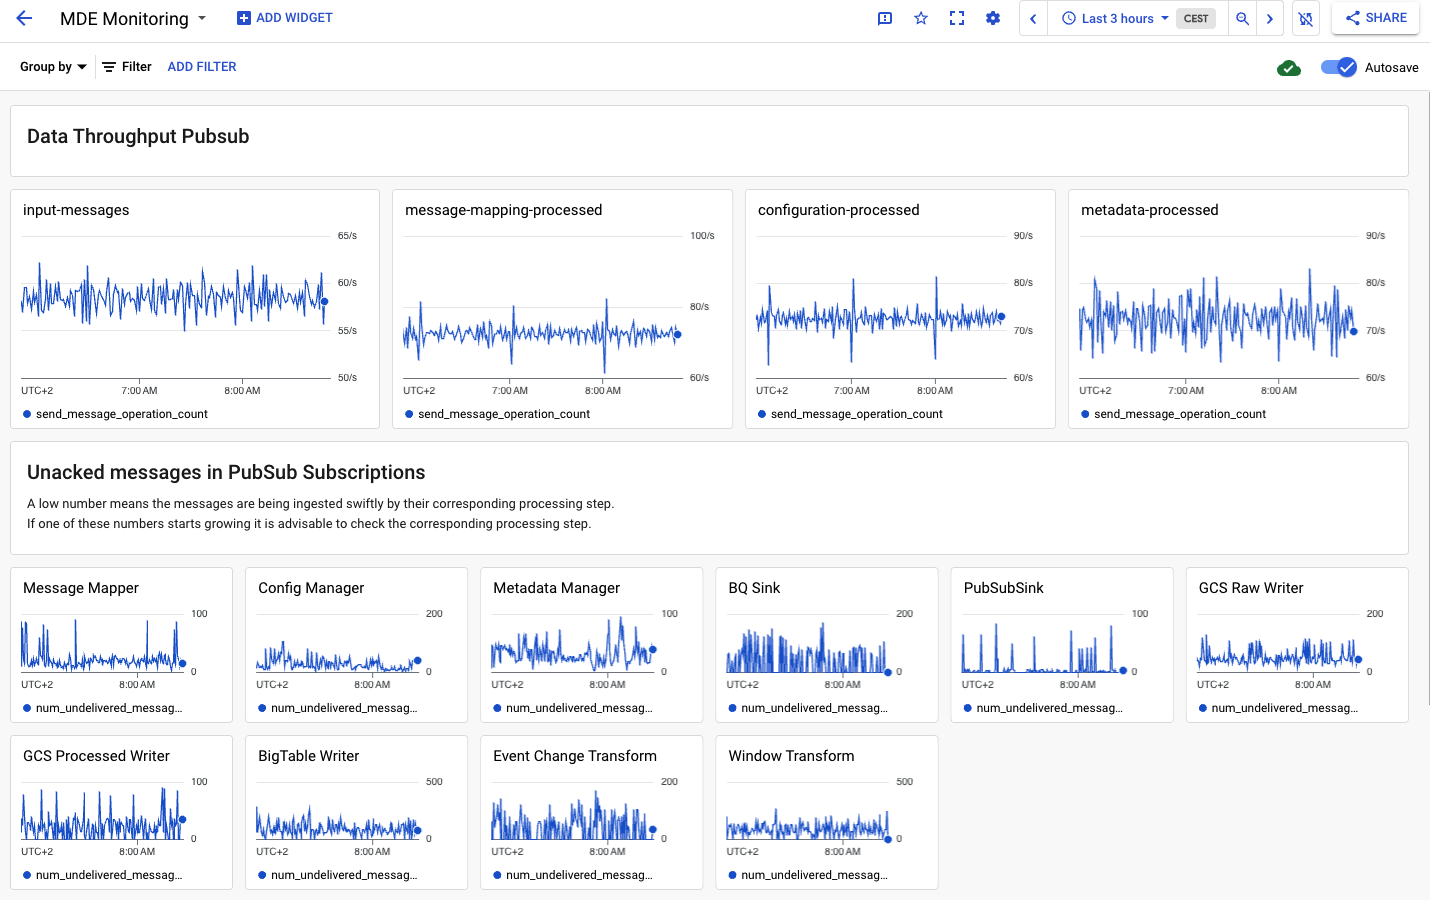
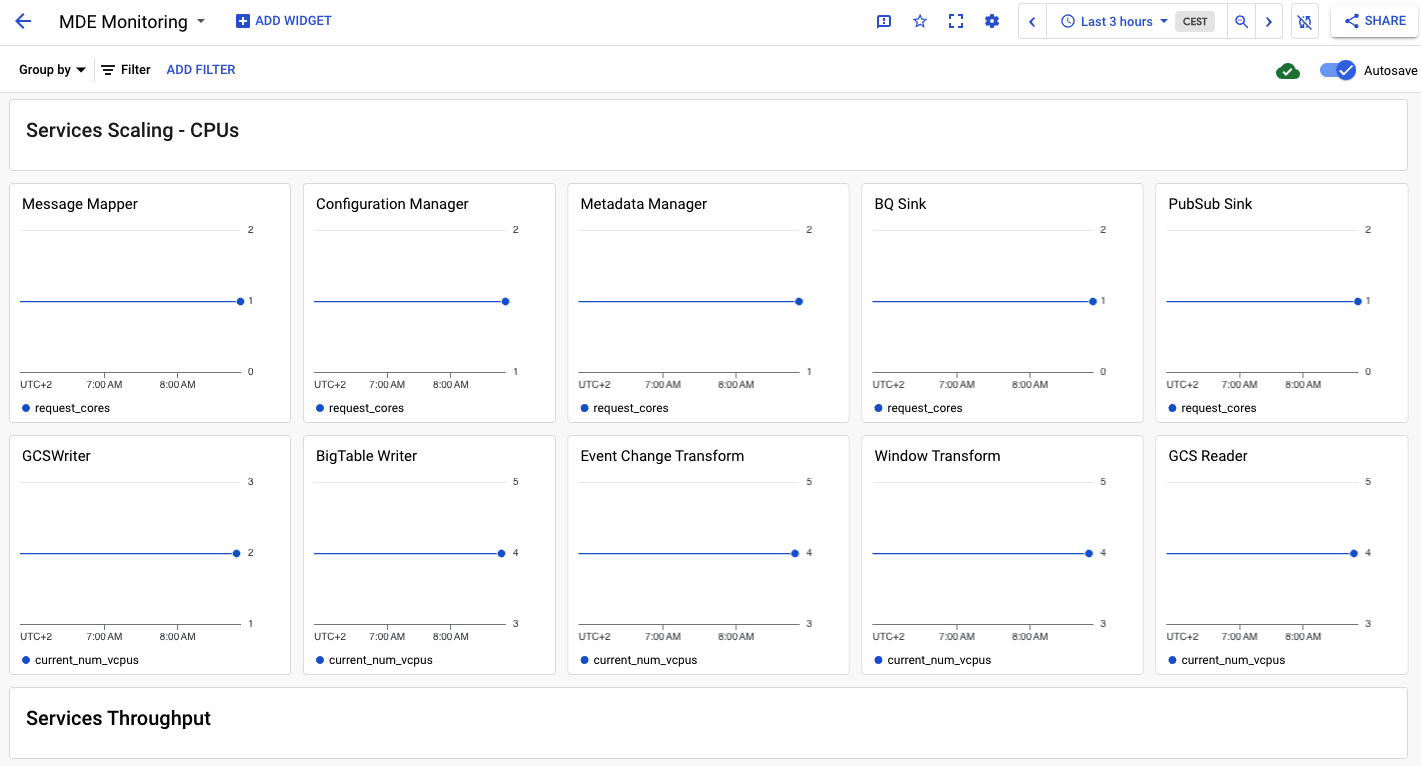
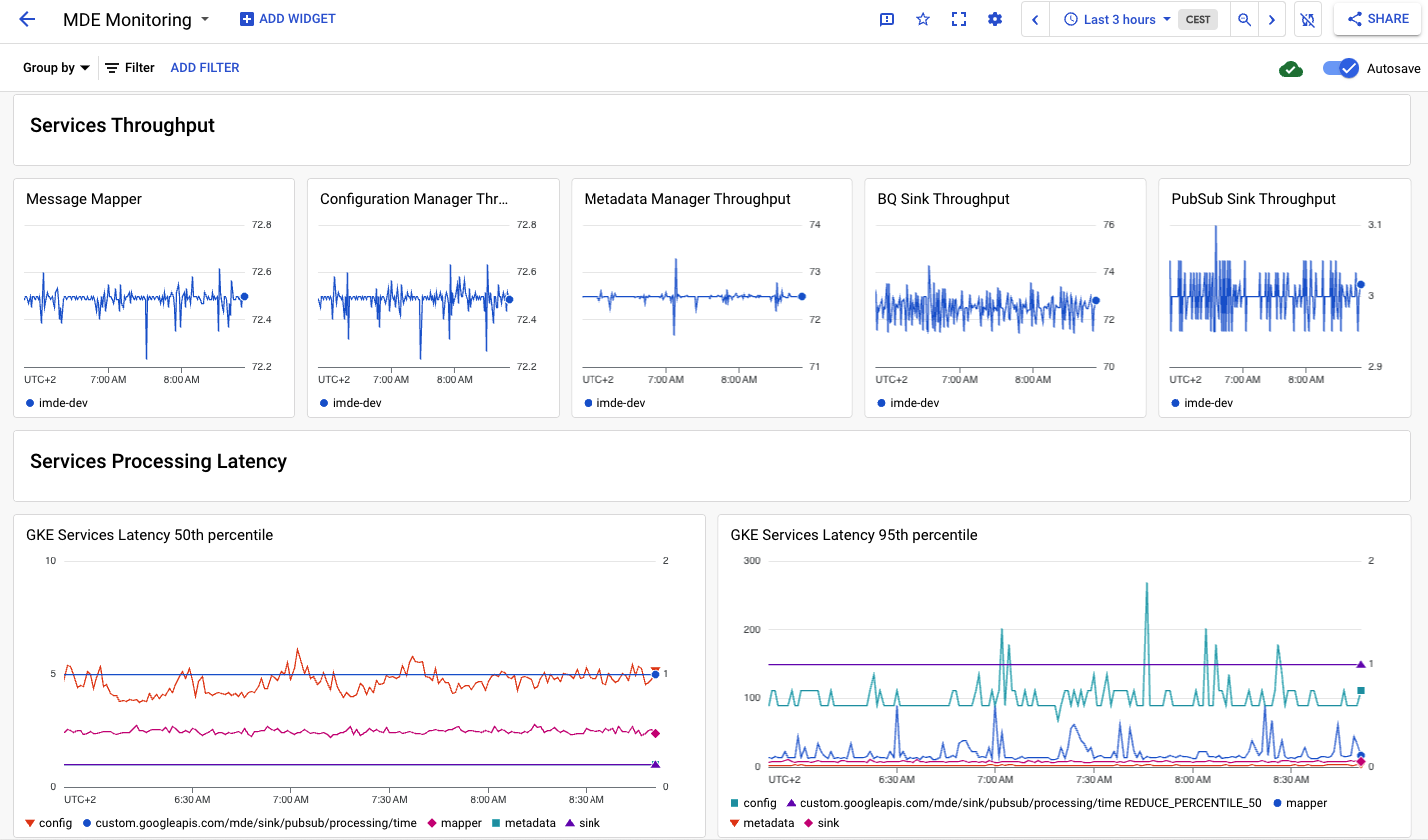
MDE monitoring dashboard
In order to monitor the Google Cloud services and metrics you can use the
built-in Monitoring Dashboard named MDE Monitoring. The
following are examples of the MDE monitoring dashboard interface.