このドキュメントでは、VMware 用 Google Distributed Cloud(ソフトウェアのみ)で作成されたクラスタをモニタリングするために推奨される一連のカスタム ダッシュボードの作成方法について説明します。
ダッシュボードを作成する権限
ダッシュボードを作成するには、Google アカウントにダッシュボードを作成するための次の権限が付与されている必要があります。
monitoring.dashboards.createmonitoring.dashboards.deletemonitoring.dashboards.update
アカウントに次のいずれかのロールが割り当てられていると、これらの権限が付与されます。権限は、 Google Cloud コンソール で確認できます。
monitoring.dashboardEditormonitoring.editor- プロジェクト
editor - プロジェクト
owner
また、gcloud(gcloud CLI)を使用してダッシュボードを作成するには、Google アカウントに serviceusage.services.use 権限が必要です。
次のいずれかのロールが割り当てられている場合、アカウントにこの権限が割り当てられます。
roles/serviceusage.serviceUsageConsumerroles/serviceusage.serviceUsageAdminroles/ownerroles/editor- プロジェクト
editor - プロジェクト
owner
推奨されるダッシュボード
クラスタ(管理者またはユーザー)を作成したら、Cloud Monitoring で次のダッシュボードを作成し、運用チームがクラスタの状態をモニタリングできるようにすることをおすすめします。
- コントロール プレーンの稼働時間ダッシュボード
- Pod のステータス ダッシュボード
- ノードのステータス ダッシュボード
- VM のヘルス ステータス ダッシュボード
- ノード使用率ダッシュボード
- Anthos 使用率測定ダッシュボード
クラスタで Windows Server OS ノードも実行している場合は、次のダッシュボードを作成して、Windows ノードと Pod のステータスをモニタリングできます。
- Windows ノードのステータス ダッシュボード
- Windows Pod のステータス ダッシュボード
ダッシュボードは、Cloud Monitoring が有効になっている場合、管理クラスタのインストール時に自動的に作成されます。
ここでは、これらのダッシュボードを作成する方法について説明します。以下で説明するダッシュボード作成プロセスの詳細については、API によるダッシュボードの管理をご覧ください。
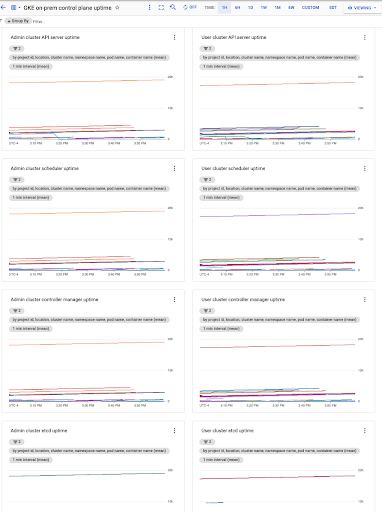
コントロール プレーンの稼働時間ダッシュボードを作成する
コントロール プレーンは、API サーバー、スケジューラ、コントローラ マネージャー、etcd で構成されています。コントロール プレーンのステータスをモニタリングするには、これらのコンポーネントの状態をモニタリングするダッシュボードを作成します。
ダッシュボード構成
control-plane-uptime.jsonをダウンロードします。次のコマンドを実行して、構成ファイルを含むカスタム ダッシュボードを作成します。
gcloud monitoring dashboards create --config-from-file=control-plane-uptime.json
Google Cloud コンソールで [Monitoring] を選択するか、次のボタンを使用します。
[リソース] > [ダッシュボード] を選択し、[GKE on-prem control plane uptime] というダッシュボードを表示します。各ユーザー クラスタのコントロール プレーンの稼働時間は、管理クラスタ内の別の Namespace から収集されます。namespace_name フィールドは、ユーザー クラスタ名です。
必要に応じてアラート ポリシーを作成します。
クリックしてサンプル ダッシュボードを表示します。
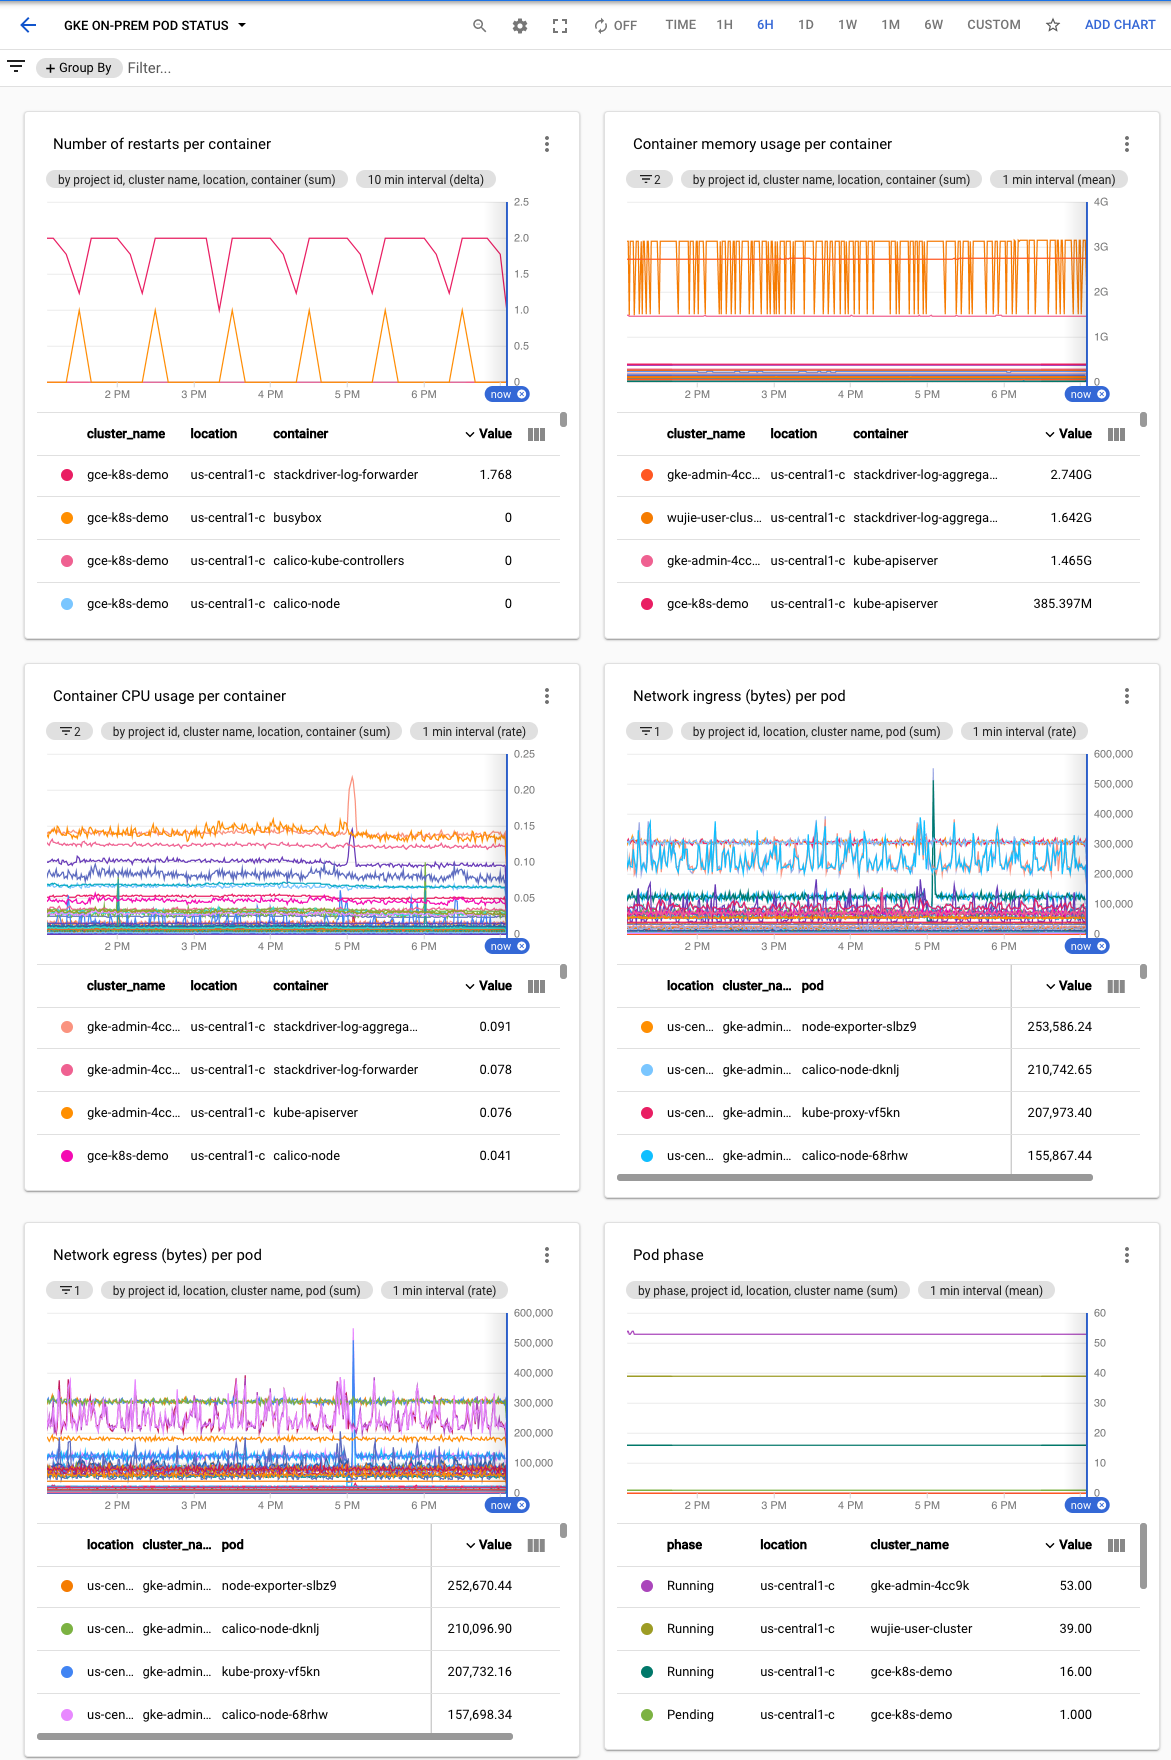
Pod ステータス ダッシュボードを作成する
各 Pod のフェーズ、各コンテナの再起動時間とリソース使用状況を含むダッシュボードの作成は、次の手順で行います。
ダッシュボード構成
pod-status.jsonをダウンロードします。次のコマンドを実行して、構成ファイルを含むカスタム ダッシュボードを作成します。
gcloud monitoring dashboards create --config-from-file=pod-status.json
Google Cloud コンソールで [Monitoring] を選択するか、次のボタンを使用します。
[リソース] > [ダッシュボード] を選択し、[GKE On-Prem Pod Status] というダッシュボードを表示します。
必要に応じてアラート ポリシーを作成します。
クリックしてサンプル ダッシュボードを表示します。
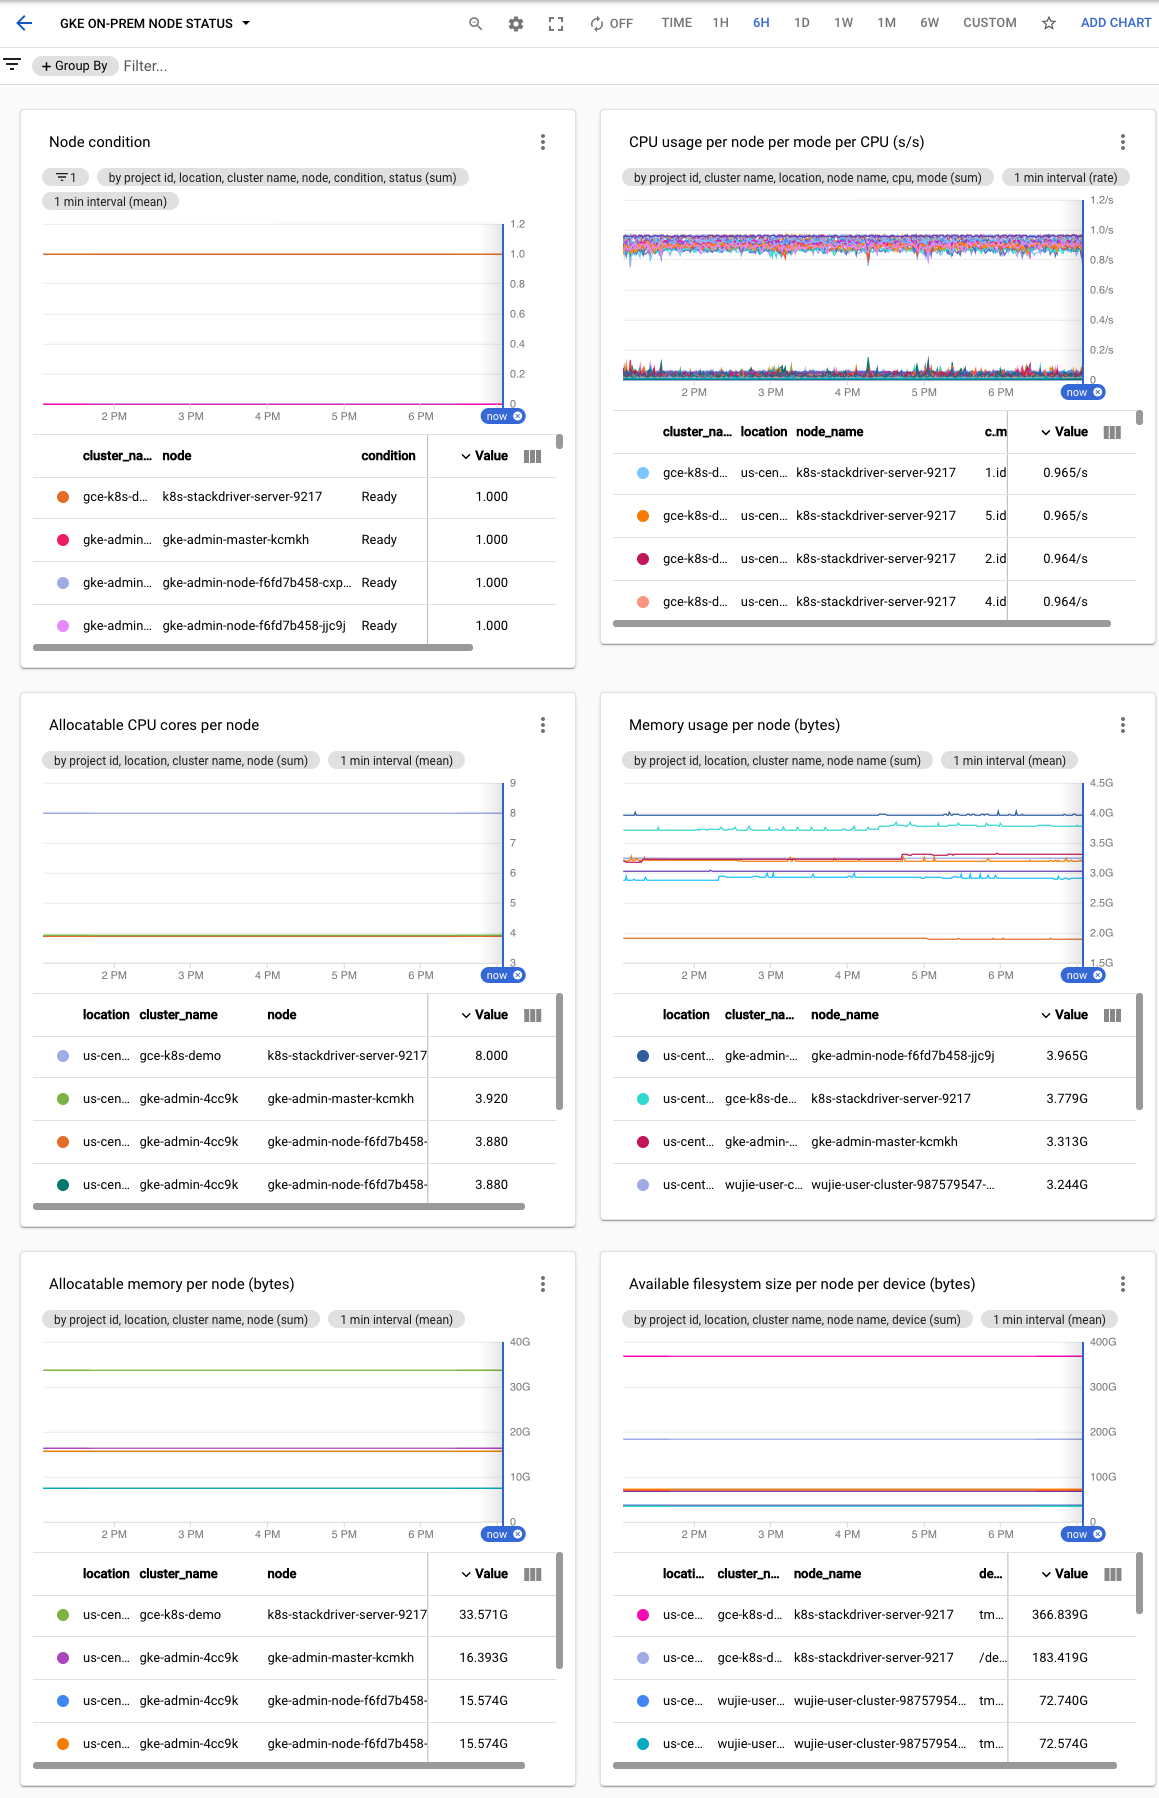
ノード ステータス ダッシュボードを作成する
ノードの状態、CPU、メモリ、ディスクの使用状況をモニタリングするノード ステータス ダッシュボードを作成するには、次の手順を実行します。
ダッシュボード構成
node-status.jsonをダウンロードします。次のコマンドを実行して、構成ファイルを含むカスタム ダッシュボードを作成します。
gcloud monitoring dashboards create --config-from-file=node-status.json
Google Cloud コンソールで [Monitoring] を選択するか、次のボタンを使用します。
[リソース] > [ダッシュボード] を選択し、[GKE On-Prem Node Status] というダッシュボードを表示します。
必要に応じてアラート ポリシーを作成します。
クリックしてサンプル ダッシュボードを表示します。
VM のヘルス ステータス ダッシュボードを作成する
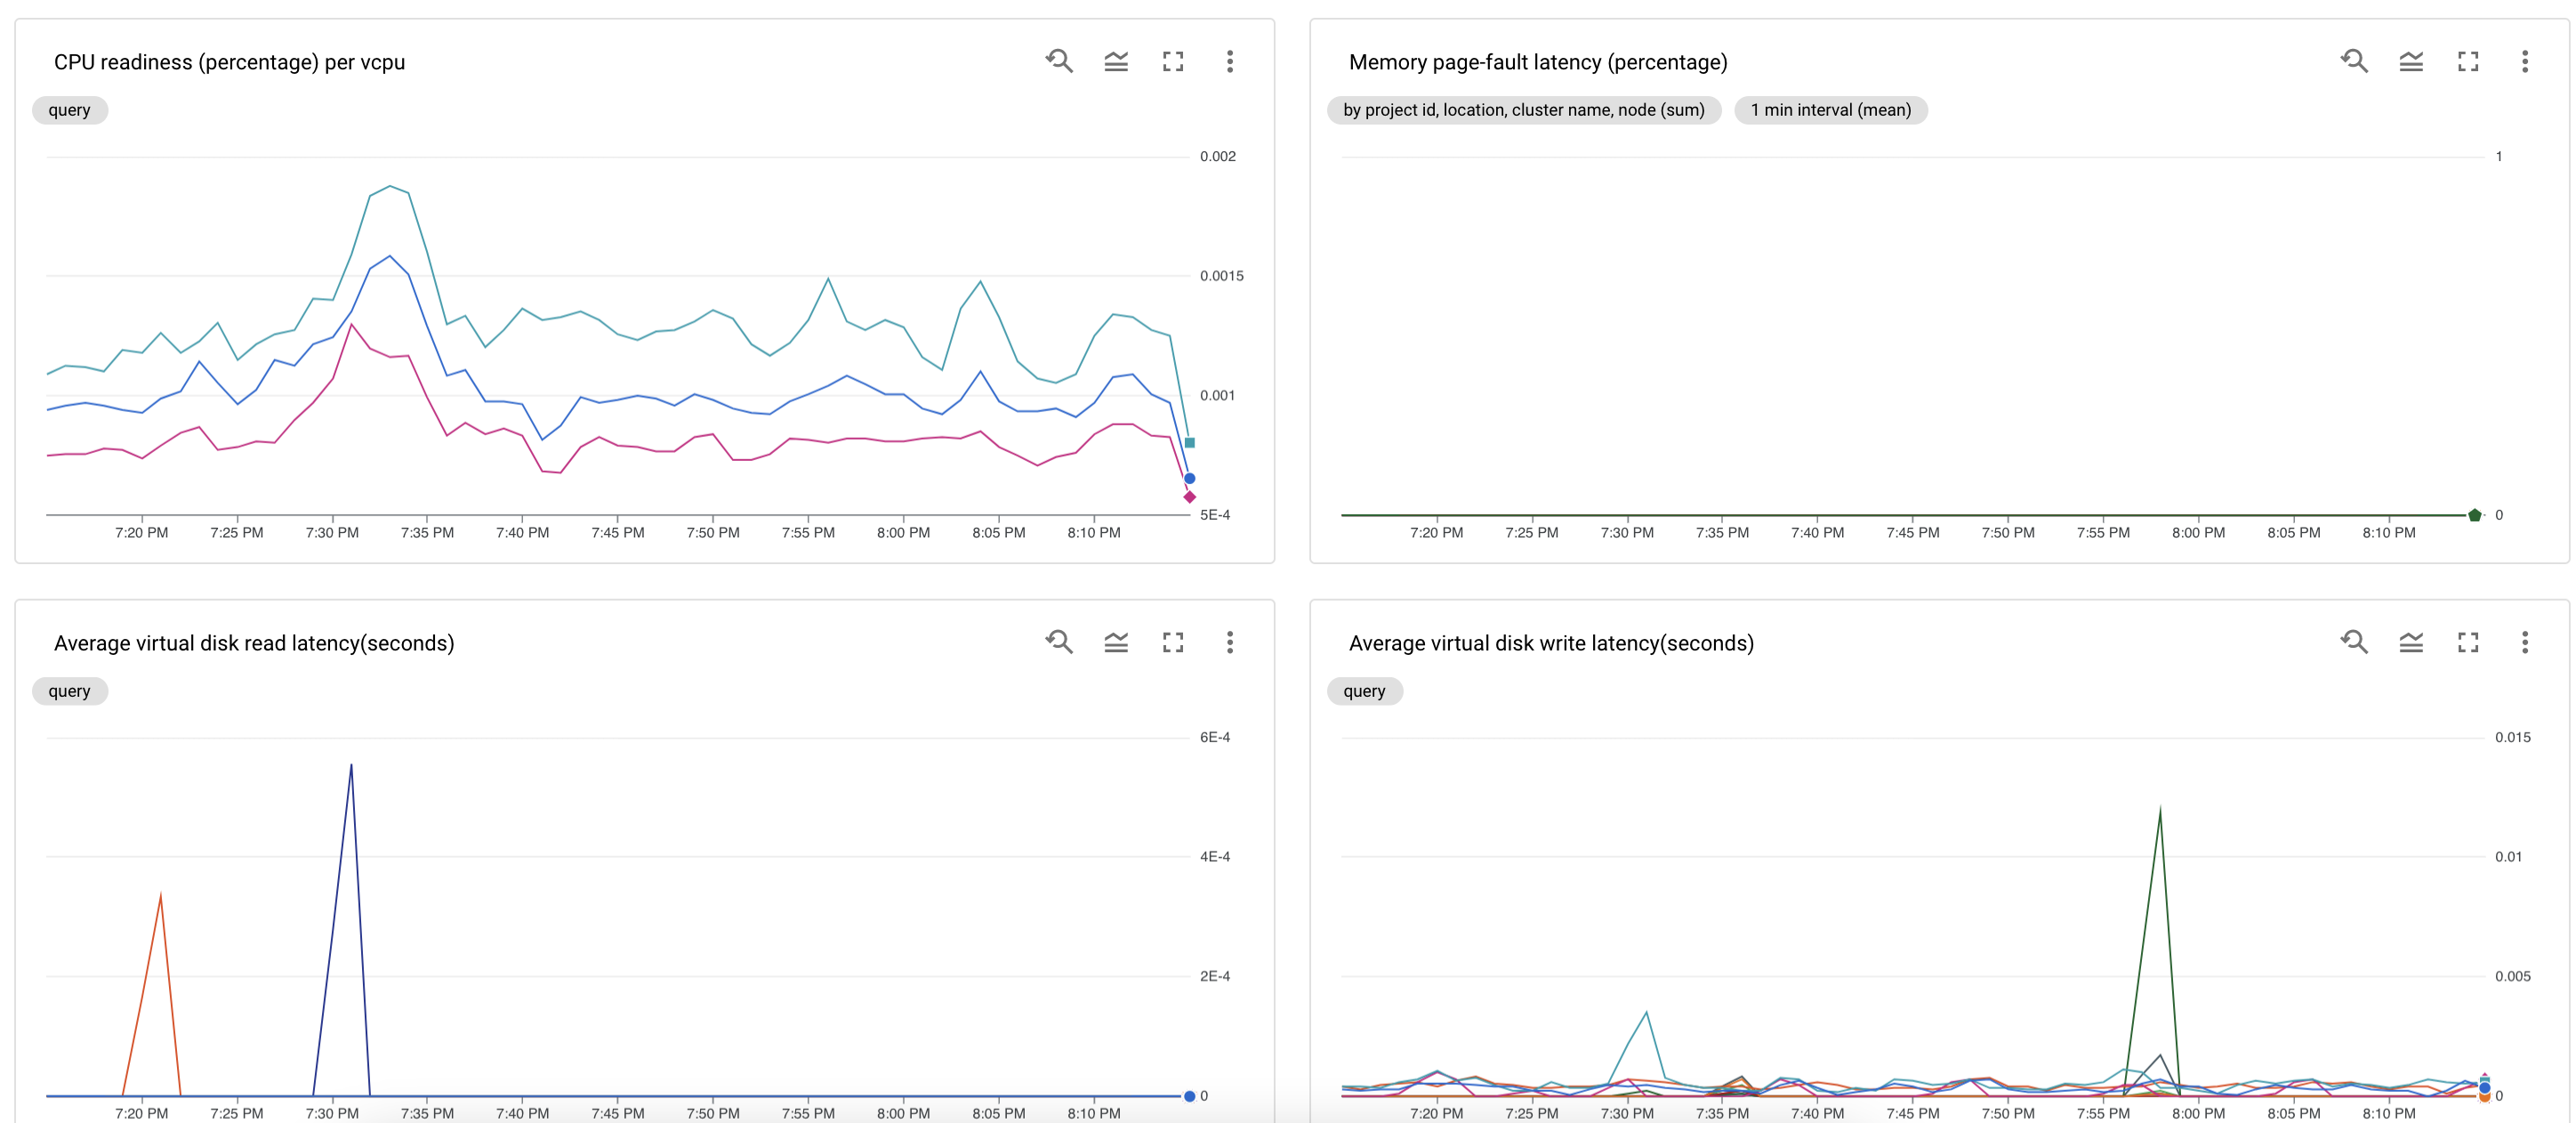
VM のヘルス ステータス ダッシュボードは、管理クラスタとユーザー クラスタの VM の CPU、メモリ、ディスク リソースの競合シグナルをモニタリングします。
VM のヘルス ステータス ダッシュボードを作成するには:
stackdriver.disableVsphereResourceMetricsが false に設定されていることを確認します。ユーザー クラスタの構成ファイルをご覧ください。ダッシュボード構成
vm-health-status.jsonをダウンロードします。次のコマンドを実行して、構成ファイルを含むカスタム ダッシュボードを作成します。
gcloud monitoring dashboards create --config-from-file=vm-health-status.json
Google Cloud コンソールで [Monitoring] を選択するか、次のボタンを使用します。
[リソース] > [ダッシュボード] を選択し、GKE on-prem VM health status というダッシュボードを表示します。
必要に応じてアラート ポリシーを作成します。
クリックしてサンプル ダッシュボードを表示します。
ノード使用率ダッシュボードを作成する
ノード使用率ダッシュボードには、クラスタでの次の使用率が表示されます。
- ノード CPU の割り当て率
- Kubernetes ワークロードをスケジュールするために使用できる vCPU
- ノードのメモリ割り当て率
- K8s ワークロードをスケジュールするために使用できるメモリ
- ノードディスクの使用率
ノード使用率ダッシュボードを作成するには:
ダッシュボード構成
node-utilization.jsonをダウンロードします。次のコマンドを実行し、この構成ファイルでカスタム ダッシュボードを作成します。
gcloud monitoring dashboards create --config-from-file=node-utilization.json
Google Cloud コンソールで [Monitoring] を選択するか、次のボタンを使用します。
[リソース ] > [ダッシュボード] を選択し、[GKE On-Prem node utilization] というダッシュボードを表示します。
必要に応じてアラート ポリシーを作成します。
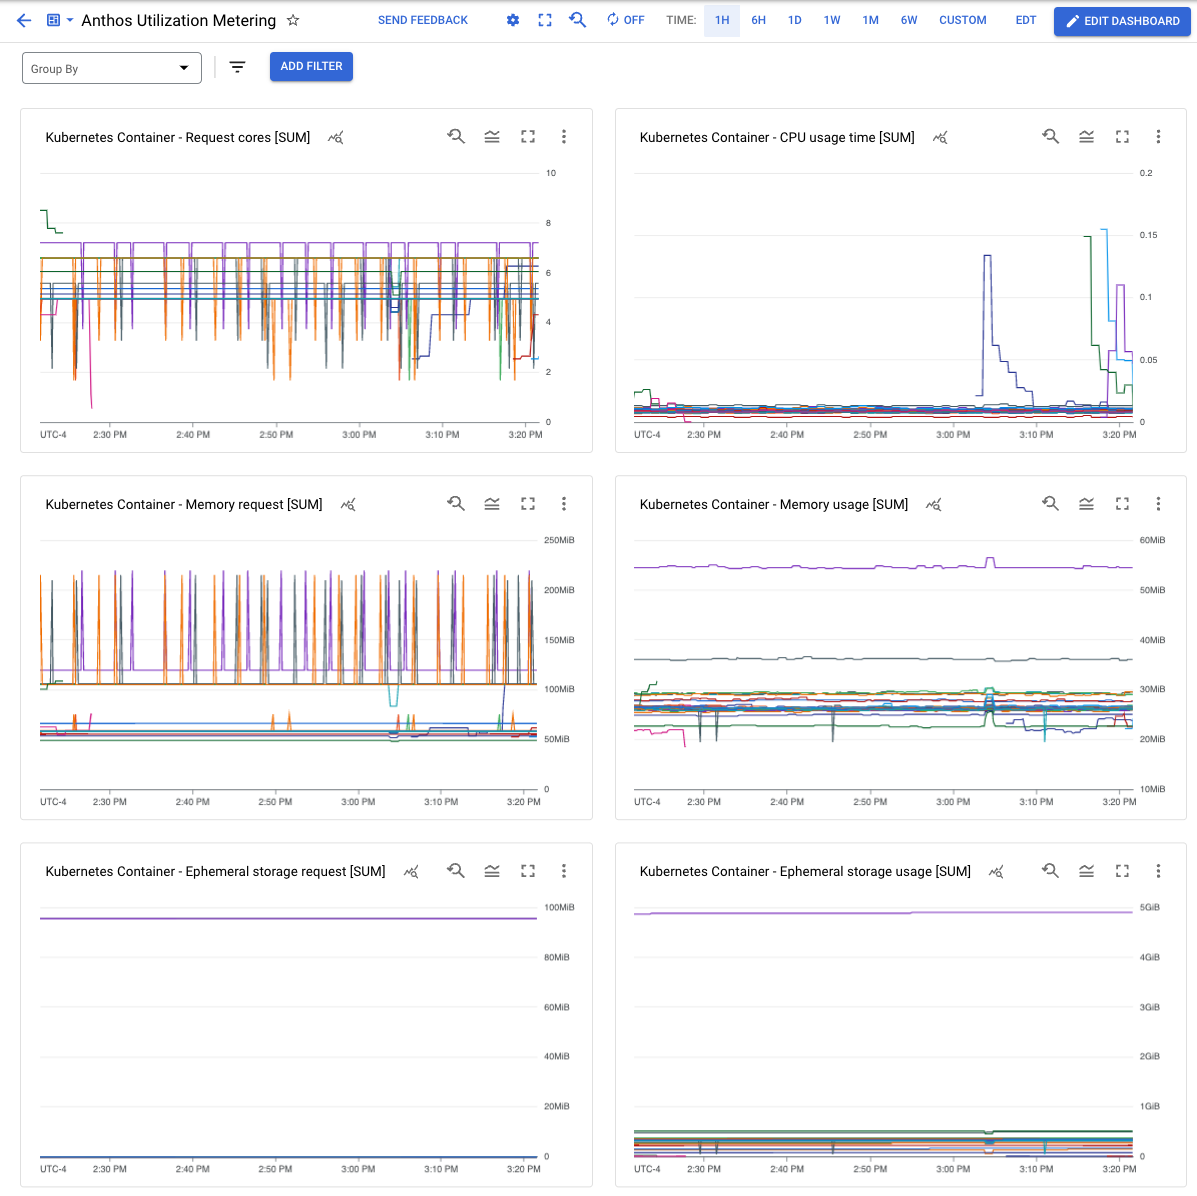
Anthos Utilization Metering ダッシュボードを作成する
Anthos Utilization Metering ダッシュボードには、クラスタの CPU とメモリの使用率が名前空間別、Pod のラベル別に表示されます。
Anthos Utilization Metering ダッシュボードを作成するには:
ダッシュボード構成
anthos-utilization.jsonをダウンロードします。次のコマンドを実行し、この構成ファイルでカスタム ダッシュボードを作成します。
gcloud monitoring dashboards create --config-from-file=anthos-utilization.json
Google Cloud コンソールで [Monitoring] を選択するか、次のボタンを使用します。
[リソース] > [ダッシュボード] を選択し、[Anthos Utilization Metering] というダッシュボードを表示します。
必要に応じてアラート ポリシーを作成します。
クリックしてサンプル ダッシュボードを表示します。