This document provides information about Spark metrics. By default, Serverless for Apache Spark enables the collection of available Spark metrics, unless you use Spark metrics collection properties to disable or override the collection of one or more Spark metrics.
For additional properties that you can set when you submit a Serverless for Apache Spark Spark batch workload, see Spark properties
Spark metrics collection properties
You can use the properties listed in this section to disable or override the collection of one or more available Spark metrics.
| Property | Description |
|---|---|
spark.dataproc.driver.metrics |
Use to disable or override Spark driver metrics. |
spark.dataproc.executor.metrics |
Use to disable or override Spark executor metrics. |
spark.dataproc.system.metrics |
Use to disable Spark system metrics. |
gcloud CLI examples:
Disable Spark driver metric collection:
gcloud dataproc batches submit spark \
    --properties spark.dataproc.driver.metrics="" \
    --region=region \
    other args ...
Override Spark default driver metric collection to collect only
BlockManager:disk.diskSpaceUsed_MBandDAGScheduler:stage.failedStagesmetrics:gcloud dataproc batches submit spark \ --properties=^~^spark.dataproc.driver.metrics="BlockManager:disk.diskSpaceUsed_MB,DAGScheduler:stage.failedStages" \ --region=region \ other args ...
Available Spark metrics
Serverless for Apache Spark collects the Spark metrics listed in this section unless you use Spark metric collection properties to disable or override their collection.
custom.googleapis.com/METRIC_EXPLORER_NAME.
Spark driver metrics
| Metric | Metrics Explorer name |
|---|---|
| BlockManager:disk.diskSpaceUsed_MB | spark/driver/BlockManager/disk/diskSpaceUsed_MB |
| BlockManager:memory.maxMem_MB | spark/driver/BlockManager/memory/maxMem_MB |
| BlockManager:memory.memUsed_MB | spark/driver/BlockManager/memory/memUsed_MB |
| DAGScheduler:job.activeJobs | spark/driver/DAGScheduler/job/activeJobs |
| DAGScheduler:job.allJobs | spark/driver/DAGScheduler/job/allJobs |
| DAGScheduler:messageProcessingTime | spark/driver/DAGScheduler/messageProcessingTime |
| DAGScheduler:stage.failedStages | spark/driver/DAGScheduler/stage/failedStages |
| DAGScheduler:stage.runningStages | spark/driver/DAGScheduler/stage/runningStages |
| DAGScheduler:stage.waitingStages | spark/driver/DAGScheduler/stage/waitingStages |
Spark executor metrics
| Metric | Metrics Explorer name |
|---|---|
| ExecutorAllocationManager:executors.numberExecutorsDecommissionUnfinished | spark/driver/ExecutorAllocationManager/executors/numberExecutorsDecommissionUnfinished |
| ExecutorAllocationManager:executors.numberExecutorsExitedUnexpectedly | spark/driver/ExecutorAllocationManager/executors/numberExecutorsExitedUnexpectedly |
| ExecutorAllocationManager:executors.numberExecutorsGracefullyDecommissioned | spark/driver/ExecutorAllocationManager/executors/numberExecutorsGracefullyDecommissioned |
| ExecutorAllocationManager:executors.numberExecutorsKilledByDriver | spark/driver/ExecutorAllocationManager/executors/numberExecutorsKilledByDriver |
| LiveListenerBus:queue.executorManagement.listenerProcessingTime | spark/driver/LiveListenerBus/queue/executorManagement/listenerProcessingTime |
| executor:bytesRead | spark/executor/bytesRead |
| executor:bytesWritten | spark/executor/bytesWritten |
| executor:cpuTime | spark/executor/cpuTime |
| executor:diskBytesSpilled | spark/executor/diskBytesSpilled |
| executor:jvmGCTime | spark/executor/jvmGCTime |
| executor:memoryBytesSpilled | spark/executor/memoryBytesSpilled |
| executor:recordsRead | spark/executor/recordsRead |
| executor:recordsWritten | spark/executor/recordsWritten |
| executor:runTime | spark/executor/runTime |
| executor:shuffleFetchWaitTime | spark/executor/shuffleFetchWaitTime |
| executor:shuffleRecordsRead | spark/executor/shuffleRecordsRead |
| executor:shuffleRecordsWritten | spark/executor/shuffleRecordsWritten |
| executor:shuffleRemoteBytesReadToDisk | spark/executor/shuffleRemoteBytesReadToDisk |
| executor:shuffleWriteTime | spark/executor/shuffleWriteTime |
| executor:succeededTasks | spark/executor/succeededTasks |
| ExecutorMetrics:MajorGCTime | spark/executor/ExecutorMetrics/MajorGCTime |
| ExecutorMetrics:MinorGCTime | spark/executor/ExecutorMetrics/MinorGCTime |
System metrics
| Metric | Metric Explorer Name |
|---|---|
| agent:uptime | agent/uptime |
| cpu:utilization | cpu/utilization |
| disk:bytes_used | disk/bytes_used |
| disk:percent_used | disk/percent_used |
| memory:bytes_used | memory/bytes_used |
| memory:percent_used | memory/percent_used |
| network:tcp_connections | network/tcp_connections |
View Spark metrics
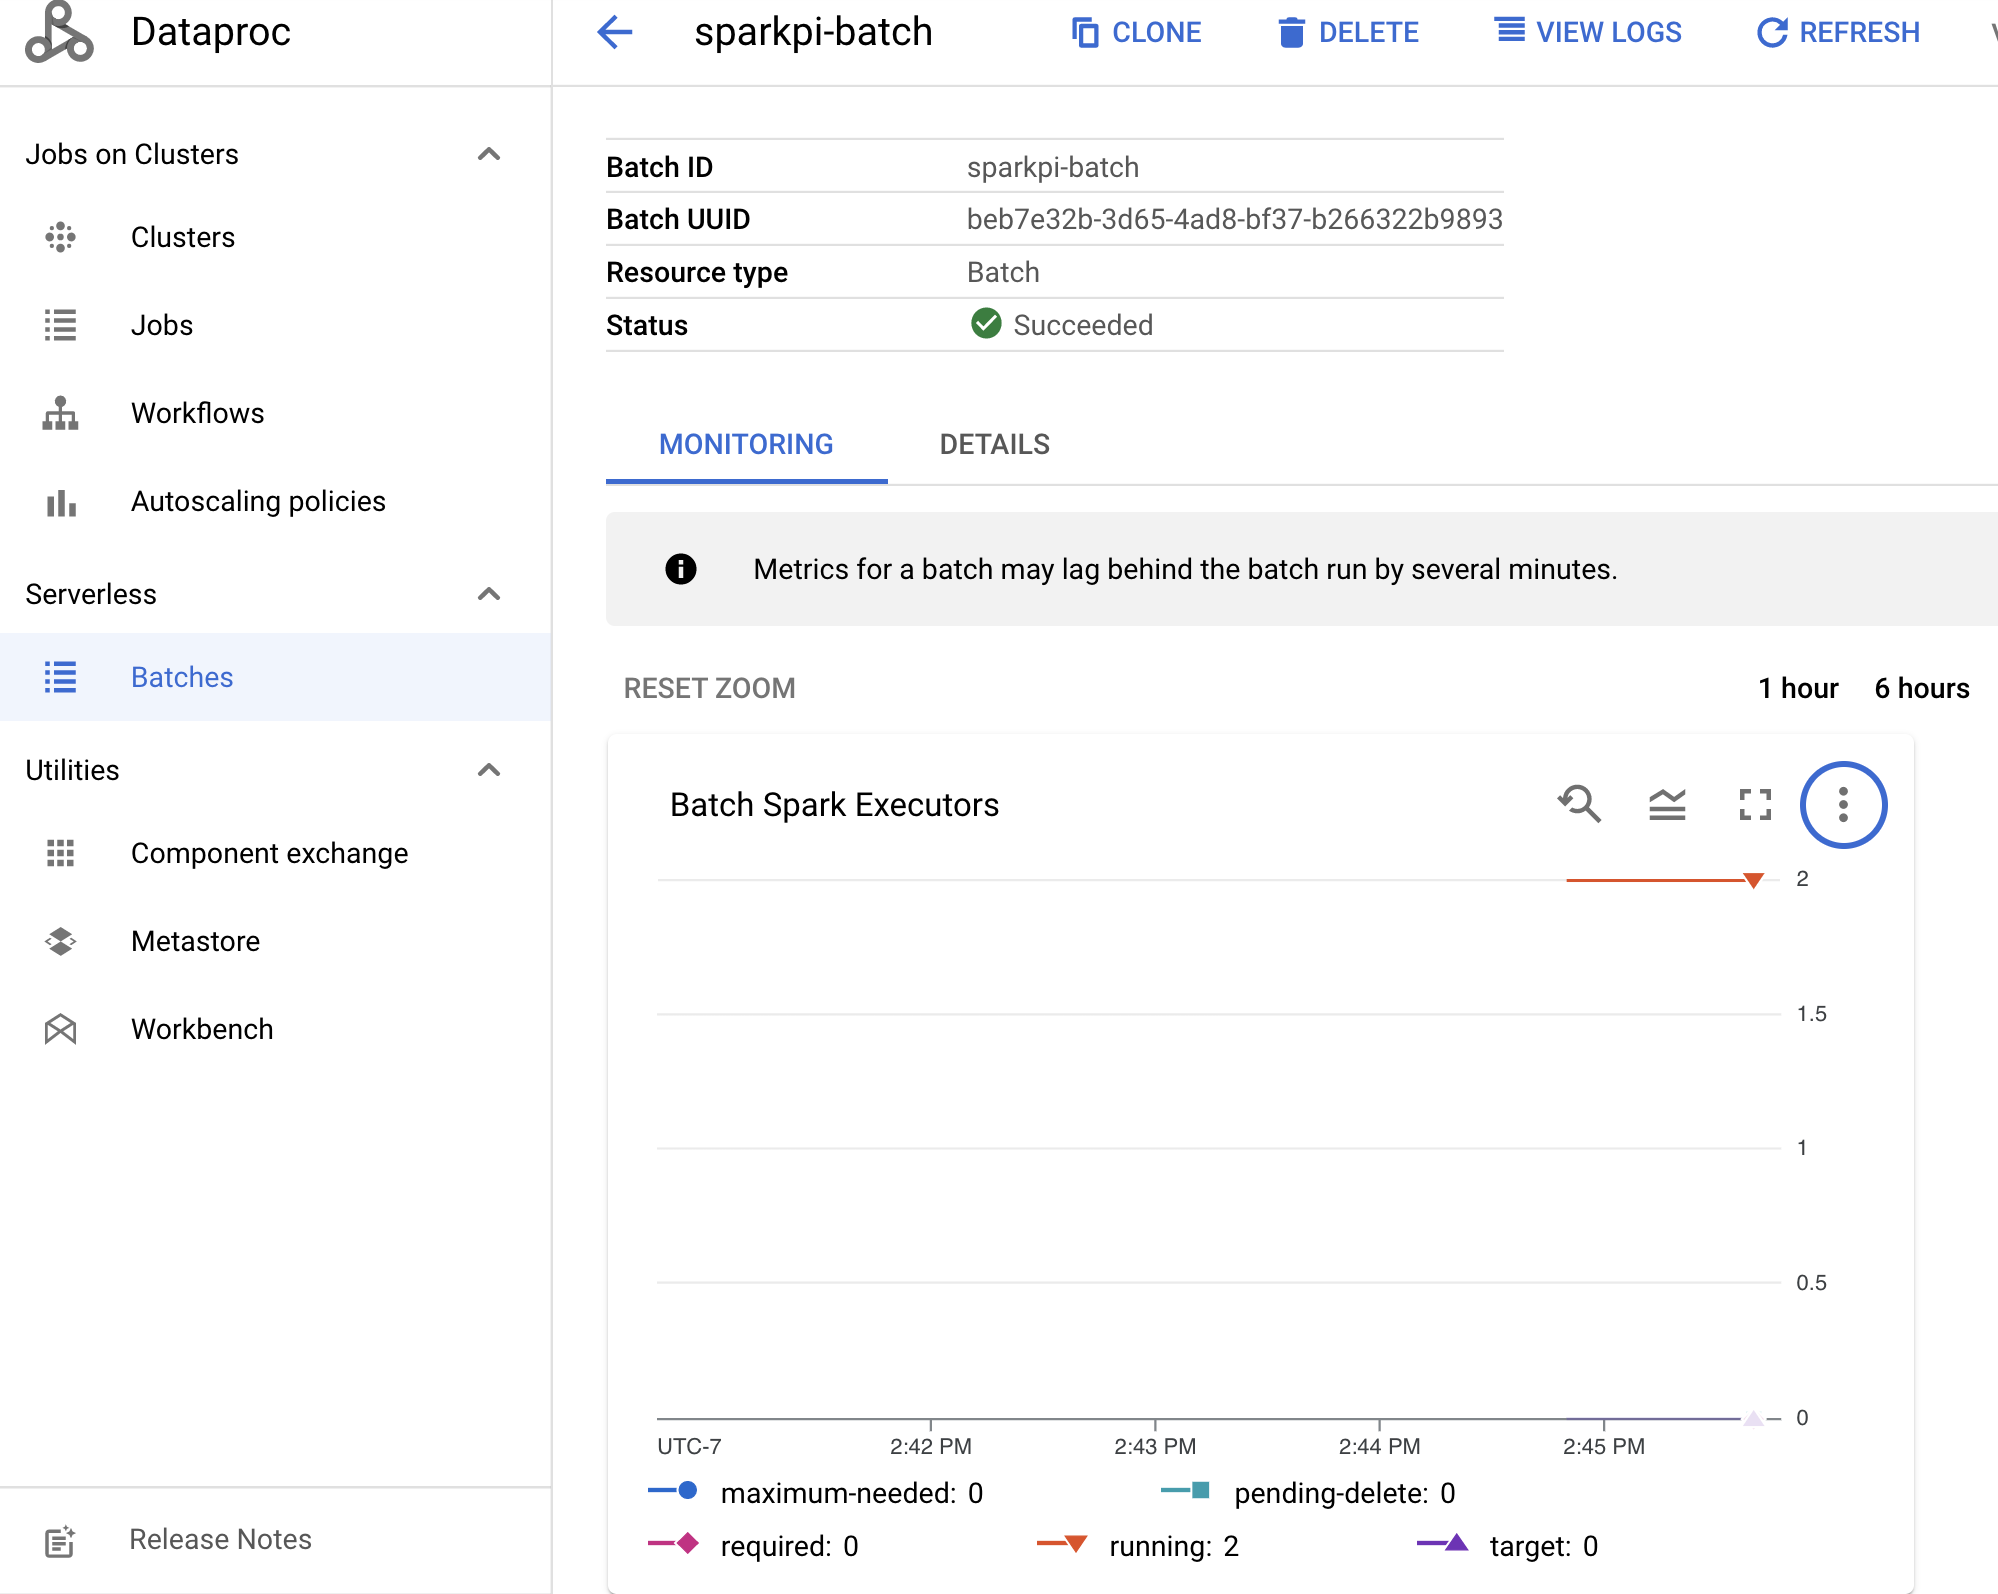
To view Batch metrics, click a batch ID on the Dataproc Batches page in the Google Cloud console to open the batch Details page, which displays a metrics graph for the batch workload under the Monitoring tab.

See Dataproc Cloud Monitoring for additional information on how to view collected metrics.
