借助 Cloud Code for VS Code,您可以使用 skaffold debug 轻松调试已部署到 Cloud Run 的应用。如需详细了解 Skaffold 调试,请参阅使用 Skaffold 进行调试。
您无需完成手动设置,例如设置端口转发或注入特定语言的调试参数。如需进行调试,您需要一个支持 Cloud Code 的 Cloud Run 应用,其中包含 skaffold.yaml 配置文件和类型为 cloudcode.cloudrun 的 launch.json 文件。
调试 Cloud Run 服务
如需调试您的服务,请按以下步骤操作:
如需运行服务并将调试程序会话连接到该服务,请打开 Command Palette(按
Ctrl/Cmd+Shift+P或点击 View > Command Palette),然后运行 Debug on Cloud Run Emulator 命令。在“在 Cloud Run 模拟器上运行/调试”(Run/Debug on Cloud Run Emulator) 对话框中,为您的配置设置规范:
- 选择 Docker 或 Buildpack 作为构建器,然后指定您的 Dockerfile 或 Buildpack。
- (可选)如需指定 Dockerfile 目标或构建参数,请点击显示高级构建设置,然后指定目标或参数。
- (可选)如需指定自定义服务名称、容器映像网址、容器端口、要使用的服务身份、专用 CPU 数量或要分配给每个容器实例的内存量,请点击显示高级服务设置,然后指定值。
- (可选)如需指定任何环境变量,请依次点击显示高级服务设置和环境变量,然后指定值。
- (可选)如需指定 Cloud SQL 连接,请点击连接,然后每行指定一个连接。
- (可选)如需让 VS Code 在保存代码更改后重新建立调试会话,请选中自动重建并重新运行更改复选框。
如果要进一步自定义服务的运行方式,您可以直接修改
launch.json文件。如需开始调试您的服务,请点击调试。
如果系统提示,请验证您的凭据以在本地运行和调试应用。
对于服务中的每个可调试容器,确认或输入您要调试的程序所在的远程容器目录。
或者,您也可以按
ESC跳过对容器的调试。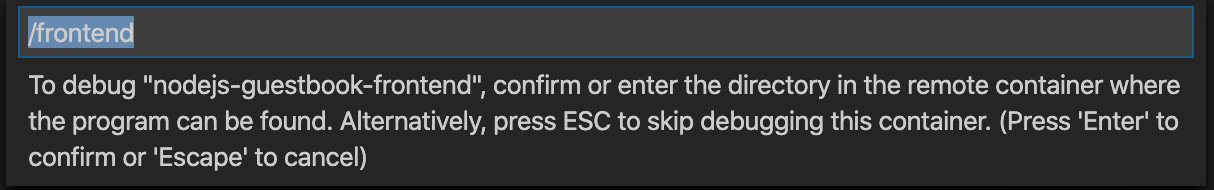
Cloud Code 会为服务中的每个可调试容器连接一个调试会话。
默认情况下,当您保存对应用的更改时,Cloud Code 会重新部署应用并设置新的调试会话。您可以使用项目的启动配置中的
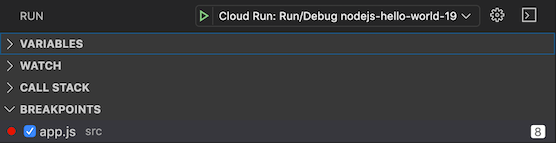
watch标志切换此功能。如需添加断点,请点击您要调试的文件的编辑器边距。
红色实心圆表示活跃断点,而灰色空心圆表示已停用的断点。
如需更精确地控制断点,您可以使用 VS Code 的“Debug”视图中的“Breakpoints”部分。
当您向服务发送新请求时,服务会在您指定的行处暂停。
会话结束后,右键点击即可使用以下命令:
- 查看日志:使用 Cloud Code 日志浏览器打开特定部署的应用日志
- 打开网址:在 Web 浏览器中打开特定服务的应用服务网址
如果您在启动配置中关闭了监视模式,并且您希望更改应用并重新构建和重新部署应用,请点击 Cloud Code 状态栏,然后点击开启监视模式。
如需停止部署,请点击当前部署的操作栏中的停止按钮。

排查容器构建问题
如果您收到 BUILD_DOCKER_UNKNOWN 错误代码,则表示 Docker 存在问题。如需解决此问题,请执行以下一项或多项任务:
重启 Docker,然后再次尝试构建容器。
如果您在重启后仍收到相同的错误,则表示 Docker 可能已耗尽磁盘空间。如需详细了解如何清理 Docker 中的未使用对象,请参阅修剪未使用的 Docker 对象。
尝试使用 Docker 的磁盘使用情况扩展程序来帮助回收空间。
配置详情
Cloud Code 会处理以下特定于语言的配置详细信息:
Node.js
重写要调用的入口点:
node --inspect=localhost:9229
Python
使用 Init 容器安装 ptvsd 模块并重写要调用的入口点:
python -m ptvsd --host localhost --port 5678
Go
使用 init 容器安装 dlv 调试程序并重写入口点,以便启动的调试会话仅使用调试服务器运行(在无头模式下),在启动时继续调试的进程,接受多个客户端连接,并侦听 localhost:56268:
dlv exec --headless --continue --accept-multiclient --listen=localhost:56268 --api-version=2, <app> --
Java
使用适当的 Java 调试连接协议 (JDWP) 配置添加环境 JAVA_TOOLS_OPTIONS,以便 JDWP 调试代理在端口 5005 上侦听套接字连接,并允许虚拟机在连接调试程序之前开始执行:
jdwp=transport=dt_socket,server=y,suspend=n,address=5005,quiet=y
.NET
.NET Core 应用配置为与适用于 VS Code 的 vsdbg 一起部署。
如果您在自动配置时遇到问题,请参阅详细的调试程序配置和设置,了解如何排查问题。