本页面简要介绍了 Cloud Code 中的 Kubernetes 开发。
在 Cloud Code 中使用 Kubernetes Explorer
借助 Kubernetes Explorer,您可以直接从 IDE 中访问集群、节点、工作负载等相关信息。您还可以使用 Kubernetes Explorer设置当前上下文,流式传输和查看日志,打开交互式终端,以及查找资源说明。

Cloud Code 使用位于 MacOS/Linux 上的 $HOME/.kube 目录或 Windows 上的 %USERPROFILE%\.kube 目录下的默认 kubeconfig 文件来检索 Kubernetes 资源。您可以在 Kubernetes Explorer 中切换或添加新的 Kubeconfig 文件。Kubeconfig 文件是包含 Kubernetes 集群详细信息、证书和用于对集群进行身份验证的 Secret 令牌的 YAML 文件。
如需使用默认 kubeconfig 以外的 kubeconfig 文件,请参阅使用 kubeconfig 文件指南。
访问 Kubernetes Explorer
如需查看和管理 Kubernetes 资源,请点击访问“开发会话”部分
您可以使用开发会话运行或调试 Kubernetes 应用,或使用模板创建示例应用。
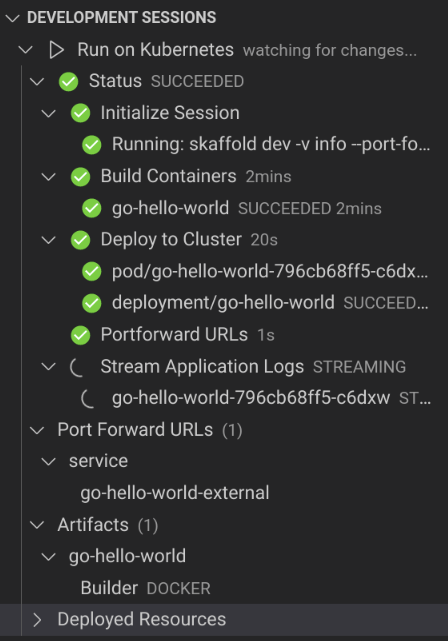
在您启动开发或调试会话后,开发会话部分会显示结构化日志记录视图。
基本操作
Kubernetes Explorer 由 kubectl 提供支持。只要您已将 kubectl 配置文件配置为访问您的集群,就可以使用 Kubernetes Explorer 添加集群,浏览您的集群的所有可用命名空间、资源和节点,无论它们处于活跃上下文还是非活跃上下文中。
“集群”部分
可以在 Kubernetes Explorer 的 Clusters(集群)部分通过图标访问以下一般 Kubernetes 操作:
- add 将集群添加到 KubeConfig
- 刷新 Kubernetes Explorer
- question_mark 在网络浏览器中打开 Cloud Code Kubernetes 文档
“开发会话”部分
可以在 Kubernetes 开发会话部分中通过图标访问以下 Kubernetes 操作:
 打开 Kubernetes 示例应用
- play_arrow 运行您的应用
 调试应用
调试应用
复制资源名称
您可以将任何 Kubernetes 资源名称(包括容器和集群名称)复制到剪贴板。如需复制资源名称,请右键点击相应资源,然后选择复制资源名称。

刷新资源
Kubernetes Explorer 会监控更改并自动刷新以反映更新。如需强制刷新任何 Kubernetes 资源以获取其最新信息,请右键点击该资源并选择刷新。
 您还可以使用 Clusters 部分的刷新按钮强制刷新整个 Kubernetes Explorer 的 Clusters 部分。

描述资源
如需显示任何非集群资源的详细信息,请右键点击该资源,然后选择描述。系统会打开一个终端并显示资源信息。
自定义启动配置
如需配置应用的运行方式,您可以自定义 skaffold.yaml 文件。
查看远程 YAML
如需查看集群中某一资源的 YAML,请选择该资源或将光标悬停在该资源上,以显示
查看日志
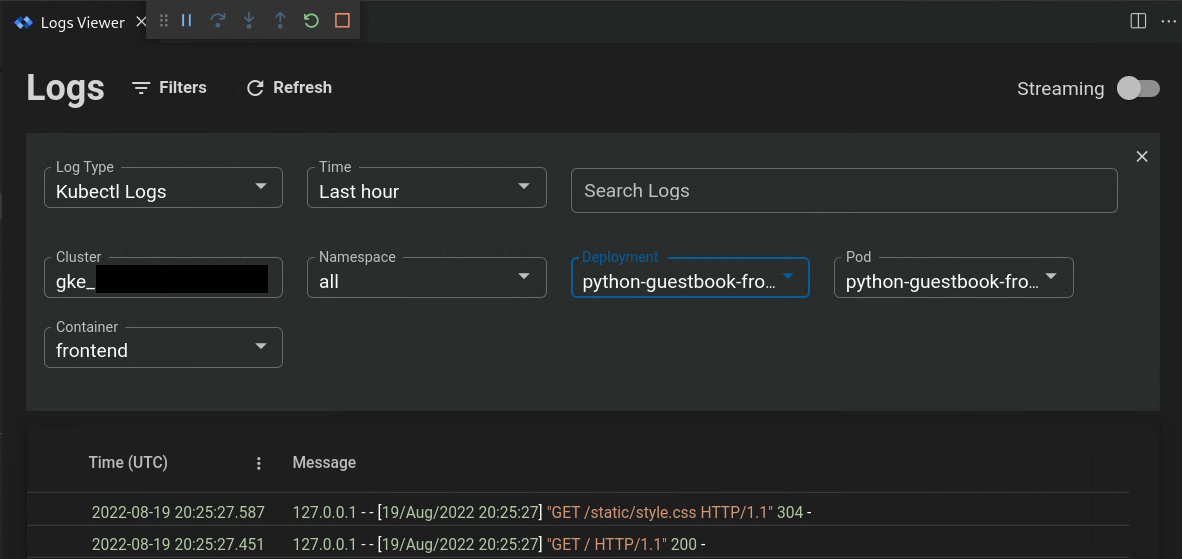
您可以将 Kubernetes 资源的日志流式传输到 Kubernetes Explorer 控制台并进行查看,以监控其进度。
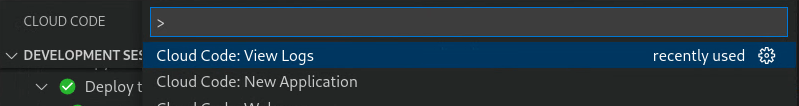
如需打开日志查看器,请按Ctrl/Cmd+Shift+P 或点击 View > Command Palette 打开 Command Palette,然后选择 Cloud Code: View Logs。
日志查看器会在新编辑器标签页中打开。
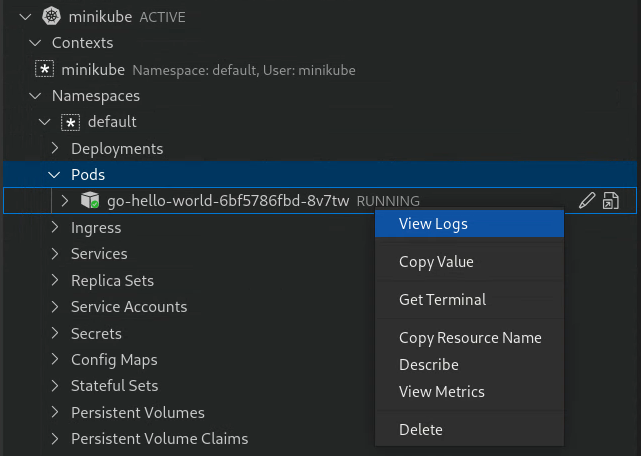
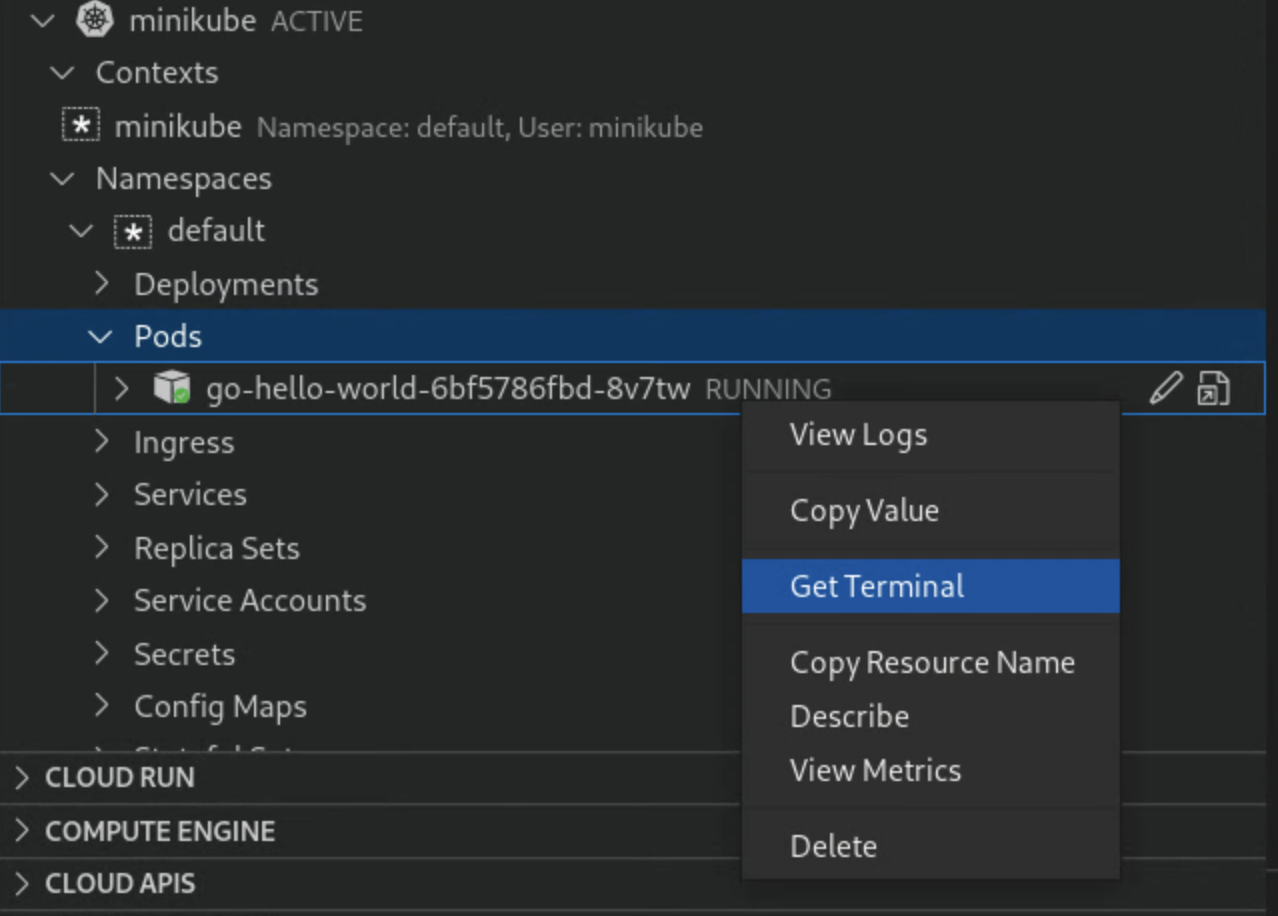
 如需查看 Pod 或容器的日志,请右键点击相应资源,然后选择查看日志。
启动终端
对于 pod 和容器,您可以右键点击 pod 或容器,然后选择获取终端以打开交互式终端。
特定于资源的操作
Kubernetes Explorer 显示集群、命名空间、节点、工作负载(例如 Deployment、副本集、pod 和容器)、Service 和 Ingress、配置(例如 Secret 和 ConfigMap)以及存储(例如卷)。使用 Kubernetes Explorer,您可以对其中一些资源执行独特的操作。
集群
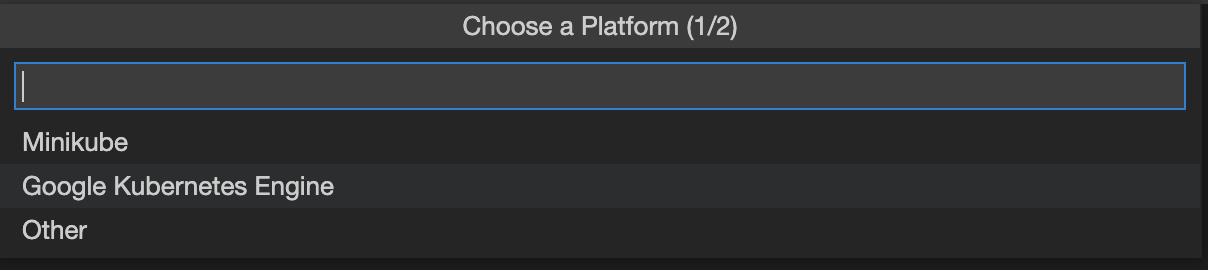
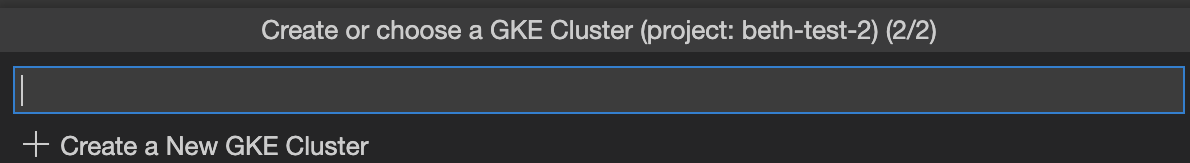
- 向 Kubeconfig 添加集群:添加现有的 GKE 或 minikube 集群,或创建新的集群。
系统随即会显示“添加集群”对话框,您可以在其中选择要使用的项目和集群,或创建新集群。
设置为活跃集群:将指定集群设置为活跃状态,以使配置的
kubectl上下文默认访问此集群。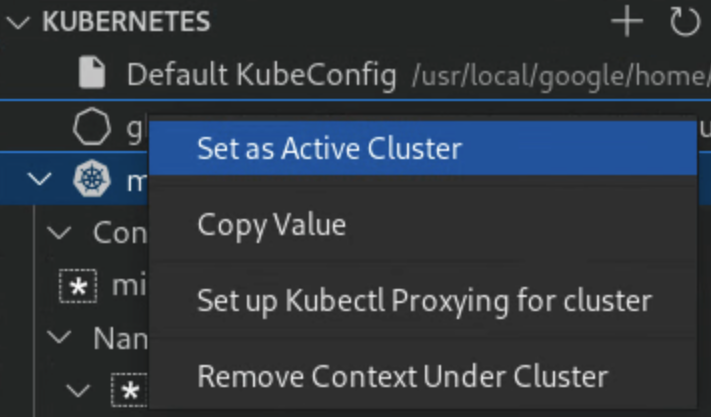
Kubernetes Explorer 会自动刷新,并且您将在相应集群旁边看到 Kubernetes 符号。
如果集群配置了多个上下文,则您可以选择其中一个可用上下文,将其设置为当前上下文。
命名空间
设置为活跃命名空间:将某一命名空间设置为活跃状态,以使配置的
kubectl上下文默认访问此命名空间。右键点击要设置为活跃状态的命名空间。
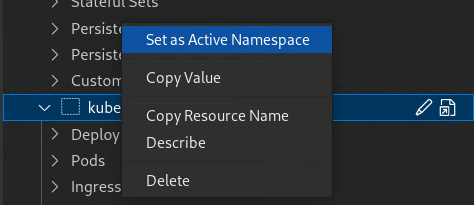
请注意,Kubernetes 上下文是一种快捷方式,可让您快速访问集群中的某个命名空间。系统通常会在您启动 minikube 或 GKE 集群时自动创建上下文。如果您没有看到给定命名空间的设置为当前上下文选项,并且您想为其创建上下文,请在终端中使用 kubectl config set-context 命令设置上下文,其中包含您首选的集群、用户和命名空间。
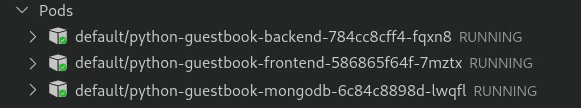
pod
- 查看日志:将 pod 的日志导入 Kubernetes Explorer Console。
获取终端:在 Kubernetes Explorer Console 中为 pod 获取终端。
此外,运行中 pod 的标签旁边会显示彩色状态标记:
- 红色:表示 pod 处于失败状态
- 黄色:表示 pod 正在启动或终止
- 绿色:表示 pod 运行状况良好且正在运行
容器
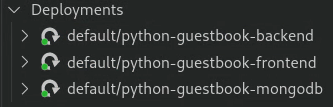
部署
查看日志:将 Deployment 的日志查看到 Kubernetes Explorer 控制台中。
实时部署的标签和当前副本数/副本总数旁边带有彩色状态标记:
- 黄色:表示 Deployment 无最低可用性或存在映像问题。
- 绿色:表示 Deployment 运行状况良好且具有最低可用性。
节点
集群节点的名称旁边会显示彩色状态标记:
- 黄色:表示节点存在资源问题,例如内存或磁盘可用性。
- 绿色:表示节点运行状况良好。
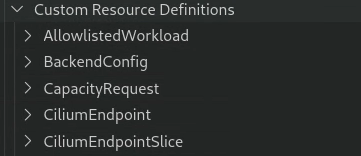
自定义资源定义 (CRD)
Kubernetes Explorer 列出了您的集群上安装和可用的所有自定义资源定义 (CRD):
后续步骤
- 通过根据代码示例创建和部署 Kubernetes 应用,开始使用 Cloud Shell 专用 Cloud Code for Kubernetes。
- 使用文件同步和热重载加快开发速度。
- 在 Cloud Code 中调试应用