This page provides an overview of Kubernetes development in Cloud Code.
Use the Kubernetes Explorer in Cloud Code
The Kubernetes Explorer lets you access information about your clusters, nodes, workloads, and more, right from your IDE. You can also set a current context, stream and view logs, open an interactive terminal, and look up resource descriptions with the Kubernetes Explorer.
Cloud Code uses the default kubeconfig file, located under
the $HOME/.kube directory on MacOS/Linux or %USERPROFILE%\.kube on Windows,
for retrieving Kubernetes resources. You can switch or add new Kubeconfig files
from within the Kubernetes Explorer. Kubeconfig files are YAML files
containing your Kubernetes cluster details, certificate, and secret token for
authenticating to the cluster.
To use a kubeconfig file other than the default kubeconfig, refer to the Work with kubeconfig files guide.
Access the Kubernetes Explorer
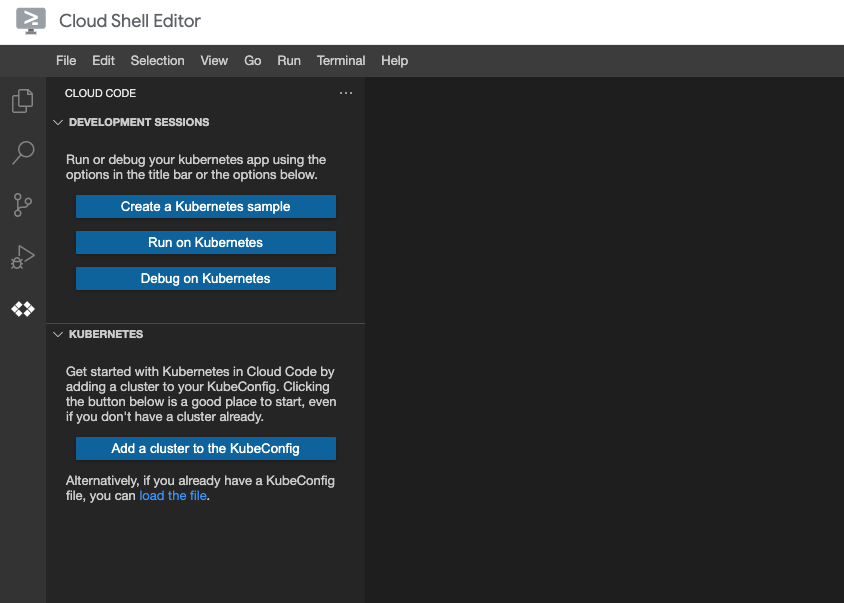
To view and manage your Kubernetes resources, access the Kubernetes Explorer by clickingAccess the Development sessions section
Use the Development sessions to run or debug your Kubernetes application or create a sample application using a template.
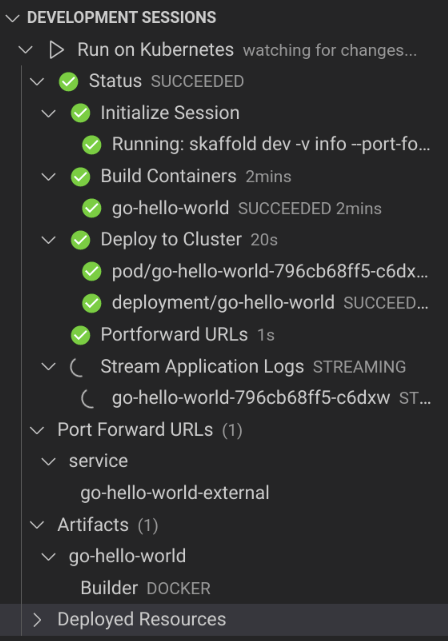
When you start a development or debugging session, the Development sessions section displays the structured logging view.
Basic actions
The Kubernetes Explorer is powered by kubectl. As long as you've
configured your kubectl config file to access your clusters, you can use the
Kubernetes Explorer to add clusters, browse all your available
namespaces, resources, and nodes for your clusters, regardless of them being in
the active or inactive context.
Clusters section
The available general Kubernetes actions, accessible through their icons in the Kubernetes Explorer Clusters section, are:
- add Add a cluster to the KubeConfig
- refresh Refresh the Kubernetes Explorer
- question_mark Open the Cloud Code Kubernetes documentation in a web browser
Development sessions section
The available Kubernetes actions, accessible through their icons in the Kubernetes Development sessions section, are:
 Open a Kubernetes sample application
- play_arrow Run your application
 Debug your
application
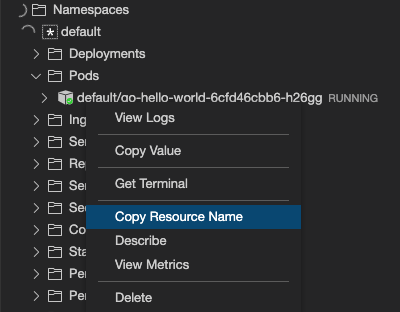
Copy a resource name
You can copy any Kubernetes resource name to the clipboard (including container and cluster names). To copy a resource name, right-click on the resource and choose Copy resource name.
Refresh resources
The Kubernetes Explorer watches for changes and automatically refreshes to reflect updates. To force a refresh of any Kubernetes resource to fetch its latest information, right-click the resource and choose Refresh.
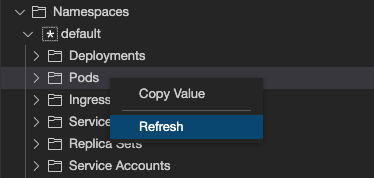 You can also force a refresh of the entire Kubernetes Explorer
Clusters section using the Clusters section's refresh button.

Describe resources
To display the details of any non-cluster resource, right-click the resource, then select Describe. A terminal opens and displays the resource information.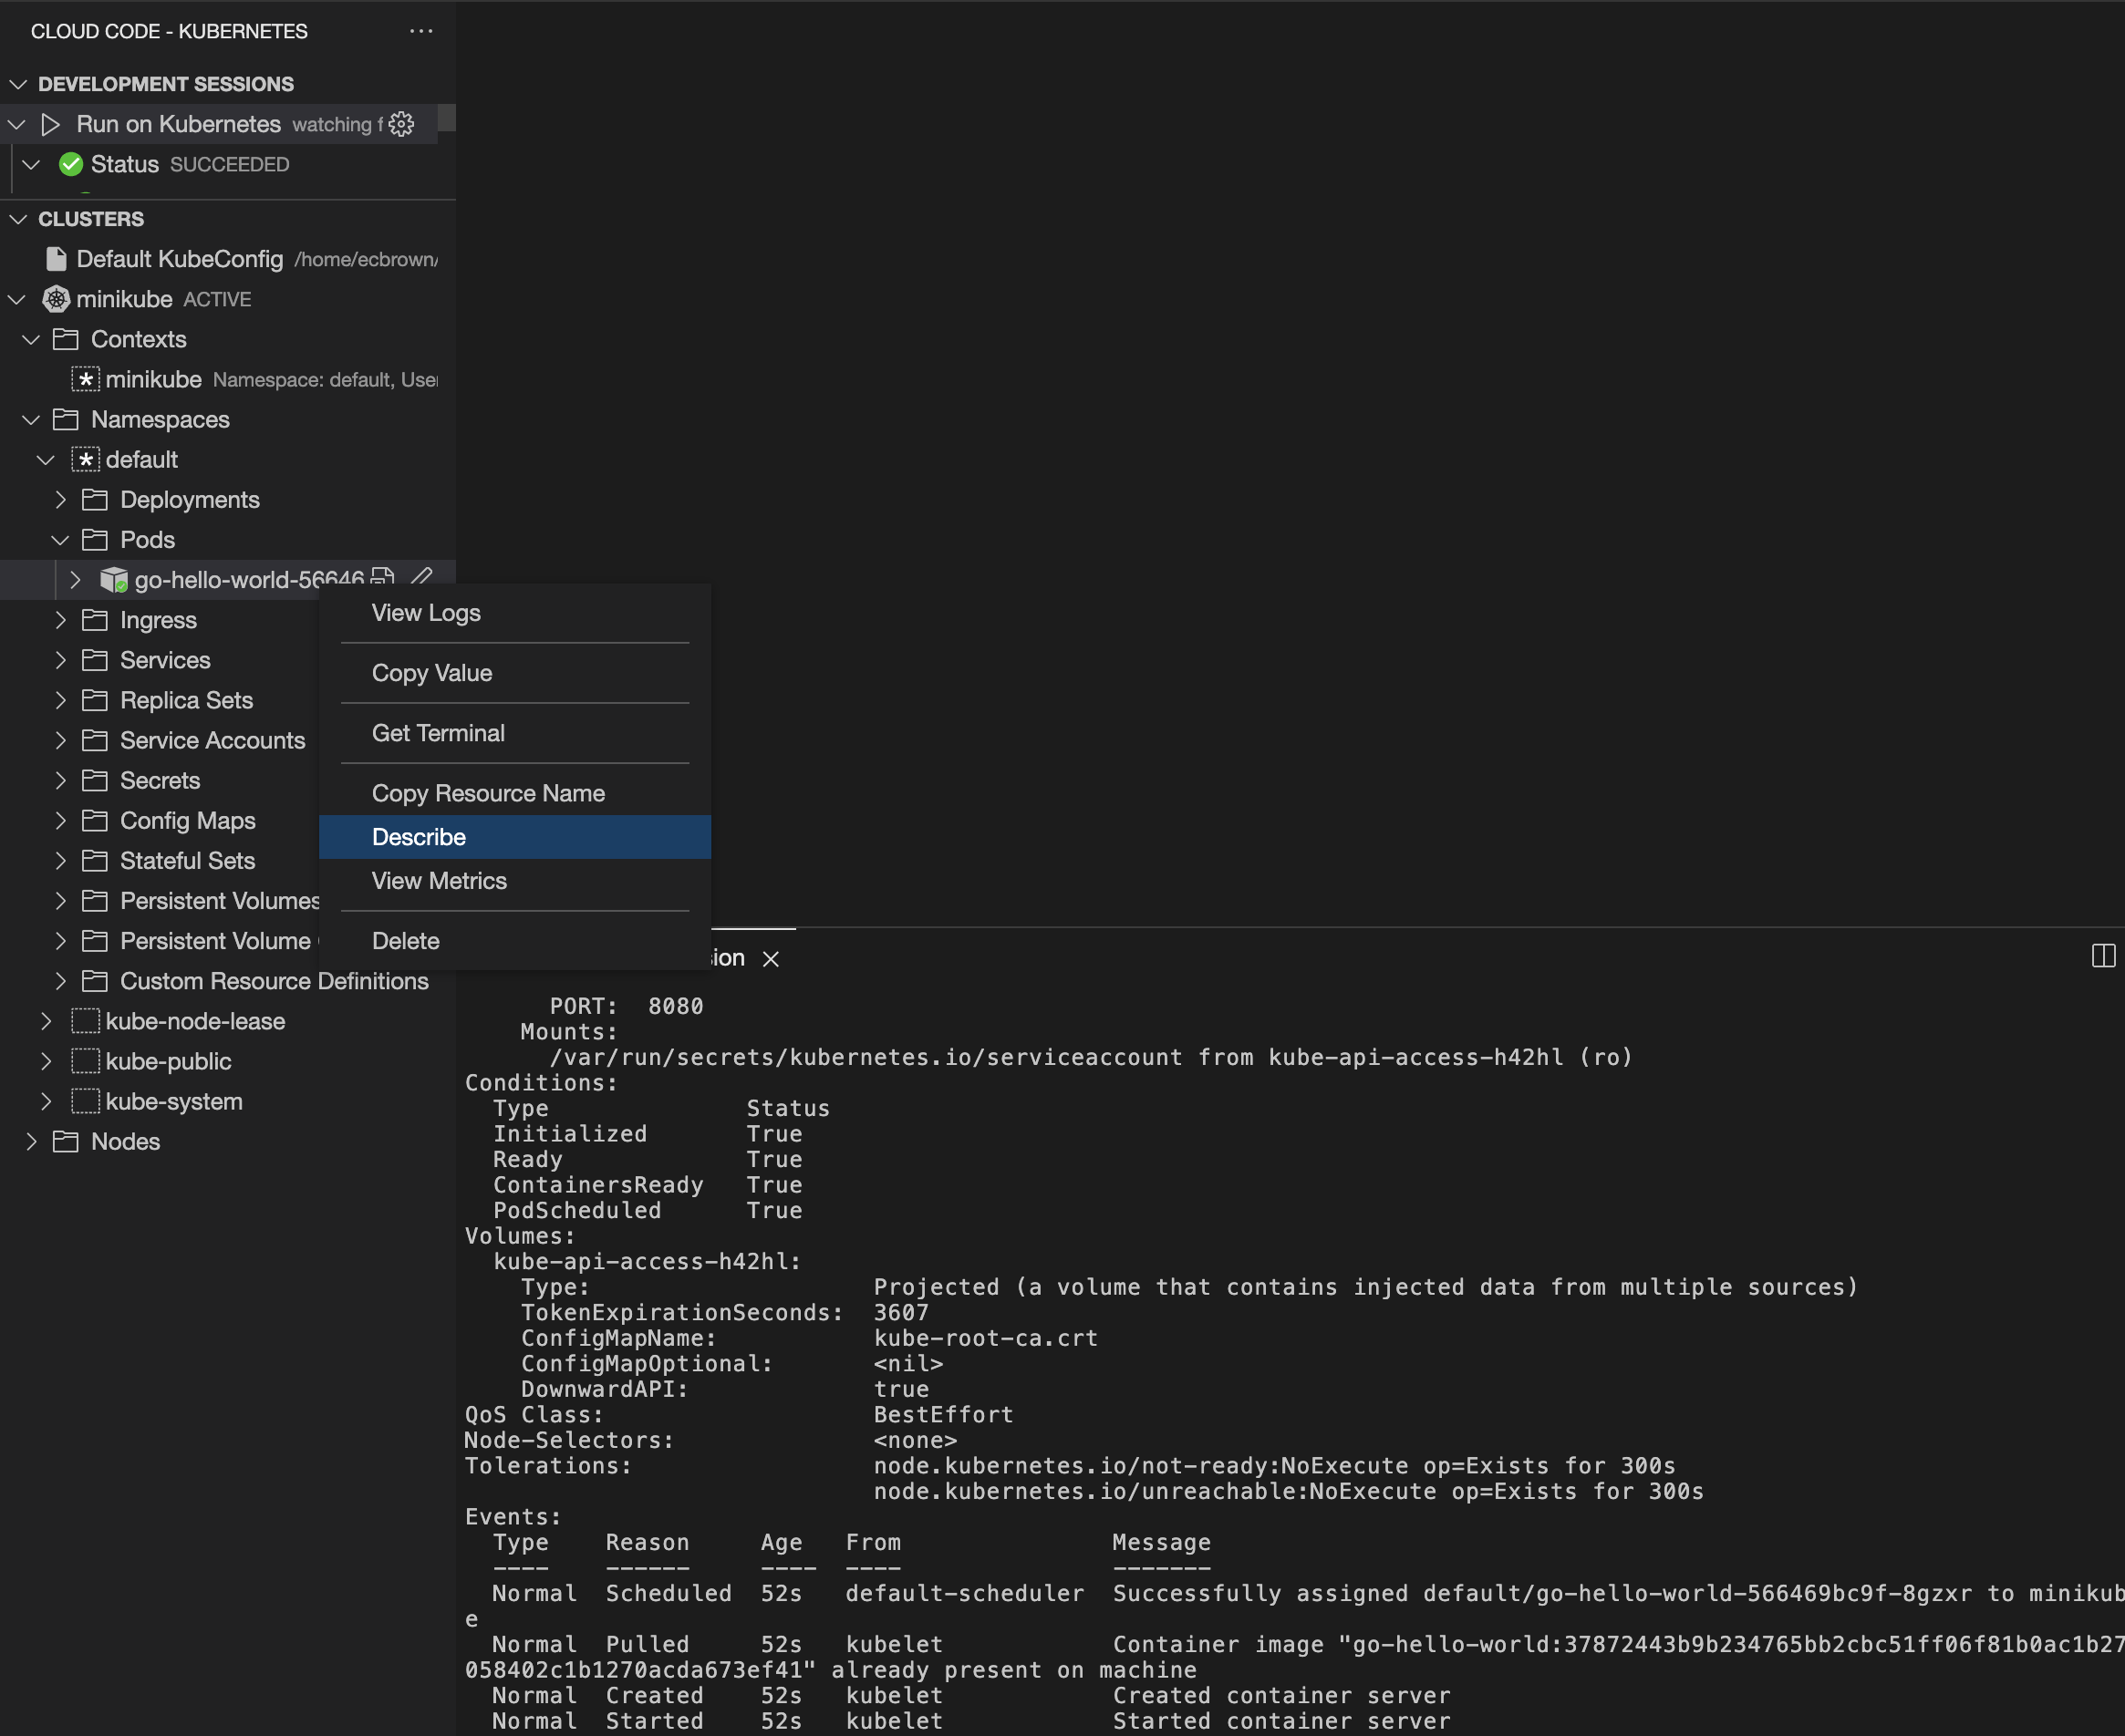
Customize your launch configuration
To configure how your application is run, you can customize your
skaffold.yaml file.
View remote YAML
To view the YAML of a resource in your cluster, select or hover over the resource to show the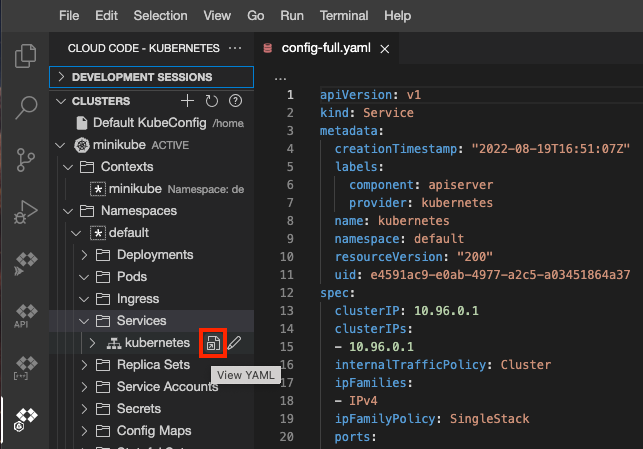
View logs
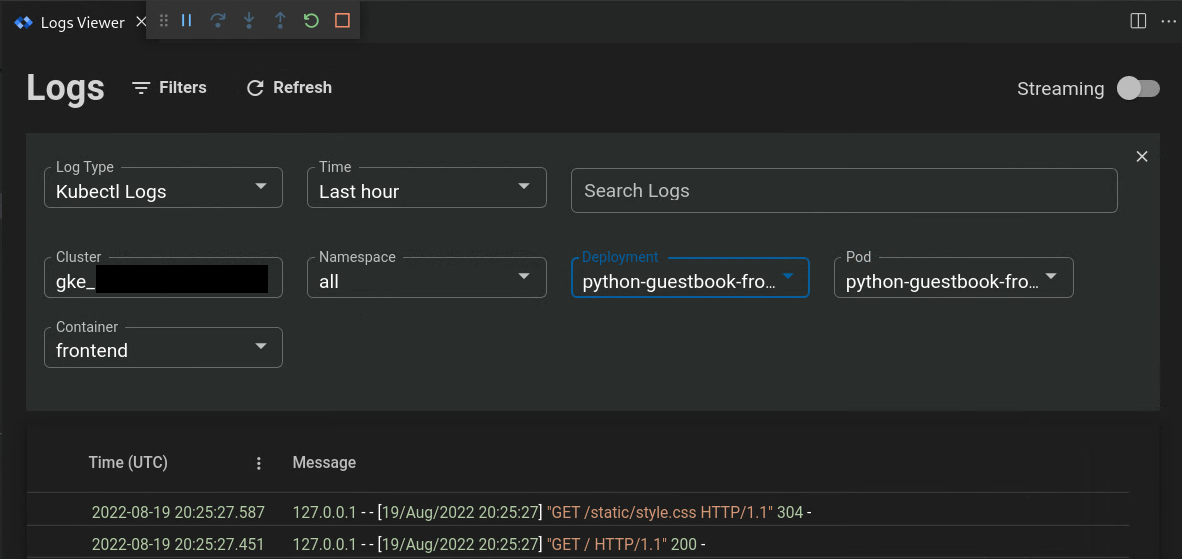
You can stream and view logs from Kubernetes resources into the Kubernetes Explorer console to monitor their progress.
To open the logs viewer, open the command palette by pressingCtrl/Cmd+Shift+P or clicking View > Command Palette then select
Cloud Code: View Logs.

The logs viewer opens in a new editor tab.
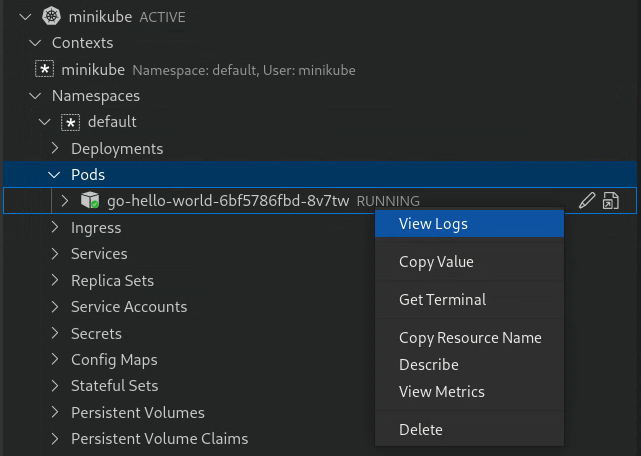
 To view logs for a pod or container, right click on the resource and select
View logs.
Launch a terminal
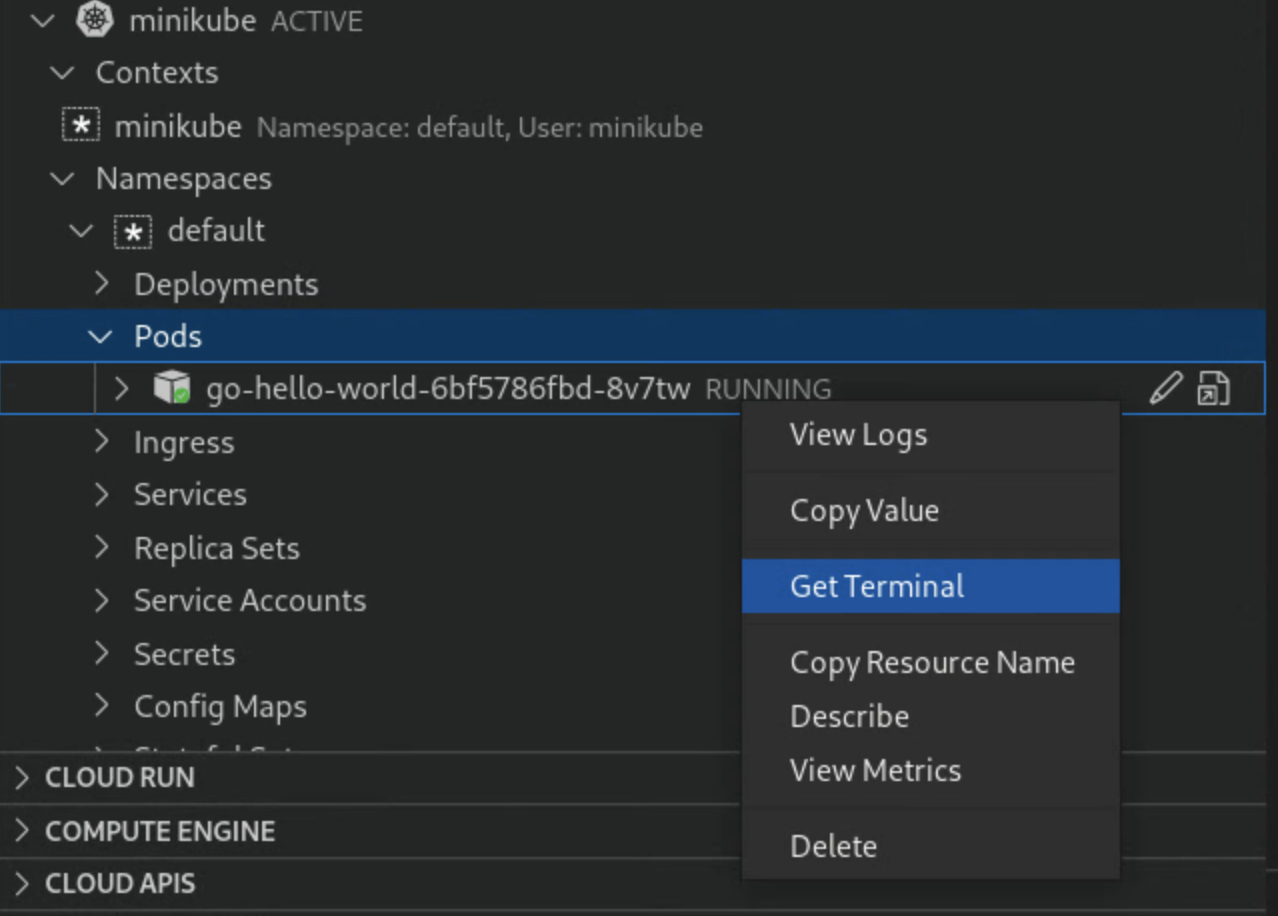
For pods and containers, you can open an interactive terminal by right-clicking the pod or container and selecting Get terminal.
Resource-specific actions
The Kubernetes Explorer displays clusters, namespaces, nodes, workloads (such as deployments, replicasets, pods and containers), services and ingresses, configurations (such as secrets and config maps) and storage (such as volumes). Using the Kubernetes Explorer, you can perform unique actions on some of these resources.
Clusters
- Add a cluster to the Kubeconfig: Add an existing GKE or minikube cluster or create a new one.
The Add Cluster dialog appears and you can choose the project and cluster you'd like to use or create a new cluster.


Set as active cluster: Set the specified cluster as active such that your configured
kubectlcontext accesses this cluster by default.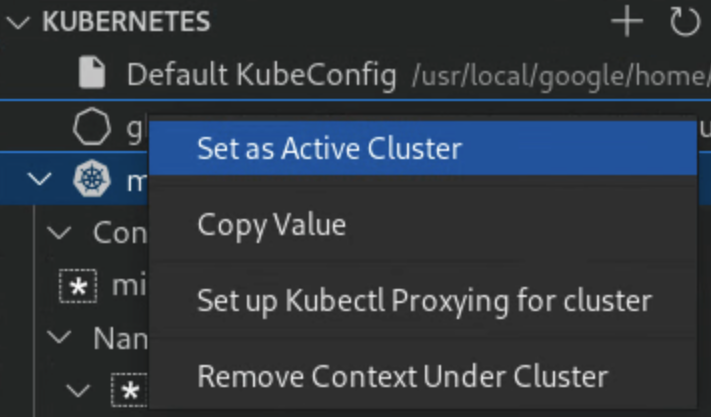
The Kubernetes Explorer refreshes automatically and you'll see the Kubernetes symbol next to the appropriate cluster.
If a cluster has multiple contexts configured, you'll be able to choose one of the available contexts to set as the current context.
Namespaces
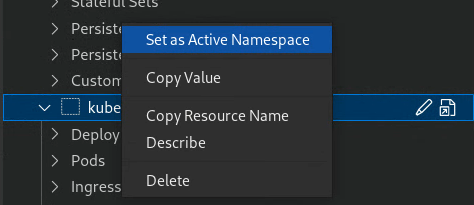
Set as active namespace: Set a namespace as active such that your configured
kubectlcontext accesses this namespace by default.Right-click the namespace you want to set as active.
Note that a Kubernetes context is a shortcut which gives you quick access
to a namespace in your cluster. Contexts are normally created
automatically when you start a minikube or GKE cluster. If you don't see
the Set as current context option for a given namespace and you'd
like to create a context for it, use the
kubectl config set-context command
in your terminal to set a context with your preferred cluster, user, and
namespace.
Pods
- View Logs: View logs from a pod into the Kubernetes Explorer Console.
Get Terminal: Get terminal for a pod in the Kubernetes Explorer Console.
Additionally, running pods have colored status marks next to their labels:
- Red: Pod is in a failed state
- Yellow: Pod is starting or terminating
- Green: Pod is healthy and running

Containers
- View logs: View logs from a container into the Kubernetes Explorer console.
- Get Terminal: Get terminal for a container in the Kubernetes Explorer console.
Deployments
View logs: View logs from a deployment into the Kubernetes Explorer console.
Live deployments have colored status marks next to their labels and counts of current/total replicas:
- Yellow: Deployment does not have minimum availability or have image problems.
- Green: Deployment is healthy and had minimum availability.

Nodes
Nodes of your cluster have colored status marks next to their names:
- Yellow: Node has a resource problem such as memory or disk availability.
- Green: Node is healthy.
Custom Resource Definitions (CRDs)
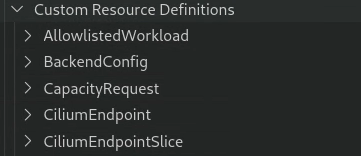
The Kubernetes Explorer lists all Custom Resource Definitions (CRDs) installed and available on your cluster:
What's next
- Get started with Cloud Code for Cloud Shell for Kubernetes by creating and deploying a Kubernetes application from a code sample.
- Use file sync and hot reloading to speed up development.
- Debug your application in Cloud Code
