This page provides an overview of Kubernetes development in Cloud Code.
Use the Kubernetes Explorer in Cloud Code
The Kubernetes Explorer lets you access information about your clusters, nodes, workloads, and more, right from your IDE. You can also set a current context, stream and view logs, open an interactive terminal, and look up resource descriptions with the Kubernetes Explorer.
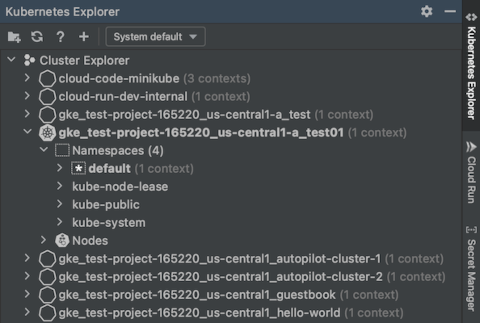
Cloud Code uses the default kubeconfig file, located under
the $HOME/.kube directory on MacOS/Linux or %USERPROFILE%\.kube on Windows,
for retrieving Kubernetes resources. You can switch or add new Kubeconfig files
from within the Kubernetes Explorer. Kubeconfig files are YAML files
containing your Kubernetes cluster details, certificate, and secret token for
authenticating to the cluster.
To use a kubeconfig file other than the default kubeconfig, refer to the Work with kubeconfig files guide.
Access the Kubernetes Explorer
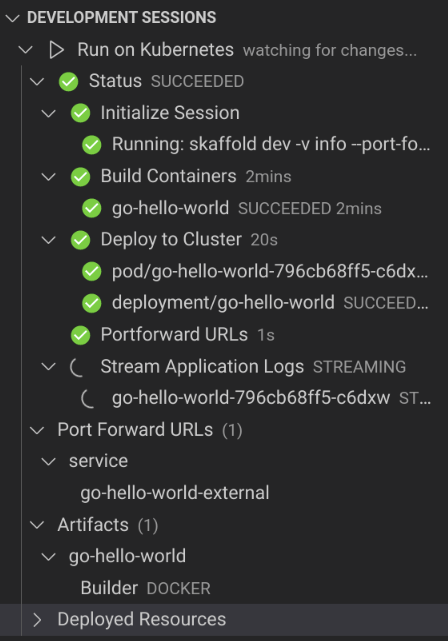
To view and manage your Kubernetes resources, use the Kubernetes Explorer, accessible from the side panel on the right. Alternatively, it can be accessed using Tools > Cloud Code > Kubernetes > View Cluster Explorer.When you start a development or debugging session, the Development sessions section displays the structured logging view.
Basic actions
The Kubernetes Explorer is powered by kubectl. As long as you've
configured your kubectl config file to access your clusters, you can use the
Kubernetes Explorer to add clusters, browse all your available
namespaces, resources, and nodes for your clusters, regardless of them being in
the active or inactive context.
The available general Kubernetes actions, accessible through their icons in the Kubernetes Explorer, are:
 Create a new Kubernetes application from a sample
 Refresh the Explorer
 Open the
Cloud Code Kubernetes documentation in a web browser
Additional common Kubernetes debugging actions, accessible through their icons in the Kubernetes Explorer, are:
 Run the
current Run/Debug configuration.
 Launch the
run configuration in debug mode.
 Stop an
active debugging session.
Copy a resource name
You can copy any Kubernetes resource name to the clipboard (including container and cluster names). To copy a resource name, right-click on the resource and choose Copy resource name.

Refresh resources
The Kubernetes Explorer watches for changes and automatically refreshes to reflect updates. To force a refresh of any Kubernetes resource to fetch its latest information, right-click the resource and choose Refresh.
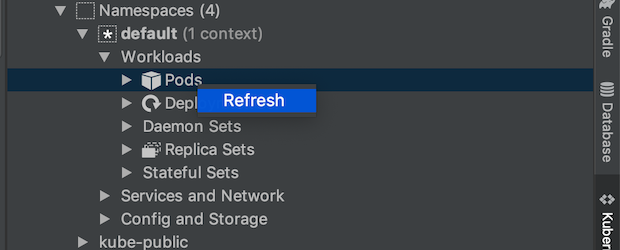 You can also force a refresh of the entire Kubernetes Explorer
using the Kubernetes Explorer's refresh button.

Describe resources
To display the details of any non-cluster resource, right-click the resource, then select Describe. The resource information is presented in the Kubernetes Explorer console panel.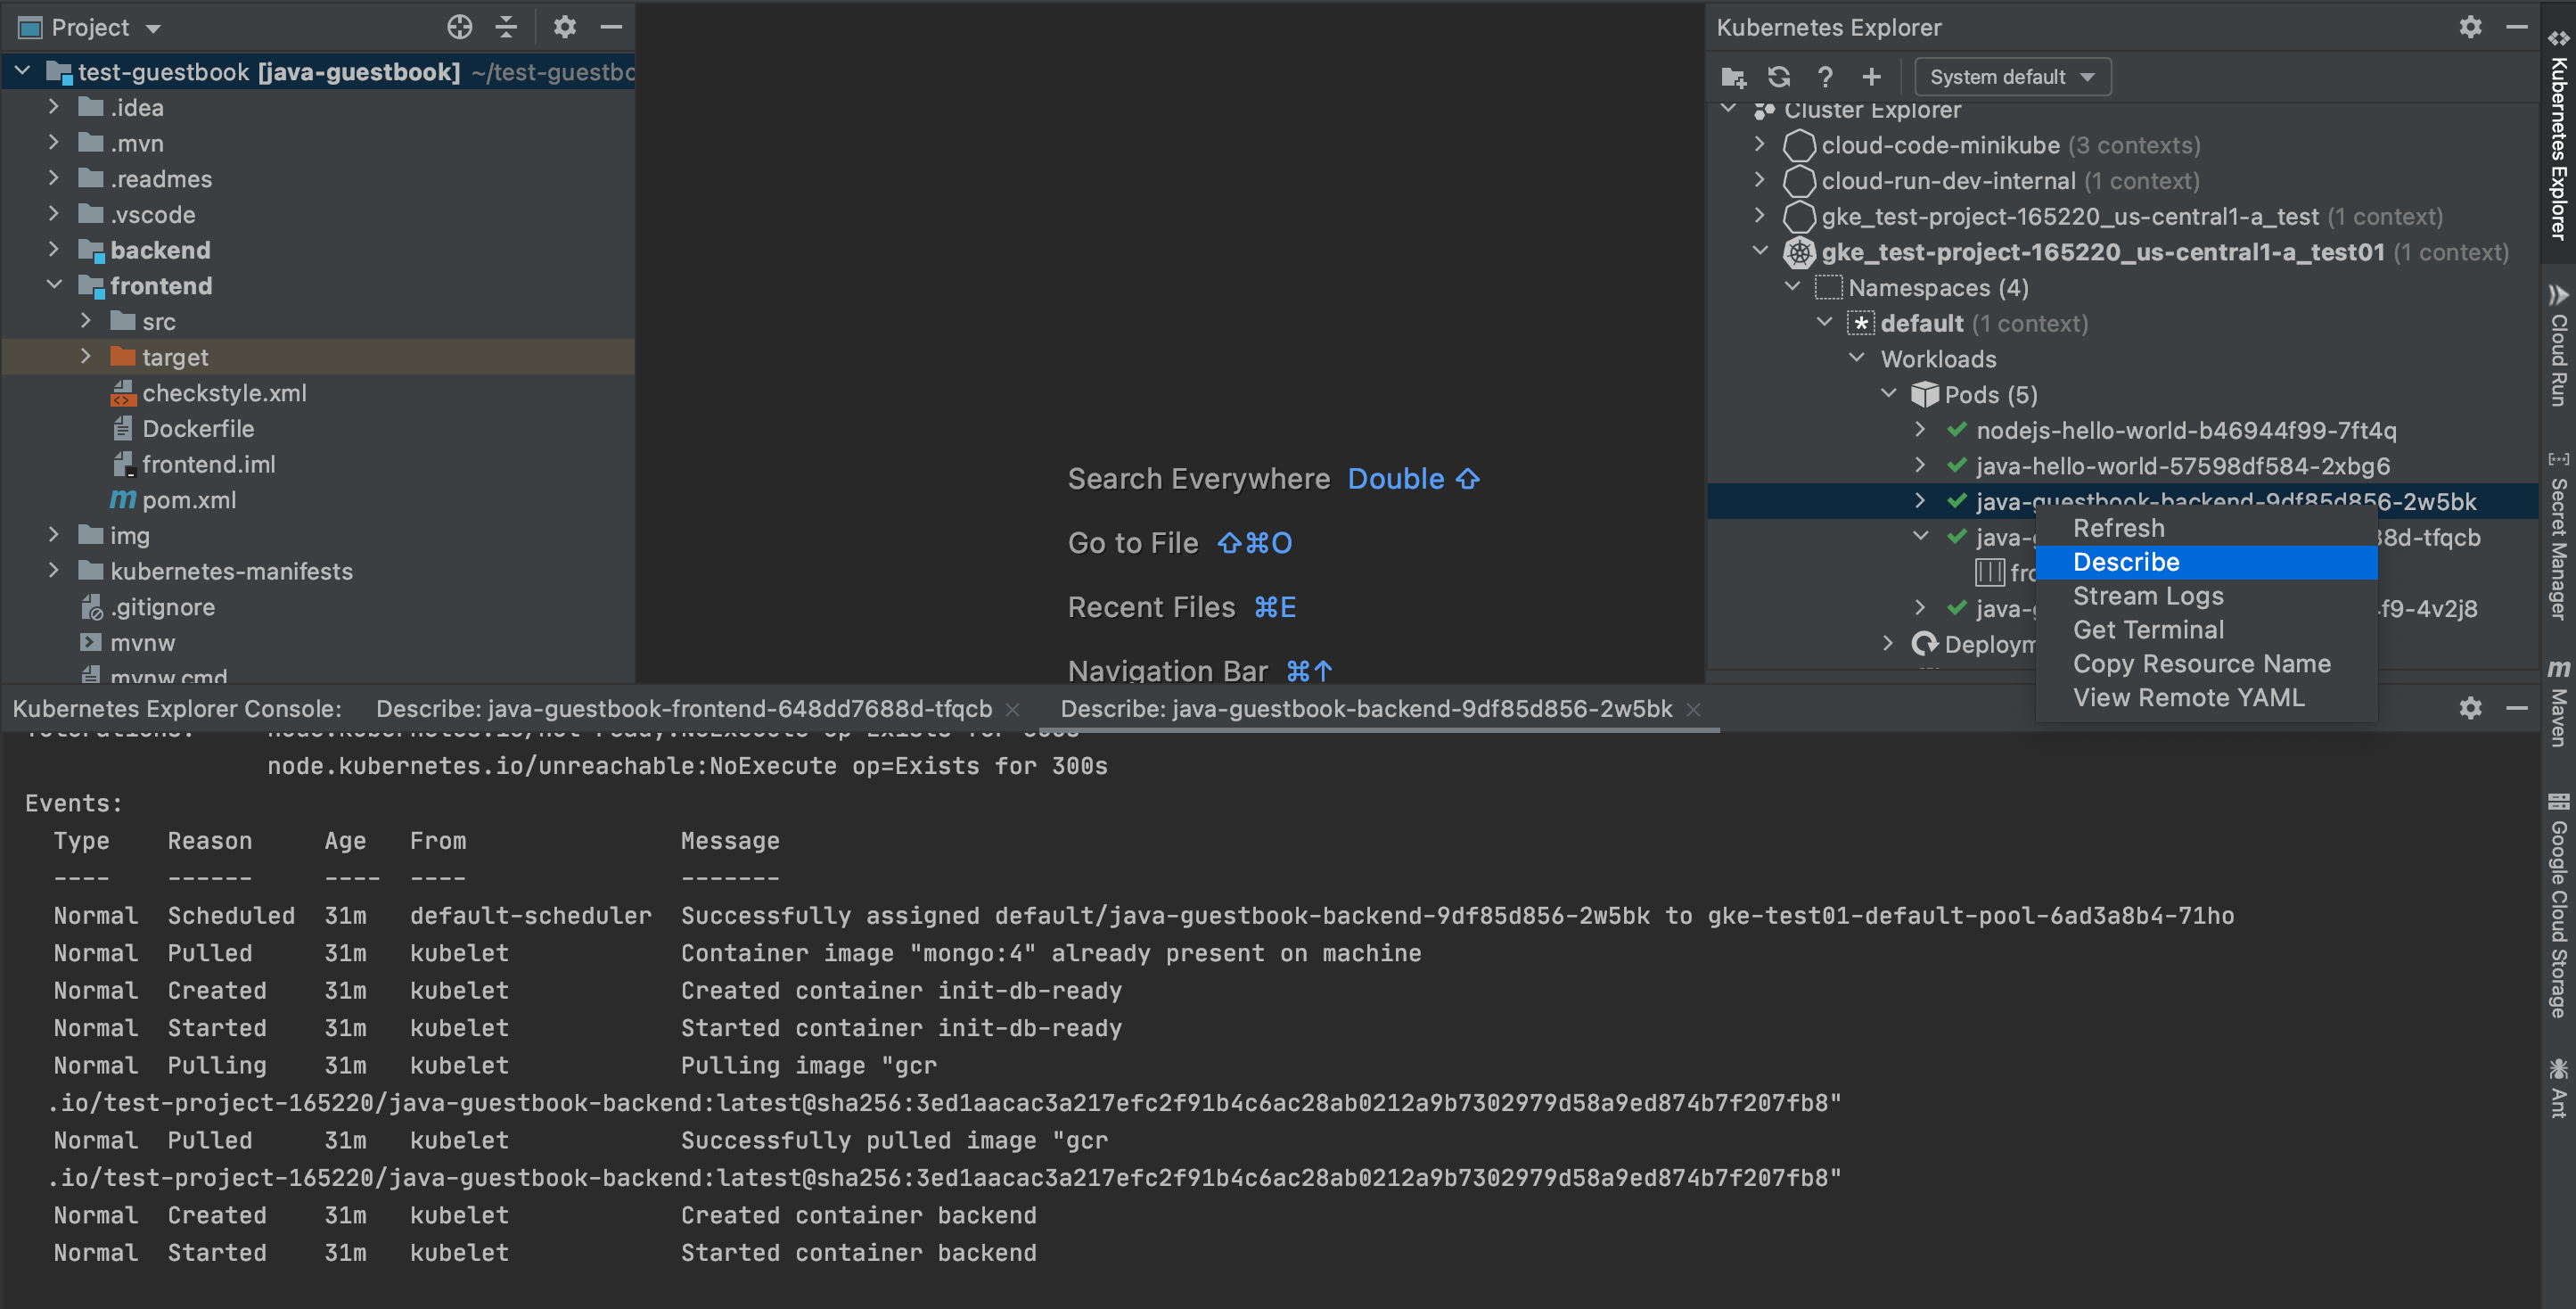
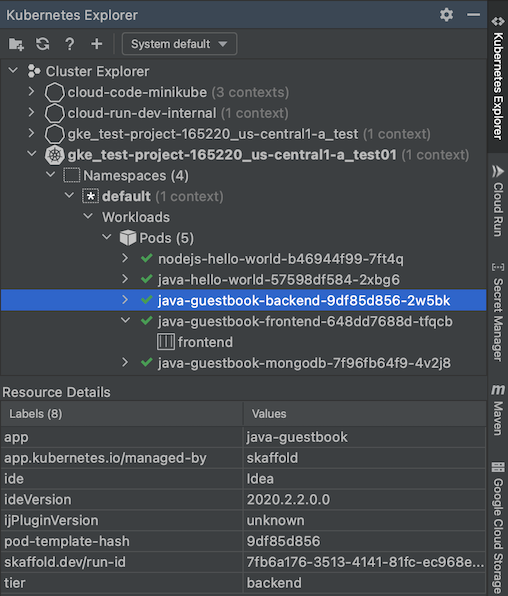
To view resource details, you can also click any resource. If it has attached metadata, the metadata is available in the Resource Details panel in the Kubernetes Explorer.
Skaffold options
- Skaffold configuration - selects a
skaffold.yamlconfiguration file. Will be automatically detected if you have askaffold.yamlin your project. - Deployment profile - selects a profile
from the available options configured in your
skaffold.yamlfile. - Environment variables - allows you to configure additional environment variables to be passed to the Skaffold deployment process. Skaffold flags can also be configured as environment variables to be used in this field. Refer to the Skaffold CLI reference documentation for a comprehensive list of available Skaffold environment variables.
- Verbosity - allows you to set your output verbosity level at
trace,debug,info,warn,error, orfatal. The default verbosity level iswarn.
Kubernetes options
Deployment Context - represents the Kubernetes context with which your application is deployed. The default behavior, if a deployment context is not specified, is deploying to your current system context if one exists.
If you'd rather not deploy to the current context, under the Deployment section of Run/Debug settings, you can choose to:
- Deploy locally to a minikube cluster - starts a Cloud Code-managed minikube cluster to run your app and stops the cluster after deployment stops. If a minikube cluster is already running, Cloud Code uses the existing minikube cluster for deployment.
Switch context and deploy to - changes the current context on your system to your specified context upon deployment.
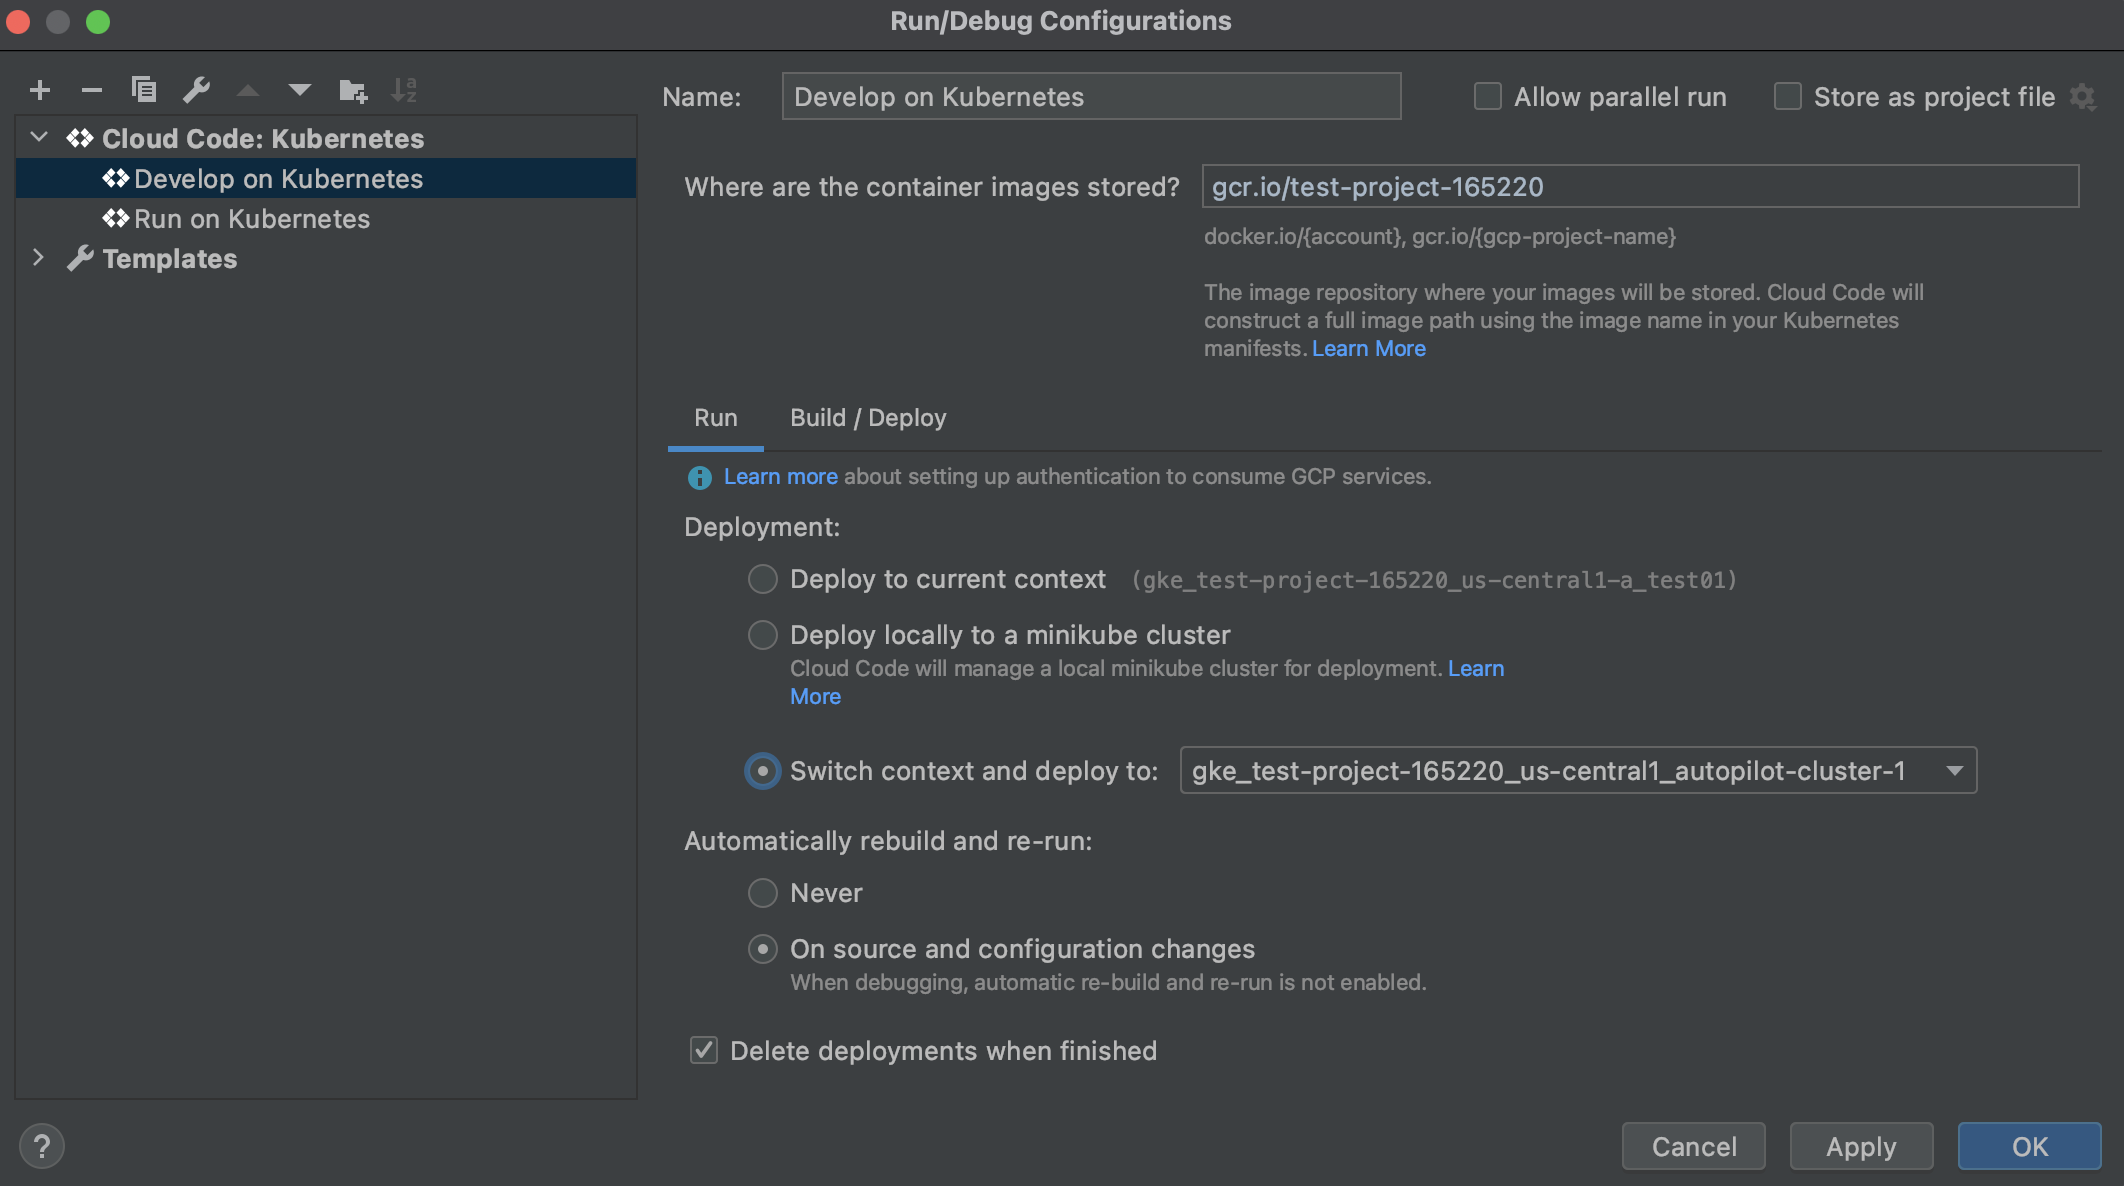
Delete deployments when finished - deletes Kubernetes deployments when the process is terminated. This is default behavior. Alternatively, you can toggle this setting to prevent deployments from being deleted
Customize your launch configuration
To configure how your application is run, you can customize your
skaffold.yaml file.
View remote YAML
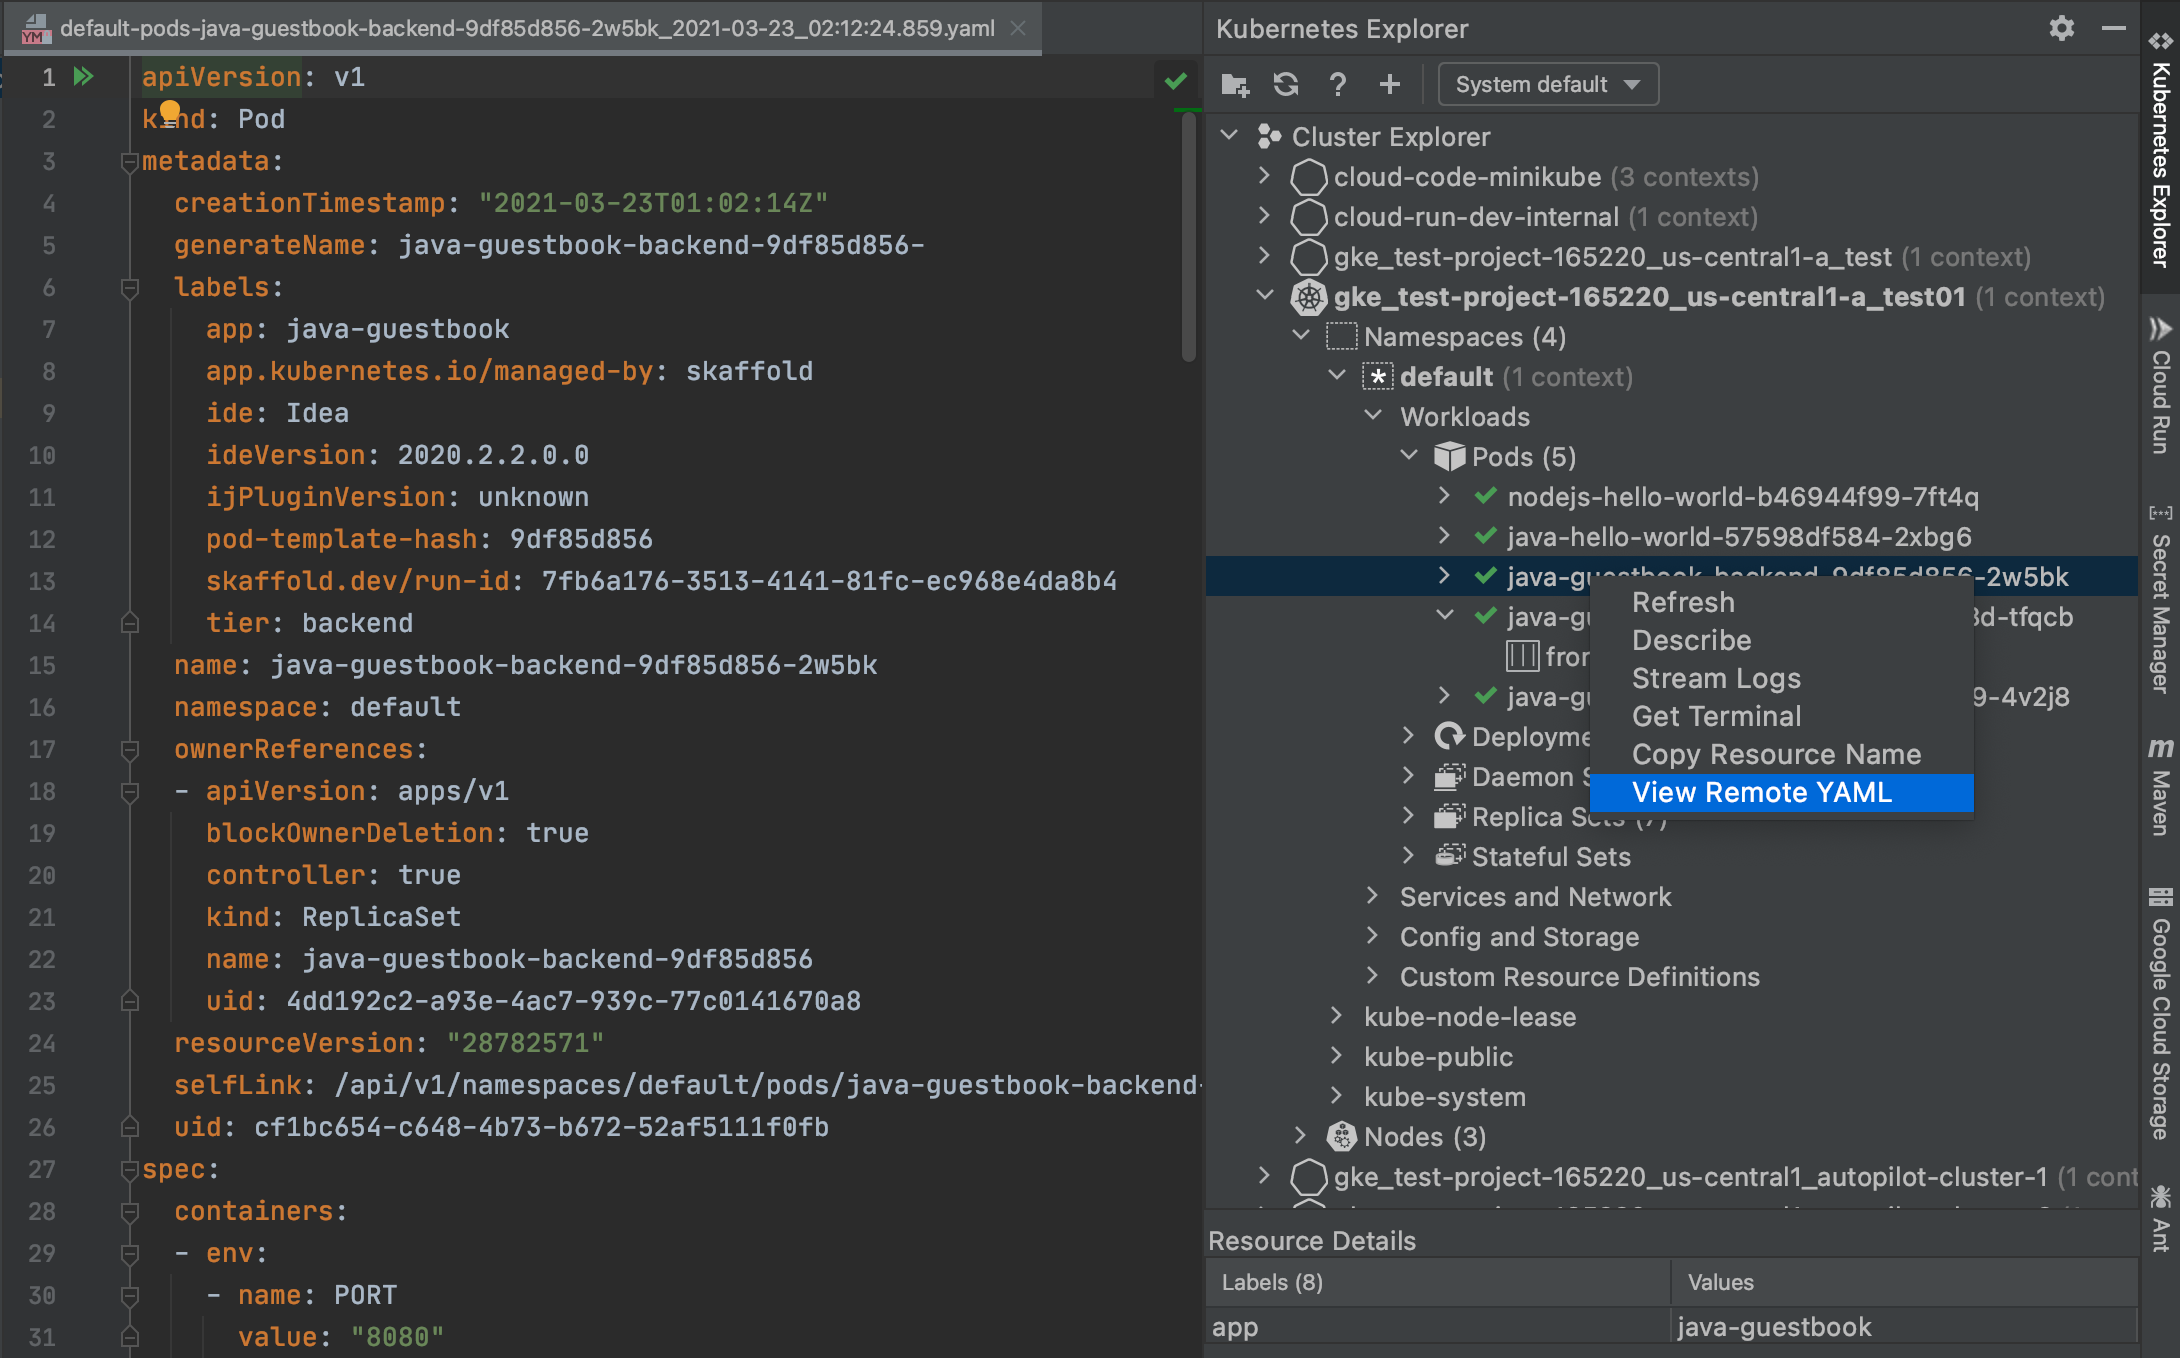
To view the YAML of a resource in your cluster, right from the Kubernetes Explorer. Navigate to a resource in the Kubernetes Explorer, such as a pod, right-click the resource name, and then select View Remote YAML.The YAML file corresponding to your specified resource opens in a new editor tab.
View logs
You can stream and view logs from Kubernetes resources into the Kubernetes Explorer console to monitor their progress.
After your application builds and runs in either regular or development mode, you'll be able to monitor logs streaming from your application from within your IDE.
You can also view logs from a specific service by navigating to the Kubernetes Explorer.
To select the resource you'd like to see logs from, such as a pod, a deployment, or a service:
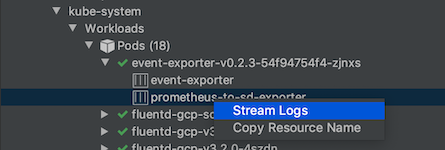
Right-click the resource and select Stream Logs. Alternatively, you can stream logs for individual containers running in pods.
This outputs logs to the Kubernetes Explorer Console.
To view the status of resources in your deployment:
Pod, deployment and node statuses: These Kubernetes resources have colored status marks next to their labels; red for failed state, yellow for starting/terminating/warning, and green for healthy, desired state.

Deployed resource descriptions: You can run a
kubectl describeon your deployed resources to display its details by right-clicking and choosing Describe.
Launch a terminal
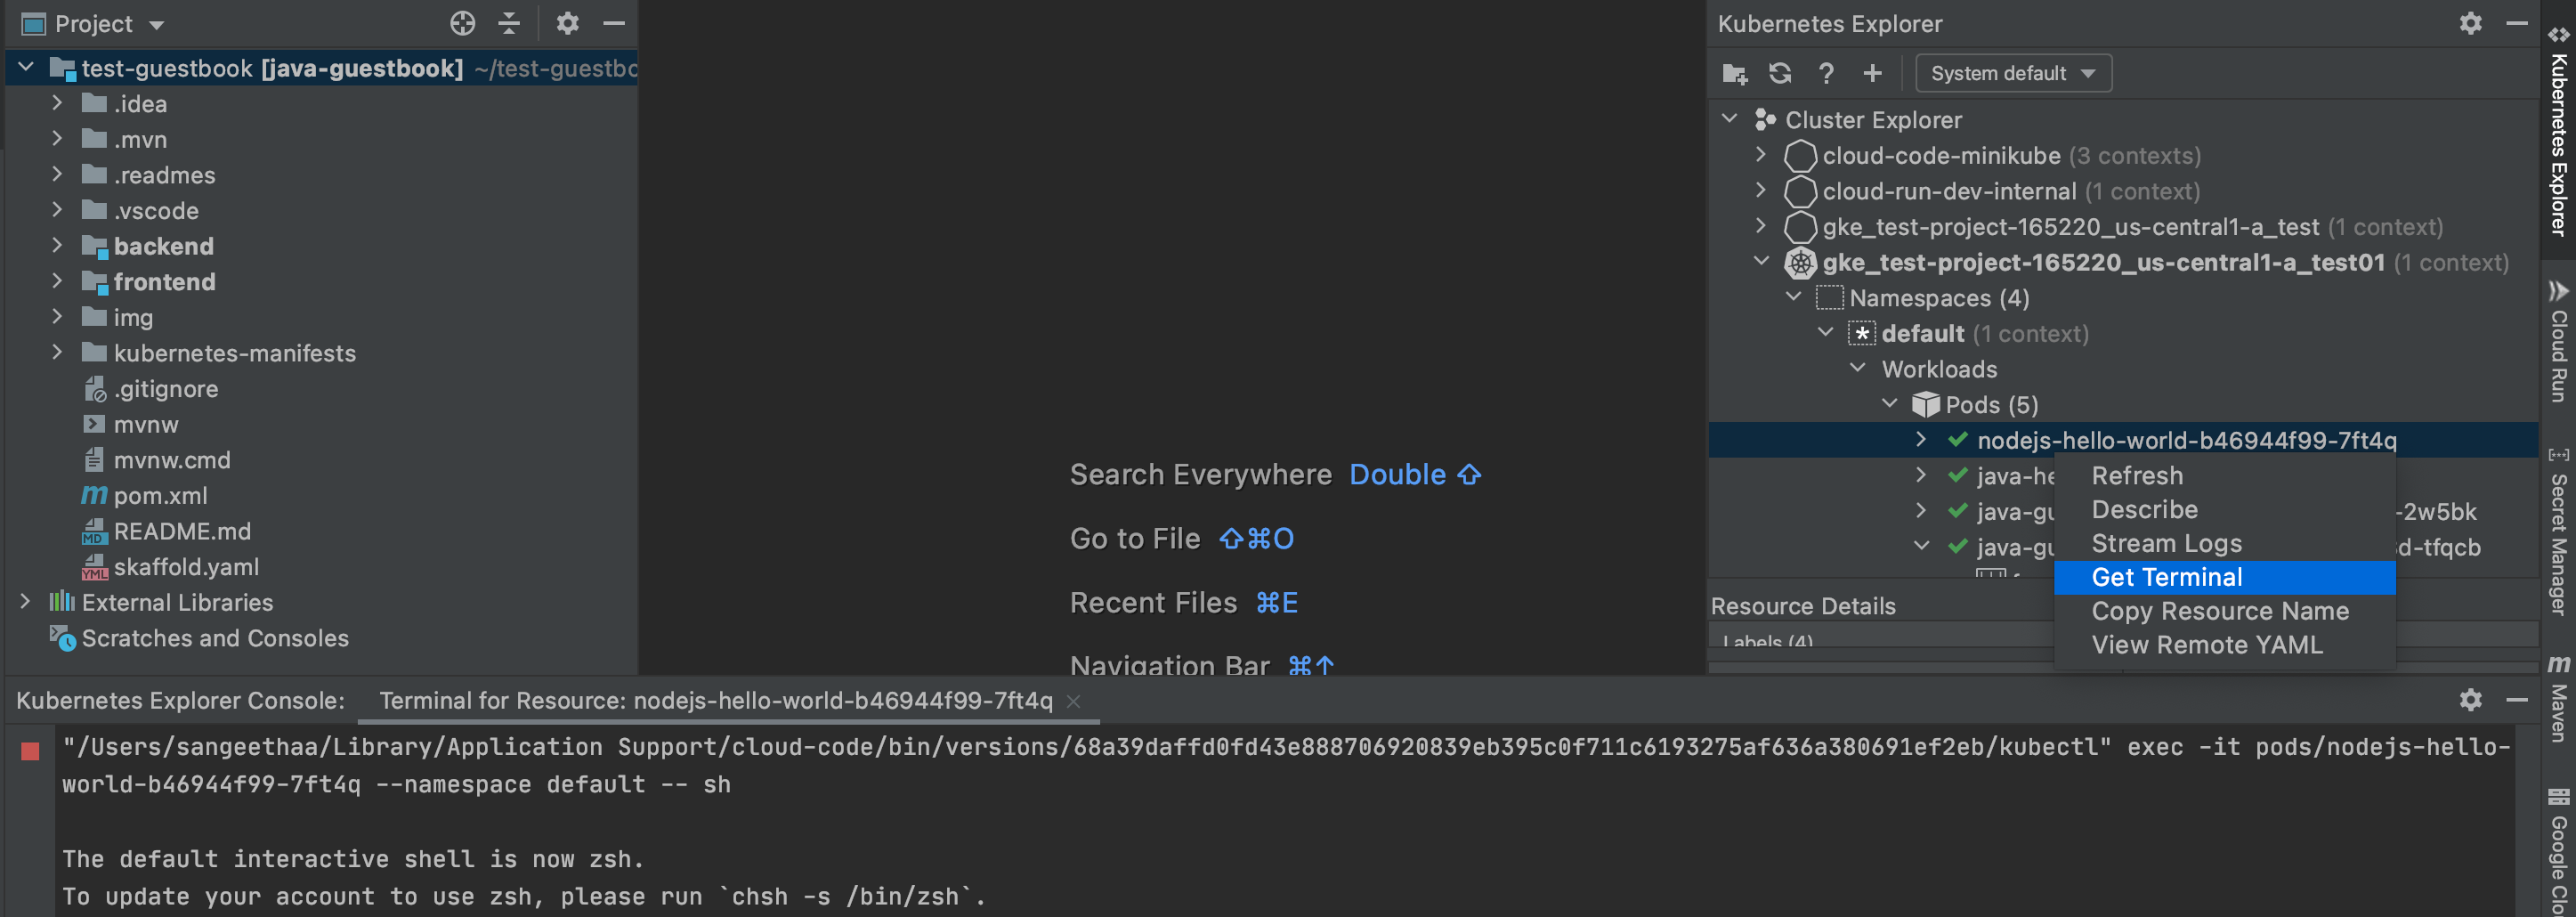
For pods and containers, you can open an interactive terminal by right-clicking the pod or container and selecting Get terminal.
Resource-specific actions
The Kubernetes Explorer displays clusters, namespaces, nodes, workloads (such as deployments, replicasets, pods and containers), services and ingresses, configurations (such as secrets and config maps) and storage (such as volumes). Using the Kubernetes Explorer, you can perform unique actions on some of these resources.
You can access the Kubernetes Explorer from the side panel or go to Tools > Cloud Code > Kubernetes > View Cluster Explorer.

To display the details of your deployed resources, right-click a resource label in the Kubernetes Explorer and then click Describe.

Clusters
- Add a Google Kubernetes Engine cluster: Add an existing Standard or Autopilot GKE cluster or create a new one by clicking + Add GKE Cluster within the Kubernetes Explorer.
The Add Cluster dialog appears and you can choose the project and cluster you'd like to use or create a new cluster.
Once done, click OK and access your chosen cluster and its underlying resources through the Kubernetes Explorer.
Set as current context: Set specified cluster as active such that your configured
kubectlcontext accesses this cluster by default.
The Kubernetes Explorer refreshes automatically and you'll see the Kubernetes symbol next to the appropriate cluster.
If a cluster has multiple contexts configured, you'll be able to choose one of the available contexts to set as the current context.

Namespaces
Set as current context: Set a namespace as active such that your configured
kubectlcontext accesses this namespace by default.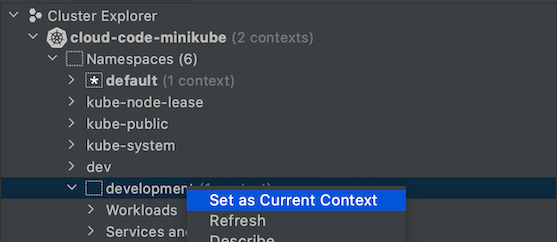
Note that a Kubernetes context is a shortcut which gives you quick access
to a namespace in your cluster. Contexts are normally created
automatically when you start a minikube or GKE cluster. If you don't see
the Set as current context option for a given namespace and you'd
like to create a context for it, use the
kubectl config set-context command
in your terminal to set a context with your preferred cluster, user, and
namespace.
Pods
- View Logs: View logs from a pod into the Kubernetes Explorer Console.
Get Terminal: Get terminal for a pod in the Kubernetes Explorer Console.
Additionally, running pods have colored status marks next to their labels:
- Red: Pod is in a failed state
- Yellow: Pod is starting or terminating
- Green: Pod is healthy and running

Containers
- View logs: View logs from a container into the Kubernetes Explorer console.
- Get Terminal: Get terminal for a container in the Kubernetes Explorer console.
Deployments
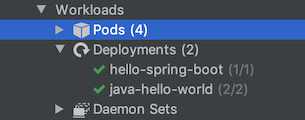
View logs: View logs from a deployment into the Kubernetes Explorer console.
Live deployments have colored status marks next to their labels and counts of current/total replicas:
- Yellow: Deployment does not have minimum availability or have image problems.
- Green: Deployment is healthy and had minimum availability.
Nodes
Nodes of your cluster have colored status marks next to their names:
- Yellow: Node has a resource problem such as memory or disk availability.
- Green: Node is healthy.
Custom Resource Definitions (CRDs)
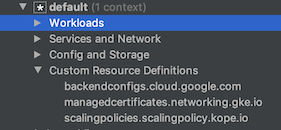
The Kubernetes Explorer lists all Custom Resource Definitions (CRDs) installed and available on your cluster:
What's next
- Get started with Cloud Code for IntelliJ for Kubernetes by creating and deploying a Kubernetes application from a code sample.
- Use file sync and hot reloading to speed up development.
- Debug your application in Cloud Code
