Implementing observability for always-on Ecommerce experience
Vikas Saini
Principal Architect, Google Cloud
Logan Vadivelu
Global Lead, Retail Industry Solutions, Google Cloud
In today’s Digital age, the emphasis continues to be on automation and improving
business processes, employee productivity and customer experiences to meet the ever changing business and consumer expectations. According to Gartner, organizations will require more IT and business process automation as they are forced to accelerate digital transformation plans in a post pandemic, digital-first world. Technologies such as artificial intelligence (AI), machine learning (ML), serverless services and low code development platforms are big influencers for the new generation of software solutions.
The time to market and quality of these solutions which includes user experience and system performance can act as key differentiators. In addition, with the increased focus on moving towards hyperautomation, it's more important than ever to have strong security and governance in place to protect sensitive corporate data and avoid any security related incidents.
The pandemic accelerated the need for retailers and other industry businesses to have an online presence using Ecommerce and mobile applications to engage with customers and enable them to easily purchase products and services. Retailers see Ecommerce as a growth engine to increase their omnichannel revenue. According to Morgan Stanley, global Ecommerce is expected to increase from $3.3 trillion today to $5.4 trillion in 2026. Today’s consumers and shoppers are highly demanding and expect ‘always-on experiences’ from retailers Ecommerce and mobile applications.
Achieving a highly available, performant and resilient Ecommerce platform is critical to attract and retain consumers in today’s hyper competitive business world. For context, 99% vs 99.9% uptime means a 10 times increase in system uptime and availability. Ecommerce applications have to be feature-rich with a lot of content and media to present products to consumers for an engaging experience. Ensuring web pages are loading quickly to display the content is a high priority for Ecommerce platforms and availability (also referred to as uptime) with monitoring is critical to achieving it. A robust, modern logging and monitoring system is a key enabler to providing ‘always-on experiences’ to consumers.
Simply put, Logging is the process of capturing critical log data related to the application events including associated network and infrastructure. Monitoring provides actionable insights into potential threats, performance bottlenecks, resource usage and compliance investigation based on the logging data.
Logging helps capture critical information about events that occurred within the application- Tracks system performance data to ensure proper working of the application
- Captures any potential problems related to suspicious activity or anomalies
- Helps debug/troubleshoot issues faster and easier
- Insights into application performance and operations
- Real-time alerts and tracking dashboards
Cloud Operations Suite
Google Cloud Operations Suite is a complete platform that provides end-to-end visibility into the application performance, configuration and its operation. It includes components to monitor, troubleshoot, and improve application performance. Key components of the operations suite are:
Cloud Logging enables logging data collection from over 150 common application components, on-premises systems, and hybrid cloud systems. It supports storing, searching, analyzing, monitoring, and alerting on logging data and events.
Cloud Monitoring offers metric collection dashboards where metrics, events, and metadata are displayed with rich query language that helps identify issues and uncover patterns.
Error Reporting aggregates and displays errors produced by the application that can help fix the root causes faster. Errors are grouped and de-duplicated by analyzing their stack traces.
Cloud Trace is a distributed tracing system that collects latency data from applications and provides detailed near real-time performance insights.
Cloud Profiler is a low-overhead profiler that continuously gathers CPU usage and memory-allocation information from production applications which can help identify performance or resource bottlenecks.
Cloud Debugger helps inspect the state of a running application in real time, without stopping or slowing it down and helps solve problems that can be impossible to reproduce in a non-development environment. Please note that Cloud Debugger has been deprecated. A potential replacement for it is Snapshot Debugger, an open source debugger to inspect the state of a running cloud application.
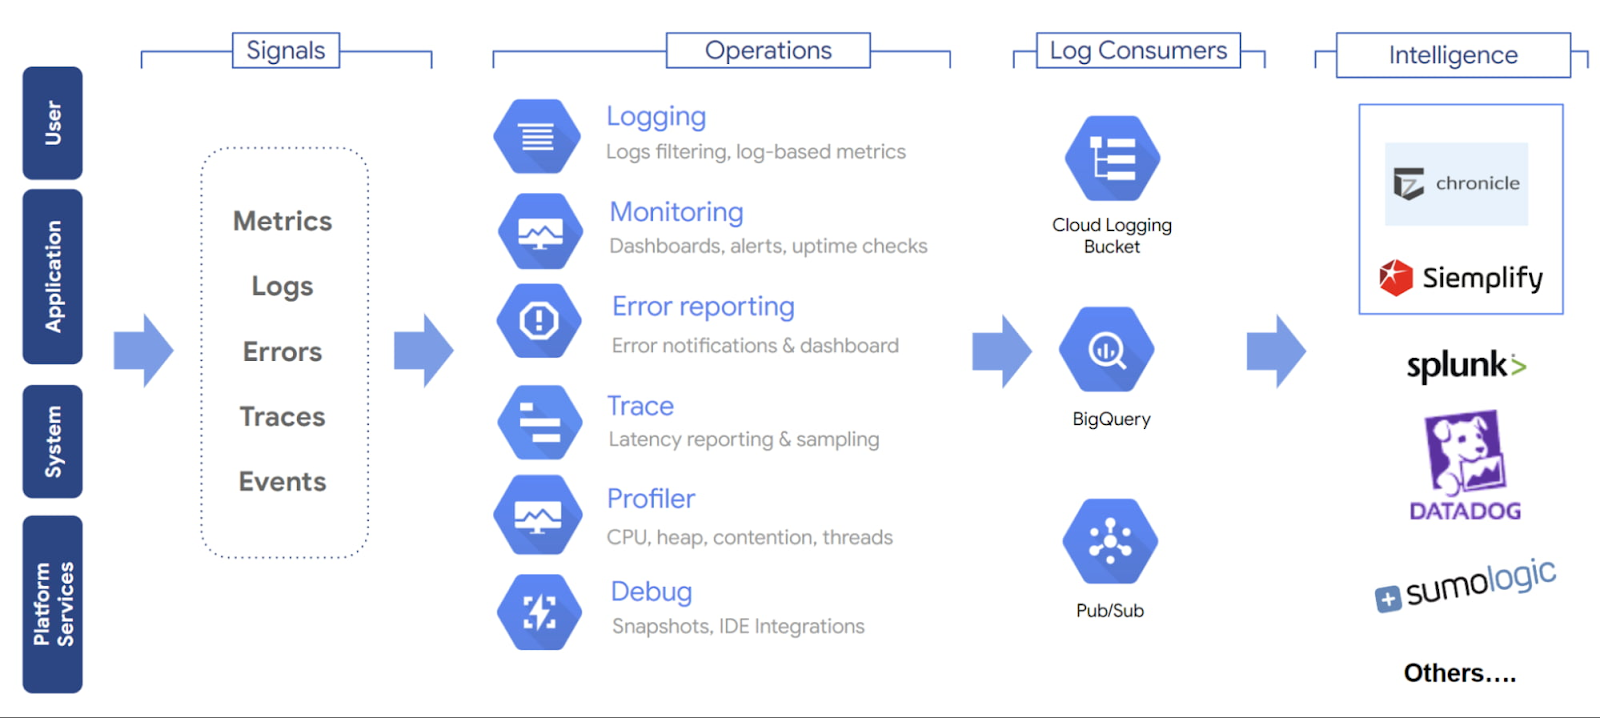

Here are the broad categories of logs that are available in Cloud Logging:
Google Cloud platform logs: Help debug and troubleshoot issues, and better understand the Google Cloud services being used.
User-written logs: Written to Cloud Logging by the users using the logging agent, the Cloud Logging API, or the Cloud Logging client libraries.
Component log: Hybrid between platform and user-written logs which might serve a similar purpose to platform logs but they follow a different log entry structure.
Security logs: Security-related logs - Cloud Audit Logs and Access Transparency logs.
Aggregating the log entries into storage buckets can help better manage the logs and make them easier to monitor. It also makes it easier to stream these logs to SIEM (Security Information and Event Management) and SOAR (Security Orchestration, Automation and Response) for automated analysis and threat detection. Separate retention policies can be applied to the buckets based on requirements, regulatory and compliance needs.
One option to easily explore, report and alert on GCP audit log data by using Looker’s GCP Audit Log Analysis Block. It contains dashboards covering an Admin Activity overview, account investigation, and one using the MITRE ATT&CK framework to view activities that map to attack tactics.
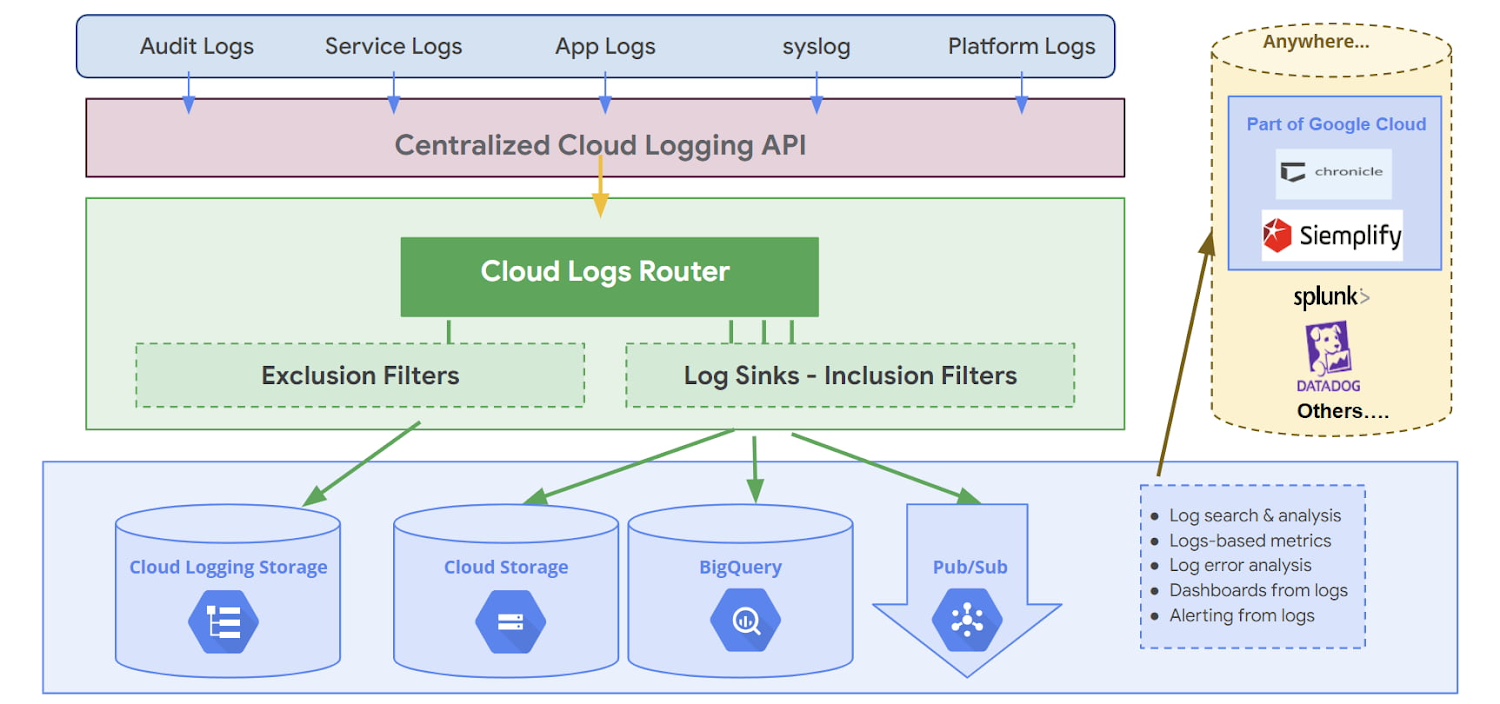
Log entries are ingested through the Cloud Logging API and passed to the Log Router. Sinks manage how the logs are routed. A combination of sinks can be used to route logs to multiple destinations. Sinks can route all or part of the logs to the supported destinations. Following sink destinations are supported:
Cloud Storage: JSON files stored in Cloud Storage buckets
BigQuery: Tables created in BigQuery datasets
Pub/Sub: JSON-formatted messages delivered to Pub/Sub topics which supports third-party integrations
Log Buckets: Log entries held in buckets with customizable retention periods
The sinks in the Log Router check each log entry against the existing inclusion filter and exclusion filters that determine which destinations, including Cloud Logging buckets, that the log entry should be sent to.
BigQuery table schemas for data received from Cloud Logging are based on the structure of the LogEntry type and the contents of the log entry payloads. Cloud Logging also applies rules to shorten BigQuery schema field names for audit logs and for certain structured payload fields.
A combination of sinks can be used to route logs to multiple destinations. Specific logs can be configured to a specific destination using inclusion filters. Similarly, one or more exclusion filters can be used to exclude logs from the sink's destination.
The data from the destinations can be exported or streamed to Chronicle or a third-party SIEM to meet the security and analytics requirements.

Best Practices for Logging and Monitoring
Logging and monitoring policies should be an inherent part of application development and not an afterthought. The solution must provide end-to-end visibility for every component and its operation. It must also support distributed architectures and diverse technologies that make up the application. Here are some best practices to consider while designing and implementing the logging and monitoring solution within Google Cloud.
Enforce Data Access Logs for relevant environments & services. It's always a good practice to keep audit logs enabled to record administrative activities and accesses for platform resources. Audit logs help answer "who did what, where, and when?" Enabling audit logs helps monitor the platform for possible vulnerabilities or data misuse.
Enable Network related logging for all components used by the application. Not only do Network related logs (VPC Flow, Firewall rules, DNS queries, load balancer etc.) provide crucial information on how the logs are performing, they can help provide visibility into critical security related events related to threat detection such as unauthorized logins, malware detection etc.
Aggregate logs to a central project for easier review and management. Most applications now follow a distributed architecture which makes it difficult to get end to end visibility into how the entire application is functioning. Keeping logs in a single project helps make it easier to manage and monitor. This also makes identity and access management (IAM) easier for limiting access to log data to only those teams that need it, following the principle of least privilege.
Configure retention periods based on organizations policy, regulatory or compliance requirements. Creating and managing a log retention policy should help determine how long the log data needs to be stored. The retention periods should be determined based on industry regulations, any applicable laws and internal security concerns.
Configure alerts distinguishing between events that require immediate investigation. Not all events and not all applications are created equal. Operations team must have a clear understanding of which events should be handled in what order. The alerts should be based on this hierarchy - high-priority alerts versus lower-priority.
Plan for the costs associated with logging and monitoring. While logging and monitoring is an absolute must, it's also important to plan for the usage costs associated with tracking log data, storage costs, visualizations and alerting. The operations team should be able to provide reliable estimates on what these costs could look like. Tools such as Google cloud pricing calculator can help with estimating these costs.
Provide continuous and automated log monitoring. Another key aspect of effective logging and monitoring is actively monitoring these logs to identify and alert on security issues such as misconfigurations, vulnerabilities and threat detection. Services such as Security Command Center support discovering misconfigurations and vulnerabilities, reporting on and maintaining compliance, and detecting threats targeting. Also, the solution should allow the log data to integrate with SIEM (Security Information and Event Management) and SOAR (Security Orchestration, Automation and Response) systems for further analysis.
Summary
Logging and Monitoring are both important services of an Ecommerce application (or any application) for minimizing disruption and maintaining consistent performance with high availability. These services help track critical information about the application and underlying infrastructure to help identify potential issues along with anomaly detection.
The extent of data tracked via logging and monitoring should depend on the criticality of the application. Typically, mission critical and business critical applications that directly contribute to generating revenue (such as Ecommerce platforms) require more verbose logging with higher monitoring alerts compared to non-critical applications. Detailed logging & monitoring should also be used for all applications that contain sensitive data and for applications that can be accessed from outside the firewall.
Google Cloud provides extensive tools for logging and monitoring including support for open source platforms such as a managed Prometheus solution and Cloud Monitoring plugin for Grafana. It supports the ability to search, sort, and query logs along with advanced error reporting that automatically analyzes logs for exceptions and intelligently aggregates them into meaningful error groups. With service level objective (SLO) monitoring, alerts can be generated any time SLO violations occur. The monitoring solution also provides visibility into cloud resources and services without any additional configuration.


