Eliminate hotspots in Cloud Bigtable
Stanley Chiang
Software Engineer, Cloud Bigtable
Michael Lau
Cloud Technical Resident
We’ve recently improved Cloud Bigtable’s observability by allowing customers to monitor and observe hot tablets. We now provide customers access to real-time hot tablets data through the Cloud Bigtable Admin API and gcloud command-line tool.
In this post, we’ll present how hot tablets observability can be used in real world use cases to help customers understand better design choices based on access patterns and provide insight into performance-related problems.
What are hot tablets?
A Cloud Bigtable table is sharded into blocks of contiguous rows, called tablets, to help balance the workload of queries. Each tablet is associated with a Bigtable node (or “tablet server” in the original Bigtable paper), and operations on the rows of the tablet are performed by this node. To optimize performance and scale, tablets are split and rebalanced across the nodes based on access patterns such as read, write, and scan operations.
A hot tablet is a tablet that uses a disproportionately large percentage of a node’s CPU compared to other tablets associated with that node. This unbalanced usage can happen due to unanticipated high volume of requests to a particular data point, or uneven table modeling during the initial schema design. This imbalanced node usage can cause higher latencies and replication delays called “hotspots” or “hotspotting.” Unlike cluster-level CPU overutilization, which can often be mitigated by horizontally scaling the number of nodes, hotspotting may require other mitigation techniques, some of which are discussed in this blog.
Use cases for hot tablets data
1) Use Case: Identify Hotspots
Hot tablets can help to diagnose if elevated latencies are due to a large amount of traffic made to a narrow range of row keys. In this example, a customer observed that P99 latencies have been elevated for the past few hours by monitoring query latencies on the Bigtable Monitoring page in the Google Cloud Console:
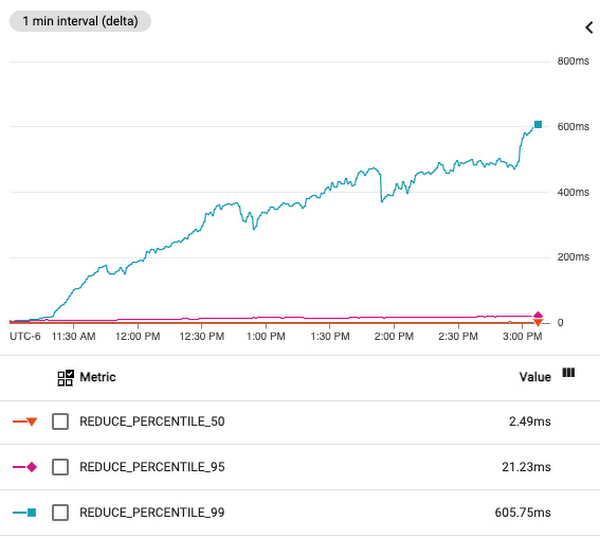

This might be attributed to CPU overutilization, which means that the workload exceeds the recommended usage limits of a cluster. Overutilization typically means that the cluster is under- provisioned, which can be resolved by manually adding more nodes to the cluster or by using autoscaling to automatically add nodes.
To identify if this is the underlying issue, the customer looks at the CPU utilization of this cluster and sees that the average CPU utilization of the cluster is at a healthy ~60%, which is below the recommended limit of 70%. However, the hottest node is running at nearly ~100% CPU utilization; this large difference in CPU usage between the average and hottest node is a strong indication of hotspots.
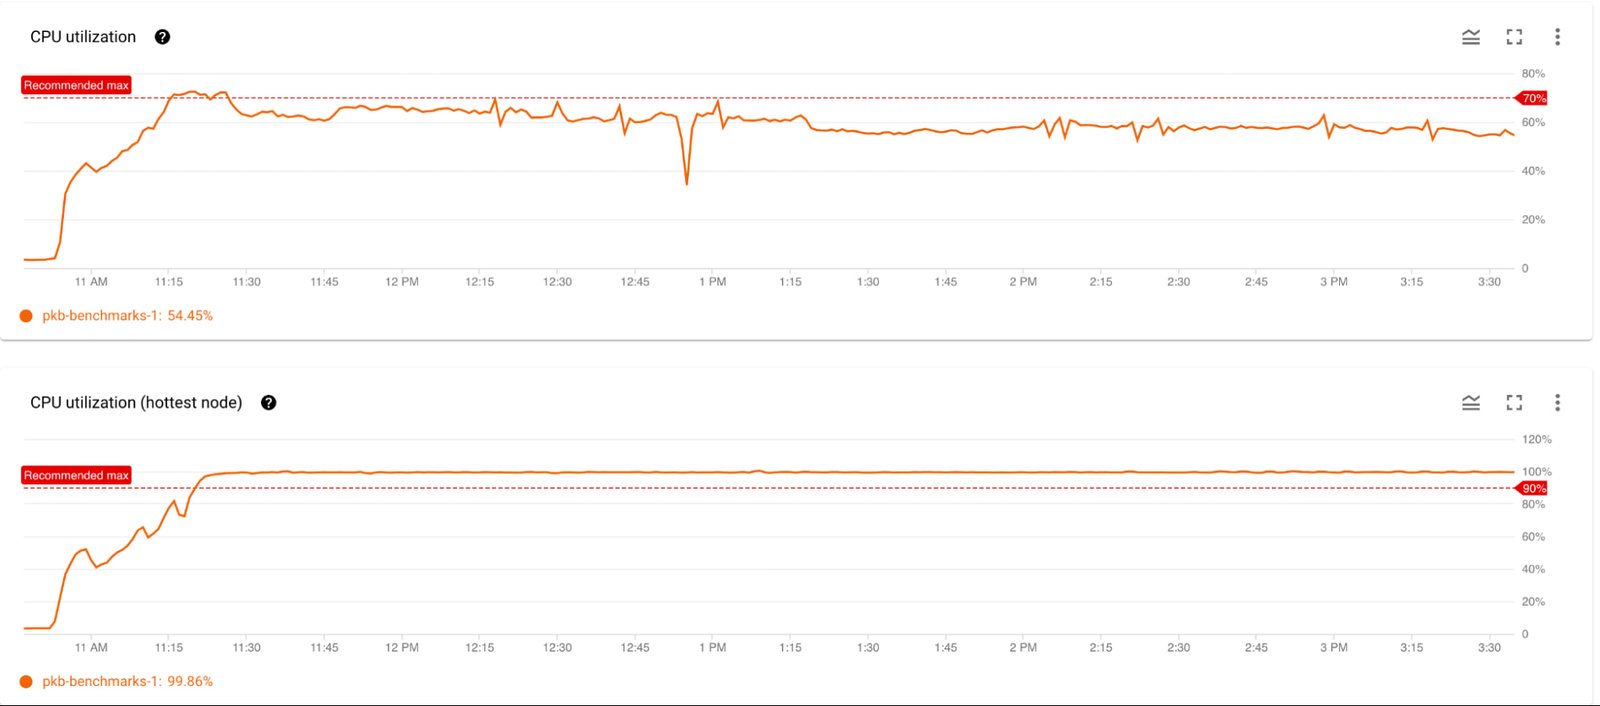

The customer wants to understand the root cause of the hotspots, and runs the gcloud hot-tablets list (or the Bigtable API method) to investigate further:
The hot tablets output confirms that there are hotspots, as there are three tablets with more than 20% CPU usage. In the output, CPU usage refers to the amount of CPU that a single node (tablet server) has used for a single tablet from start time to end time for reads and writes. Remember that a tablet server has tasks other than serving tablets, including:
Replication
Rebalancing
Compaction
Garbage collection
Loading and unloading tablets
Other background tasks
A tablet server can be responsible for hundreds or thousands of tablets, so spending more than 20% of CPU on a single tablet is a relatively large allocation.
The hot tablets method also provides the start and end keys of the tablets; this information can be used to identify the source of the hotspots downstream. In the example above, the customer designed their schema so that the row key is the user ID (<user-id>). That is, all reads and writes for a single user ID are made to a single row. If that user sends requests in bursts or if there are multiple workloads, this row key design would likely be mismatched with access patterns, resulting in a high amount of read and writes to a narrow range of keys.
To resolve the hotspot, the customer can opt to isolate or throttle traffic associated with the users that correspond to the row keys from user432958 to user433124 (the first entry in the output). In addition, the second entry in the output shows only a single row from a start key of user312932 to an end key of user312932\000, which is the smallest possible tablet size. Heavily writing/reading on a single row key will lead to a single-row tablet. To resolve this problem, the customer can opt to isolate or throttle traffic associated with user312932.
The customer can also decide to redesign the row key so that table queries are more evenly spread across the row key space, allowing better load balancing and tablet splitting. Using user ID as the row key stores all user-related information in a single row. This is an anti-pattern that groups unrelated data together, and potentially causes multiple workflows to access the same row. Alternative row key designs to consider are <workload-type>:<user-id> or <workload-type>:<user-id>:<timestamp>.
In summary, the customer decides to resolve the hotspots by either:
Redesigning the row key schema, or
Identifying downstream user(s) or workload(s) to isolate or throttle
2) Use Case: Identify short-lived CPU hotspots (<15 min)
Burst CPU usage in a narrow key range can cause short-lived hotspots and elevated P99 latencies. This type of hotspot can be difficult to diagnose because Key Visualizer has a minimum granularity of 15 minutes, and may not display any hotspots that are ephemeral. While Key Visualizer is an excellent tool at identifying persistent and long-lived hotspots, it may not be able to identify more granular burst usage.
In our example, a customer notices that there are spikes in P99 read latencies in the Bigtable monitoring page:


The customer further debugs these latency spikes by looking at the CPU utilization of the hottest node of the cluster:


The CPU utilization of the hottest node is less than the recommended limit of 90%, but there are spikes in the CPU utilization that correspond to the latency spikes. While this suggests that there are no long-lived hotspots, it could indicate ephemeral hotspots within a key range. The customer investigates this possibility by viewing the Key Visualizer Heatmap:
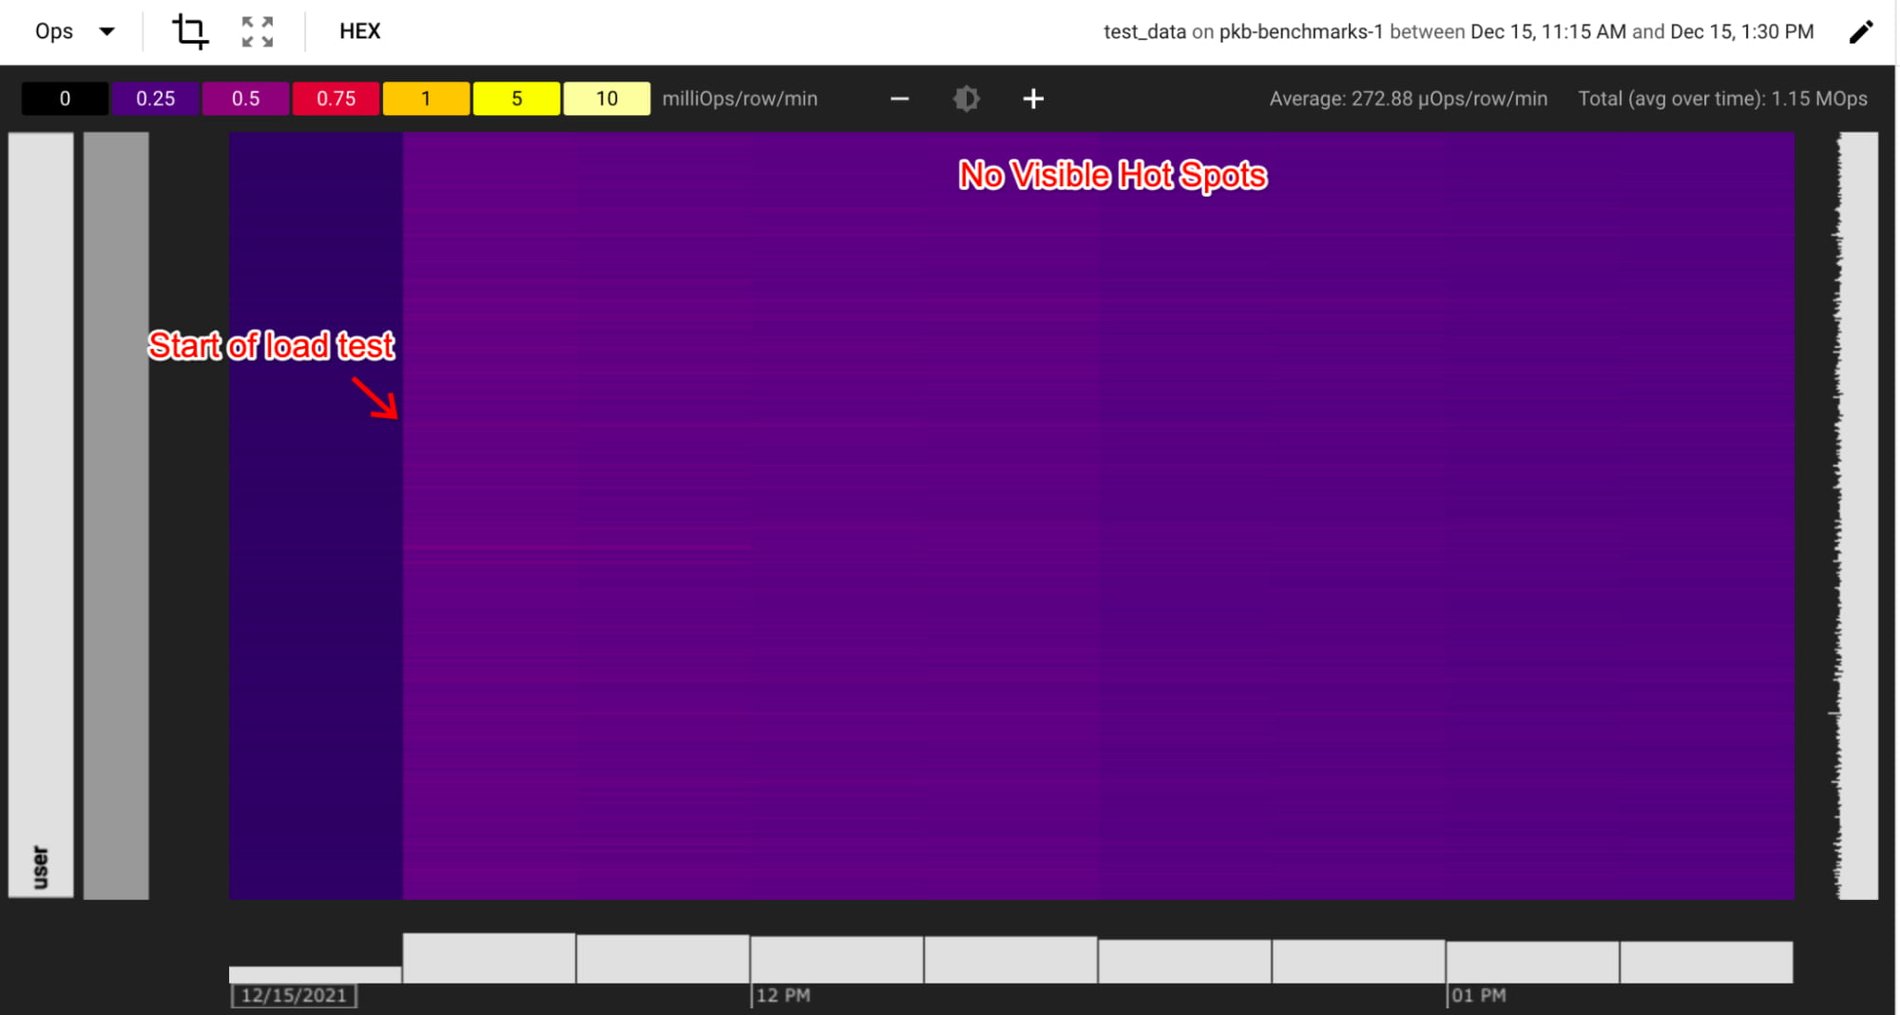

The Key Visualizer heatmap doesn’t indicate any clear hotspotting key ranges, but Key Visualizer aggregates metrics into 15 min buckets. If hotspots did occur over the course of 5 minutes, this usage would be averaged across 15 minutes, and may not show up as a high usage in the heatmap. The new hot tablets method can help customers diagnose these short-lived hotspots with more granular key space and minute-level usage metrics. Running the hot tablets command in gcloud, the customer is able to identify hotspots that lasted for only 2 minutes, but correspond to one of the latency spikes:
It’s possible with the new hot tablets method to identify the key ranges and tablets that have high CPU usage during the P99 tail latencies. This finer-grained reporting can help customers make more informed application design choices and help improve latency and throughput performance.
Similar to the previous use case, the customer can decide if the ephemeral hotspots are problematic enough to warrant a row key redesign or isolate the offending user(s) and/or workload(s).
3) Use Case: Identify noisy tables in a multi-table cluster
Many customers use a single cluster for multiple workflows and tables. While this option is a reasonable and recommended way to get started with Cloud Bigtable, multiple workflows could potentially interfere with each other.
For example, a customer has two tables on a cluster: table-batch and table-serve. As their names suggest, table-batch contains data to process batch workflows and table-serve contains data to serve requests. While throughput is prioritized for the batch workflows, latency is critical for serving requests.
The customer notices that there is high cluster CPU utilization and periodic latency spikes from 3 pm to 6 pm. The customer wants to know if the batch workflows are interfering with request serving and causing the elevated latencies. Running the hot tablets command for this time period:
From the results, the customer sees that most of the tablets that exhibited high CPU usage during this time period are from the table-batch table. The output helped discover independent workflows that interfere with each other in a multi-table cluster. By identifying the table that exhibits the largest hotspots, the customer can move table-batch to a separate cluster.
Likewise, if there are multiple workflows on the same table, the customer can decide to
set up replication to isolate the batch workflow. Another approach to understand the breakdown of CPU usage among different workflows is to use custom app profiles.
Summary
We’ve walked through a few use cases on how the hot tablets method can be used to identify and troubleshoot performance problems. This additional observability can help resolve hotspots and reduce latency. To try this on your own Google Cloud project, see documentation about how to use the hot tablets method with the Cloud Bigtable API and the gcloud command.

