이 페이지에서는 학습 후 모델의 평가 측정항목을 사용하는 방법을 설명하며, 모델 성능을 개선할 수 있는 몇 가지 기본 권장사항을 소개합니다.
소개
모델 학습이 끝나면 AutoML Tables는 테스트 데이터세트를 이용해 새 모델의 품질과 정확성을 평가하고, 테스트 데이터세트에 대한 모델의 성능을 포함한 평가 측정항목 모음을 제공합니다.
평가 측정항목을 사용하여 모델의 품질을 결정하는 작업은 사용자의 비즈니스 필요와 모델이 해결하도록 학습한 문제에 따라 달라집니다. 예를 들어 거짓음성보다 거짓양성의 비용이 클 수도 있고, 그 반대일 수도 있습니다. 회귀 모델에서는 예측과 실제 답변 간의 델타가 중요할까요? 이러한 유형의 질문은 모델 평가 측정항목을 보는 방식에 영향을 줍니다.
학습 데이터에 가중치 열이 있더라도, 평가 측정항목에 영향을 주지는 않습니다. 가중치는 학습 단계에서만 고려됩니다.
분류 모델의 평가 측정항목
분류 모델은 다음 측정항목을 제공합니다.
AUC PR: 정밀도-재현율(PR) 곡선 아래의 영역입니다. 이 값의 범위는 0부터 1까지이며 값이 클수록 모델의 품질이 높습니다.
AUC ROC: 수신자 조작 특성(ROC) 곡선 아래의 영역입니다. 이 값의 범위는 0부터 1까지이며 값이 클수록 모델의 품질이 높습니다.
정확도: 모델이 생성한 올바른 분류 예측의 비율입니다.
로그 손실: 모델 예측과 타겟 값 사이의 교차 엔트로피입니다. 이 값의 범위는 0부터 무한대이며 값이 작을수록 모델의 품질이 높습니다.
F1 점수: 정밀도와 재현율의 조화 평균입니다. F1은 정밀도와 재현율 사이의 균형을 찾고 있으며 클래스 분포가 균등하지 않을 때 유용한 측정항목입니다.
정밀도: 모델이 생성한 정확한 포지티브 예측의 비율입니다. (포지티브 예측은 거짓양성과 참양성을 조합한 것입니다.)
재현율: 모델이 올바르게 예측한 이 라벨이 있는 행의 비율입니다. '참양성률'이라고도 합니다.
거짓양성률: 모델에서 타겟 라벨이라 예측했지만 실제로는 아닌(거짓양성) 행의 비율입니다.
이러한 측정항목은 타겟 열의 모든 고유 값마다 반환됩니다. 멀티클래스 분류 모델의 경우 이러한 측정항목에 대한 미시 평균이 계산되고 요약 측정항목으로 반환됩니다. 이진 분류 모델의 경우 소수 범주의 측정항목이 요약 측정항목으로 사용됩니다. 미시 평균 측정항목은 데이터세트의 임의 샘플에 대한 각 측정항목의 예상 값입니다.
위의 측정항목 외에도 AutoML Tables는 분류 모델, 혼동 행렬, 특성 중요도 그래프를 이해할 수 있도록 다음 두 가지 방법을 제공합니다.
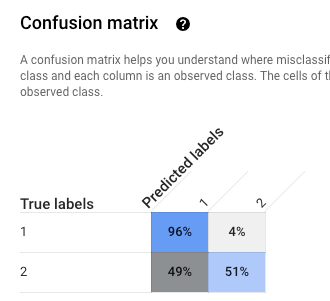
혼동 행렬: 혼동 행렬은 잘못된 분류가 발생한 부분(다른 클래스와 '혼동'되는 클래스)을 파악하는 데 도움이 됩니다. 각 행은 특정 라벨의 정답을 나타내며, 각 열에는 모델에서 예측한 라벨이 표시됩니다.
혼동 행렬은 타겟 열의 값 수가 10개 이하인 분류 모델에만 제공됩니다.
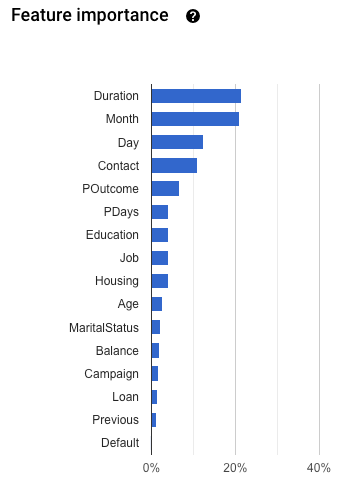
특성 중요도: AutoML Tables는 각 특성이 이 모델에 얼마나 영향을 미치는지 나타냅니다. 이는 특성 중요도 그래프에 표시됩니다. 이 값은 각 특성의 백분율로 제공됩니다. 비율이 높을수록 해당 특성이 모델 학습에 더 큰 영향을 미칩니다.
이 정보를 검토하여 가장 중요한 모든 특성이 데이터 및 비즈니스 문제에 적합한지 확인해야 합니다. 설명 기능 자세히 알아보기
미시 평균 정밀도 계산 방법
미시 평균 정밀도는 타겟 열의 각 예상 값에 대한 참양성(TP) 수를 더해 각 예상 값에 대한 참양성(TP)과 참음성(TN) 수로 나눠 계산합니다.
\[ precision_{micro} = \dfrac{TP_1 + \ldots + TP_n} {TP_1 + \ldots + TP_n + FP_1 + \ldots + FP_n} \]
각 항목의 의미는 다음과 같습니다.
- \(TP_1 + \ldots + TP_n\)는 n개 클래스의 각 항목에 대한 참양성의 합입니다.
- \(FP_1 + \ldots + FP_n\)은 n개 클래스의 각 항목에 대한 거짓양성의 합입니다.
점수 임계값
점수 임계값은 0부터 1사이의 숫자입니다. 지정된 예측 값이 참으로 사용되어야 하는 경우 최소 신뢰도 수준을 지정하는 방법을 제공합니다. 예를 들어 실제 값일 확률이 매우 낮은 클래스가 있다면 해당 클래스의 임계값을 낮출 수 있습니다. 임계값을 0.5 이상으로 설정하면 해당 클래스가 매우 드물게 예측되거나 예측되지 않을 수 있습니다.
임계값이 높아지면 거짓양성이 줄어들지만 거짓음성이 늘어납니다. 임계값이 낮아지면 거짓음성이 줄어들지만 거짓양성이 늘어납니다.
다른 방법으로 설명하면 점수 임계값은 정밀도와 재현율에 영향을 미칩니다. 임계값이 높아지면 완전히 확신할 수 있을 때까지 모델에서 예측을 수행하지 않기 때문에 정밀도가 높아지지만, 모델이 정상 작동함을 나타내는 긍정적 예시의 비율인 재현율이 낮아집니다.
회귀 모델의 평가 측정항목
회귀 모델은 다음과 같은 측정 항목을 제공합니다.
MAE: 평균 절대 오차(MAE)는 타겟 값과 예측 값의 절대차 평균입니다. 이 측정항목의 범위는 0부터 무한대이며 값이 작을수록 모델의 품질이 높다는 것을 나타냅니다.
RMSE: 평균 제곱근 오차 측정항목은 모델 또는 에스티메이터에서 예측한 값과 관찰한 값 간의 차이를 측정하는 데 자주 사용됩니다. 이 측정항목의 범위는 0부터 무한대이며 값이 작을수록 모델의 품질이 높다는 것을 나타냅니다.
RMSLE: 평균 제곱근 대수 오차 측정항목은 RMSE와 유사합니다. 단, RMSLE는 예측 값과 실제 값+1의 자연 로그를 사용합니다. RMSLE는 과대 예측이 아닌 과소 예측에 더 높은 패널티를 적용합니다. 또한 작은 예측 값보다 큰 예측 값의 초과 값에 더 높은 패널티를 적용하지 않을 때 유용한 측정항목이 될 수 있습니다. 이 측정항목의 범위는 0부터 무한대이며 값이 작을수록 모델의 품질이 높다는 것을 나타냅니다. RMSLE 평가 측정항목은 모든 라벨 및 예측 값이 음수가 아닌 경우에만 반환됩니다.
r^2: r 제곱(r^2)은 라벨과 예측 값 사이의 피어슨 상관 계수 제곱입니다.r^2 이 측정항목의 범위는 0부터 1까지이며 값이 클수록 모델의 품질이 높다는 것을 나타냅니다.
MAPE: 평균 절대 백분율 오차(MAPE)는 라벨과 예측 값의 절대오차 백분율 평균입니다. 이 측정항목의 범위는 0부터 무한대이며 값이 작을수록 모델의 품질이 높다는 것을 나타냅니다.
타겟 열에 0 값이 포함된 경우 MAPE가 표시되지 않습니다. 이 경우 MAPE는 정의되지 않습니다.
특성 중요도: AutoML Tables는 각 특성이 이 모델에 얼마나 영향을 미치는지 나타냅니다. 이는 특성 중요도 그래프에 표시됩니다. 이 값은 각 특성의 백분율로 제공됩니다. 비율이 높을수록 해당 특성이 모델 학습에 더 큰 영향을 미칩니다.
이 정보를 검토하여 가장 중요한 모든 특성이 데이터 및 비즈니스 문제에 적합한지 확인해야 합니다. 설명 기능 자세히 알아보기
모델의 평가 측정항목 가져오기
테스트 데이터세트에서의 모델 성능 평가를 위해, 모델의 평가 측정항목을 검사합니다.
콘솔
Google Cloud Console에서 모델의 평가 측정항목을 표시하려면 다음 안내를 따르세요.
Google Cloud Console의 AutoML Tables 페이지로 이동합니다.
왼쪽 탐색창에서 모델 탭을 선택하고, 평가 측정항목을 가져올 모델을 선택합니다.
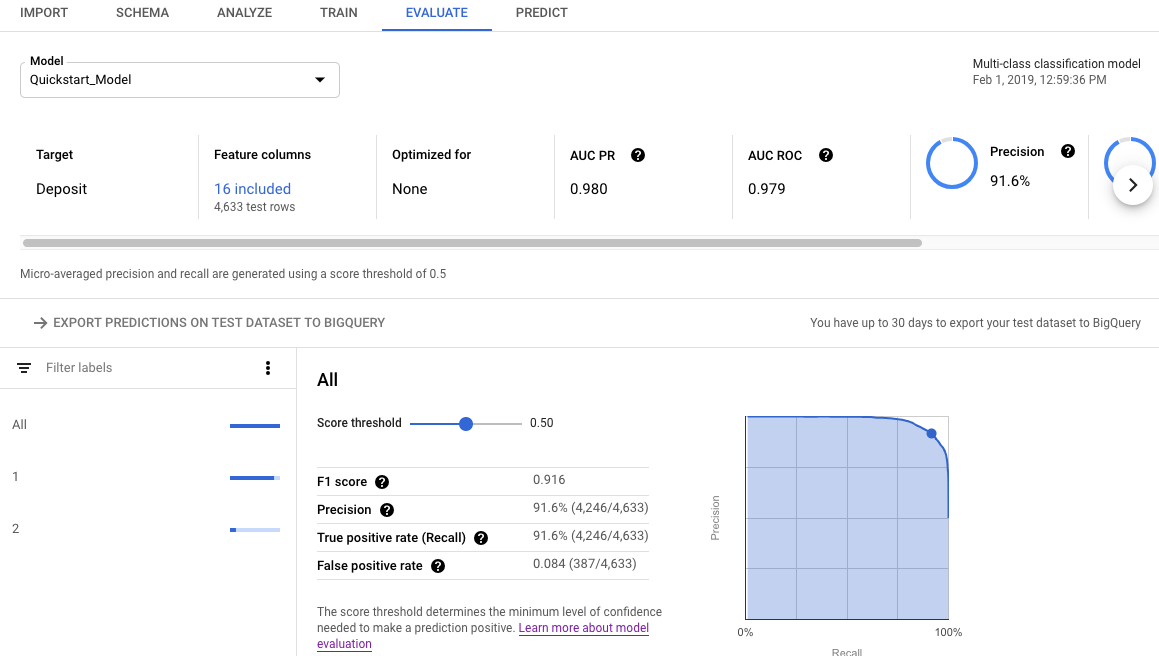
평가 탭을 엽니다.
요약 평가 측정항목은 화면 상단에 표시됩니다. 이진 분류 모델의 경우 요약 측정항목은 소수 범주의 측정항목입니다. 멀티클래스 분류 모델의 경우 요약 측정항목은 미시 평균 측정항목입니다.
분류 측정항목의 경우 개별 타겟 값을 클릭하면 해당 값의 측정항목이 표시됩니다.
REST
Cloud AutoML API를 사용하여 모델의 평가 측정항목을 가져오려면 modelEvaluations.list 메서드를 사용합니다.
요청 데이터를 사용하기 전에 다음을 바꿉니다.
-
endpoint: 전역 위치인 경우
automl.googleapis.com, EU 리전인 경우eu-automl.googleapis.com입니다. - project-id: Google Cloud 프로젝트 ID입니다.
- location: 리소스의 위치로 전역인 경우
us-central1, 유럽 연합인 경우eu입니다. -
model-id: 평가할 모델의 ID입니다. 예를 들면
TBL543입니다.
HTTP 메서드 및 URL:
GET https://endpoint/v1beta1/projects/project-id/locations/location/models/model-id/modelEvaluations/
요청을 보내려면 다음 옵션 중 하나를 선택합니다.
curl
다음 명령어를 실행합니다.
curl -X GET \
    -H "Authorization: Bearer $(gcloud auth print-access-token)" \
    -H "x-goog-user-project: project-id" \
    "https://endpoint/v1beta1/projects/project-id/locations/location/models/model-id/modelEvaluations/"
PowerShell
다음 명령어를 실행합니다.
$cred = gcloud auth print-access-token
$headers = @{ "Authorization" = "Bearer $cred"; "x-goog-user-project" = "project-id" }

Invoke-WebRequest `
    -Method GET `
    -Headers $headers `
    -Uri "https://endpoint/v1beta1/projects/project-id/locations/location/models/model-id/modelEvaluations/" | Select-Object -Expand Content
Java
리소스가 EU 리전에 있다면 엔드포인트를 명시적으로 설정해야 합니다. 자세히 알아보기
Node.js
리소스가 EU 리전에 있다면 엔드포인트를 명시적으로 설정해야 합니다. 자세히 알아보기
Python
AutoML Tables용 클라이언트 라이브러리에는 AutoML Tables API로 간소화할 수 있는 추가 Python 메서드가 포함됩니다. 이러한 메서드는 데이터세트와 모델을 id가 아닌 이름으로 지칭합니다. 데이터 세트와 모델 이름은 고유해야 합니다. 자세한 내용은 클라이언트 참조를 확인하세요.
리소스가 EU 리전에 있다면 엔드포인트를 명시적으로 설정해야 합니다. 자세히 알아보기
API를 사용한 평가 결과 이해
Cloud AutoML API를 사용하여 모델 평가 측정항목을 가져오면 대량의 정보가 반환됩니다. 측정항목 결과의 구조를 이해하면 결과를 해석하고 모델을 평가하는 데 사용할 수 있습니다.
분류 결과
분류 모델의 경우 결과에는 여러 ModelEvaluation 객체가 포함되어 있으며, 각 객체에는 여러 ConfidenceMetricsEntry 객체가 포함됩니다. 결과를 구조화하는 방법을 이해하면 모델을 평가할 때 사용할 올바른 객체를 선택할 수 있습니다.
2개의 ModelEvaluation 객체는 학습 데이터에 있는 타겟 열의 모든 고유한 값마다 반환됩니다. 또한 요약 ModelEvaluation 객체는 2개가 있으며, 이 중 하나는 비어 있으므로 무시할 수 있습니다.
특정 라벨 값에 대해 반환된 2개의 ModelEvaluation 객체는 displayName 필드의 라벨 값을 나타냅니다. 각각 서로 다른 위치 임계값을 사용하며 1개는 1을, 나머지 1개는 가능한 가장 많은 수를 나타내는 MAX_INT입니다. 위치 임계값은 예측에 고려되는 결과의 수를 결정합니다.
분류 문제의 경우 각 입력에 하나의 라벨만 선택되기 때문에 위치 임곗값 1을 사용하는 것이 가장 적절합니다. 다중 라벨 문제의 경우 입력당 2개 이상의 라벨을 선택할 수 있으므로 MAX_INT 위치 임곗값에 대해 반환된 평가 측정항목이 더 유용할 수 있습니다. 모델의 특정 사용 사례에 따라 사용할 측정항목을 결정해야 합니다.
2개의 요약 ModelEvaluation 객체에는 혼동 행렬의 일부인 경우를 제외하고 displayName 필드가 포함되지 않습니다. 또한 evaluatedExampleCount 필드의 값은 학습 데이터의 전체 행 수입니다.
멀티클래스 분류 모델의 경우 요약 객체는 라벨에 따른 모든 측정항목을 기반으로 미시 평균 측정항목을 제공합니다.
이진 분류 모델의 경우 소수 범주의 측정항목이 요약 측정항목으로 사용됩니다. 요약 객체의 위치 임계값이 1인 ModelEvaluation 객체를 사용하세요.
각 ModelEvaluation 객체에는 ConfidenceMetricsEntry 객체가 학습 데이터에 따라 최대 100개까지 포함됩니다. 각 ConfidenceMetricsEntry 객체는 신뢰도 임계값(점수 임계값이라고도 함)에 다른 값을 제공합니다.
요약 ModelEvaluation 객체는 다음 예시와 유사하게 표시됩니다. 필드 표시 순서는 다를 수 있습니다.
model_evaluation {
  name: "projects/8628/locations/us-central1/models/TBL328/modelEvaluations/18011"
  create_time {
    seconds: 1575513478
    nanos: 163446000
  }
  evaluated_example_count: 1013

  classification_evaluation_metrics {

    au_roc: 0.99749845
    log_loss: 0.01784837
    au_prc: 0.99498594

    confidence_metrics_entry {
      recall: 0.99506414
      precision: 0.99506414
      f1_score: 0.99506414
      false_positive_rate: 0.002467917
      true_positive_count: 1008
      false_positive_count: 5
      false_negative_count: 5
      true_negative_count: 2021
      position_threshold: 1
    }
    confidence_metrics_entry {
      confidence_threshold: 0.0149591835
      recall: 0.99506414
      precision: 0.99506414
      f1_score: 0.99506414
      false_positive_rate: 0.002467917
      true_positive_count: 1008
      false_positive_count: 5
      false_negative_count: 5
      true_negative_count: 2021
      position_threshold: 1
    }
   ...
   confusion_matrix {
      row {
        example_count: 519
        example_count: 2
        example_count: 0
      }
      row {
        example_count: 3
        example_count: 75
        example_count: 0
      }
      row {
        example_count: 0
        example_count: 0
        example_count: 414
      }
      display_name: "RED"
      display_name: "BLUE"
      display_name: "GREEN"
    }
  }
}
라벨별 ModelEvaluation 객체는 다음 예시와 유사하게 표시됩니다. 필드 표시 순서는 다를 수 있습니다.
model_evaluation {
  name: "projects/8628/locations/us-central1/models/TBL328/modelEvaluations/21860"
  annotation_spec_id: "not available"
  create_time {
    seconds: 1575513478
    nanos: 163446000
  }
  evaluated_example_count: 521

  classification_evaluation_metrics {

    au_prc: 0.99933827
    au_roc: 0.99889404
    log_loss: 0.014250426

    confidence_metrics_entry {
      recall: 1.0
      precision: 0.51431394
      f1_score: 0.6792699
      false_positive_rate: 1.0
      true_positive_count: 521
      false_positive_count: 492
      position_threshold: 2147483647
    }
    confidence_metrics_entry {
      confidence_threshold: 0.10562216
      recall: 0.9980806
      precision: 0.9904762
      f1_score: 0.9942639
      false_positive_rate: 0.010162601
      true_positive_count: 520
      false_positive_count: 5
      false_negative_count: 1
      true_negative_count: 487
      position_threshold: 2147483647
    }
  ...
  }
  display_name: "RED"
}
회귀 결과
회귀 모델에서는 다음 예시와 비슷한 출력이 표시됩니다.
{
  "modelEvaluation": [
    {
      "name": "projects/1234/locations/us-central1/models/TBL2345/modelEvaluations/68066093",
      "createTime": "2019-05-15T22:33:06.471561Z",
      "evaluatedExampleCount": 418
    },
    {
      "name": "projects/1234/locations/us-central1/models/TBL2345/modelEvaluations/852167724",
      "createTime": "2019-05-15T22:33:06.471561Z",
      "evaluatedExampleCount": 418,
      "regressionEvaluationMetrics": {
        "rootMeanSquaredError": 1.9845301,
        "meanAbsoluteError": 1.48482,
        "meanAbsolutePercentageError": 15.155516,
        "rSquared": 0.6057632,
        "rootMeanSquaredLogError": 0.16848126
      }
    }
  ]
}
모델 문제 해결
모델 평가 측정항목은 훌륭해야 하지만 완벽해선 안 됩니다. 좋지 않은 모델 성능과 완벽한 모델 성능은 모두 학습 과정에 문제가 있다는 뜻입니다.
좋지 않은 성능
모델이 원하는 대로 작동하지 않는다면, 다음을 시도해 보세요.
스키마를 검토합니다.
모든 열의 유형이 올바른지, ID 열처럼 예측적이지 않은 모든 열을 학습에서 배제했는지 확인하세요.
데이터를 검토합니다.
null 비허용 열에 누락된 값이 있으면 관련 행이 무시됩니다. 데이터에 오류가 너무 많지 않은지 확인하세요.
테스트 데이터 세트를 내보내 검사합니다.
모델이 잘못된 예측을 할 때 데이터를 검사하고 분석하면, 특정 결과에 대한 더 많은 학습 데이터가 필요한지 아니면 학습 데이터에 유출이 있는지를 판단할 수 있습니다.
학습 데이터의 양을 늘립니다.
학습 자료가 부족하면 모델 품질이 저하됩니다. 학습 데이터의 편향을 최대한 줄이세요.
학습 시간을 늘립니다.
학습 시간이 짧았다면 더 오랫동안 학습하게 해 모델의 품질을 높일 수 있습니다.
완벽한 성능
모델이 완벽에 가까운 평가 측정항목을 반환했다면, 학습 데이터에 문제가 있을지도 모릅니다. 다음 사항을 확인해 보세요.
타겟 유출
타겟 유출은 학습 시점에서는 알 수 없으며, 결과를 기반으로 하는 학습 데이터에 특성이 있을 때 발생합니다. 예를 들어 처음 방문한 사용자의 구매 여부를 결정하도록 학습된 모델에 단골 고객 수를 포함하면 이 모델의 평가 측정항목은 매우 우수하지만, 실제 데이터에 적용할 때는 단골 고객 수를 포함할 수 없기 때문에 저조한 성능을 보일 수 있습니다.
타겟 유출을 확인하려면 모델의 평가 탭에 있는 특성 중요도 그래프를 검토하세요. 중요도가 높은 열이 실제로 예측적이며 타겟 관련 정보를 유출하지 않는지 확인하세요.
시간 열
데이터의 시간이 중요하다면, 시간 열을 사용했거나 시간 기준 수동 분할을 사용했는지 확인하세요. 이렇게 하지 않으면 평가 측정항목이 편향될 수 있습니다. 자세히 알아보기
테스트 데이터세트를 BigQuery에 다운로드
타겟 열을 포함한 테스트 데이터세트를 각 행에 대한 모델의 결과와 함께 다운로드할 수 있습니다. 모델이 오류를 보이는 행을 검사하면 모델을 개선할 단서를 얻을 수 있습니다.
Google Cloud 콘솔에서 AutoML Tables를 엽니다.
왼쪽 탐색창에서 모델을 선택하고 모델을 클릭합니다.
평가 탭을 열고 테스트 데이터세트의 예측을 BigQuery로 내보내기를 클릭합니다.
내보내기가 끝나면 BigQuery에서 평가 결과 보기를 클릭해 데이터를 확인합니다.