Go 1.11 已終止支援,並將於 2026 年 1 月 31 日
淘汰。淘汰後,您將無法部署 Go 1.11 應用程式,即使貴機構先前使用機構政策重新啟用舊版執行階段的部署作業也一樣。現有的 Go 1.11 應用程式在
淘汰日期過後,仍會繼續執行並接收流量。建議您
遷移至最新支援的 Go 版本。
監控與快訊延遲
透過集合功能整理內容
你可以依據偏好儲存及分類內容。
本頁說明如何監控 Google App Engine 中的延遲時間,並接收相關警示。
App Engine 應用程式可能會因為各種原因而出現高延遲。例如,應用程式沒有經過最佳化的程式碼、資源不足、機器忙碌等。本指南著重於 App Engine 產生的延遲,不論原因為何。
請務必瞭解,高延遲時間通常會導致 5xx 錯誤。因此,快速偵測高延遲時間可協助您及時採取行動,進而解決應用程式錯誤。
設定監控和快訊
監控
如果您想建立自訂圖表來監控應用程式的回應延遲時間,請依序前往「Cloud Monitoring」>「Metrics Explorer」,建立自己的圖表。
前往 Metrics Explorer 頁面
在「Resource Type」中,選取「GAE Application」,然後在「Metric」篩選器中選取「Response latency」。如果您想檢查特定服務,也可以使用「篩選器」篩選特定模組,查看回應延遲時間圖表。
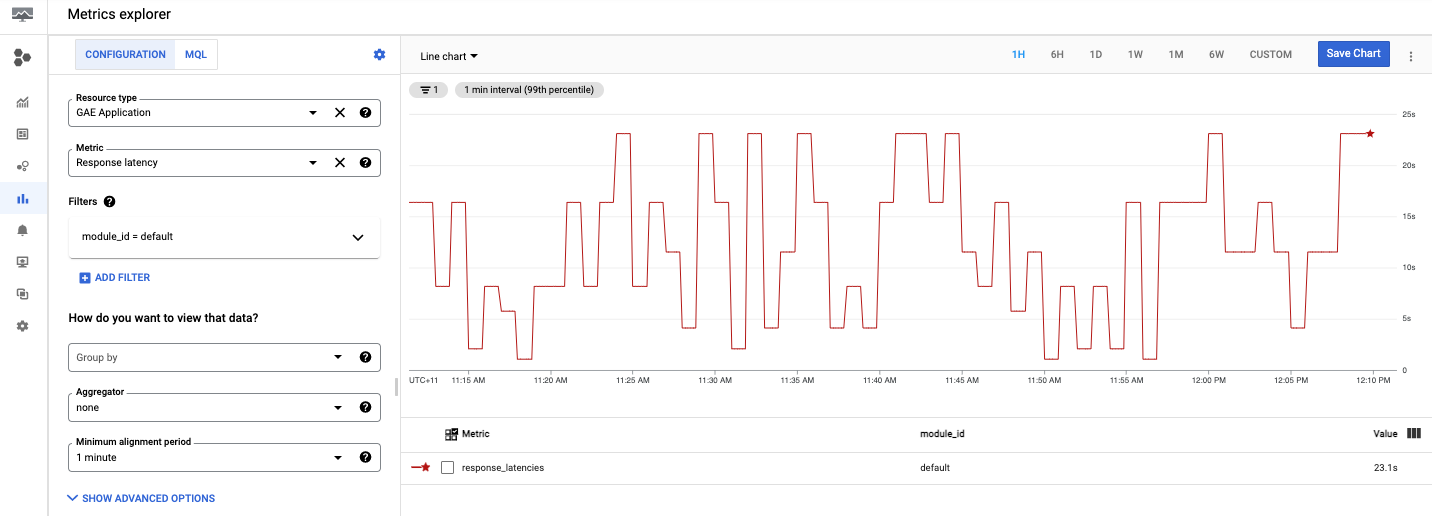
自訂圖表已設定完成,接下來我們將說明如何設定超過特定秒數的延遲通知。
快訊
如要建立快訊政策,請按照下列指示操作:
- 設定通知,在「Cloud Monitoring」 >「快訊」中建立快訊政策,然後按一下「+ 建立政策」。
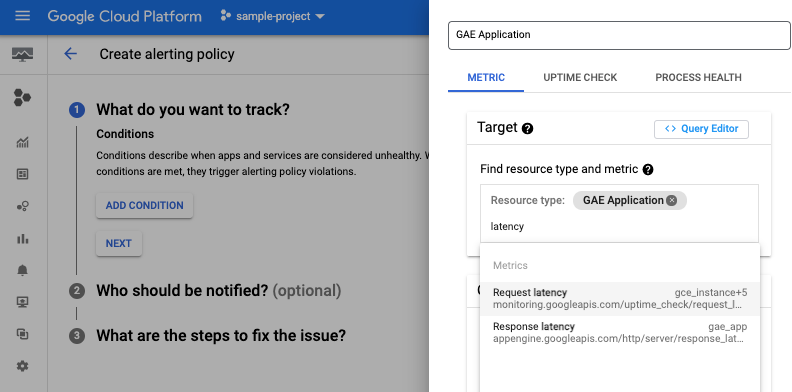
按一下「新增條件」,為警報新增條件。
前往「Alerting」(快訊) 頁面
選取「GAE Application」做為目標:
舉例來說,如果您想接收回應延遲時間的快訊 (例如 App Engine 應用程式回應所需的時間),請選取「回應延遲時間」。
您也可以選取適當的模組 ID,並新增閾值和通知管道。如需操作說明,請參閱「管理通知管道」。
建立政策後,您會在「Alerting」頁面的清單中看到該政策。按一下所建立的政策即可查看詳細資料,如下圖所示:
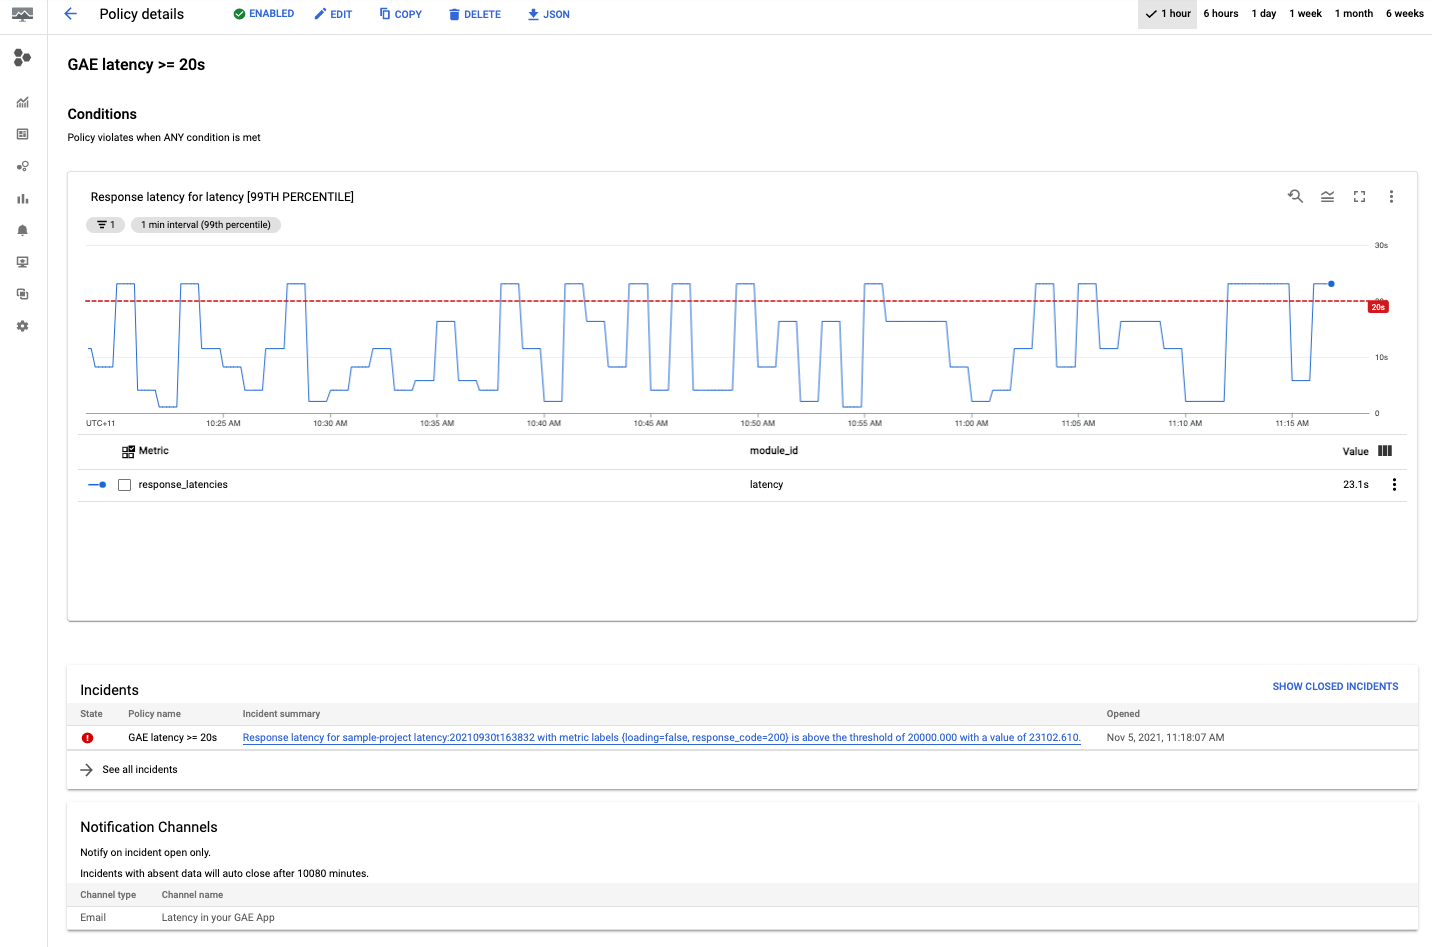
恭喜!您剛剛建立了第一個 App Engine 延遲政策!建立政策後,應用程式會在偵測到事件時,傳送快訊至所選管道。
偵錯延遲時間
查看 App Engine 延遲時間資訊主頁
一般來說,如要查看 App Engine 應用程式的延遲時間,請依序前往「App Engine」 >「資訊主頁」,然後選取「延遲時間」圖表。
前往 App Engine 資訊主頁
在延遲時間圖表中,您可以依服務、版本和間隔篩選圖表,深入查看資料。
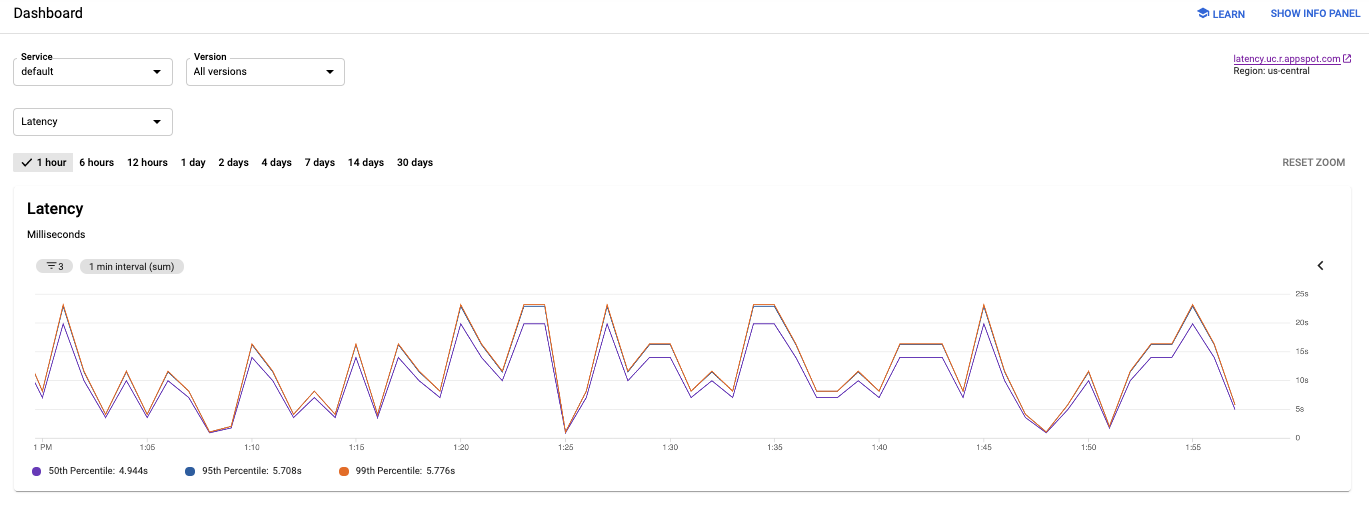
請注意,上圖中的應用程式延遲時間從幾毫秒變成近 25 秒。
瞭解應用程式延遲時間
如要瞭解特定要求目前處理進度,請前往:
Cloud Logging
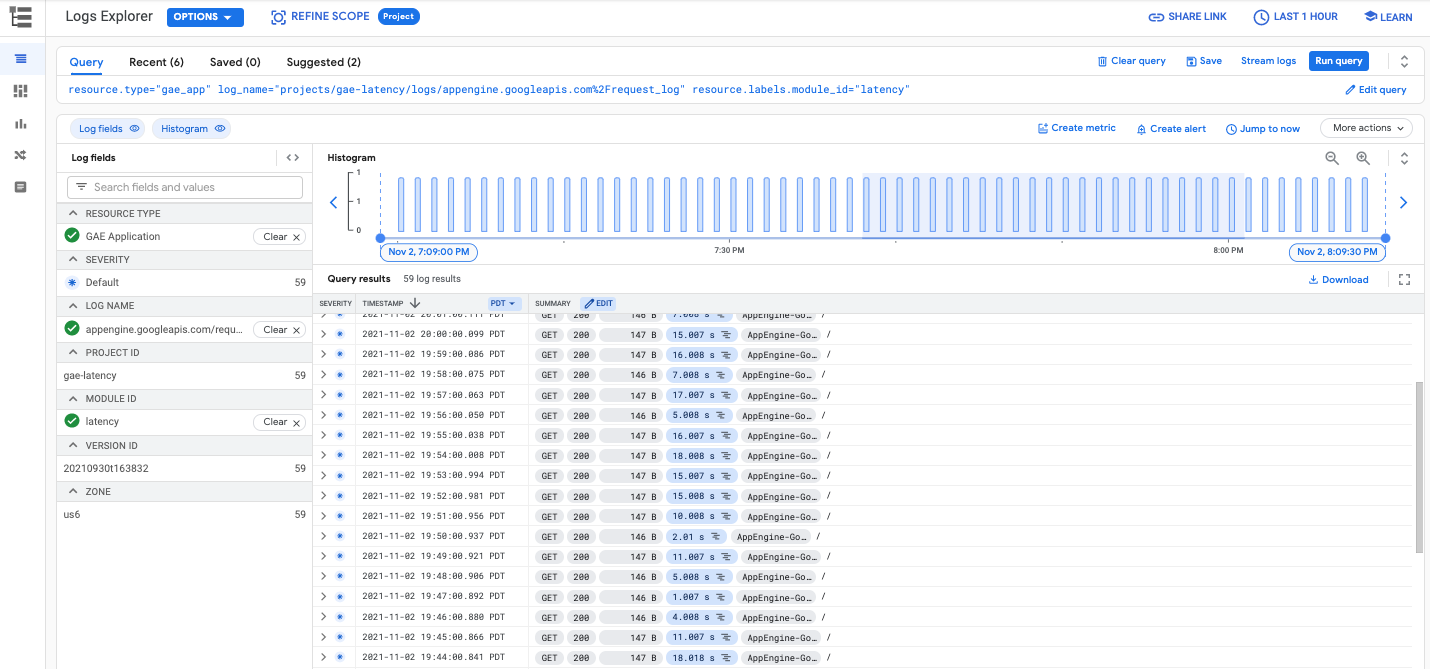
在 Cloud Logging 中,您可以找到兩種類型的記錄:要求記錄和應用程式記錄。App Engine 會針對應用程式收到的每項要求自動寫入要求記錄,其中包含 HTTP 方法、回應代碼等資訊。應用程式記錄檔是您為應用程式編寫的記錄檔。
如要查看要求記錄或應用程式記錄,請參閱「查看記錄」。
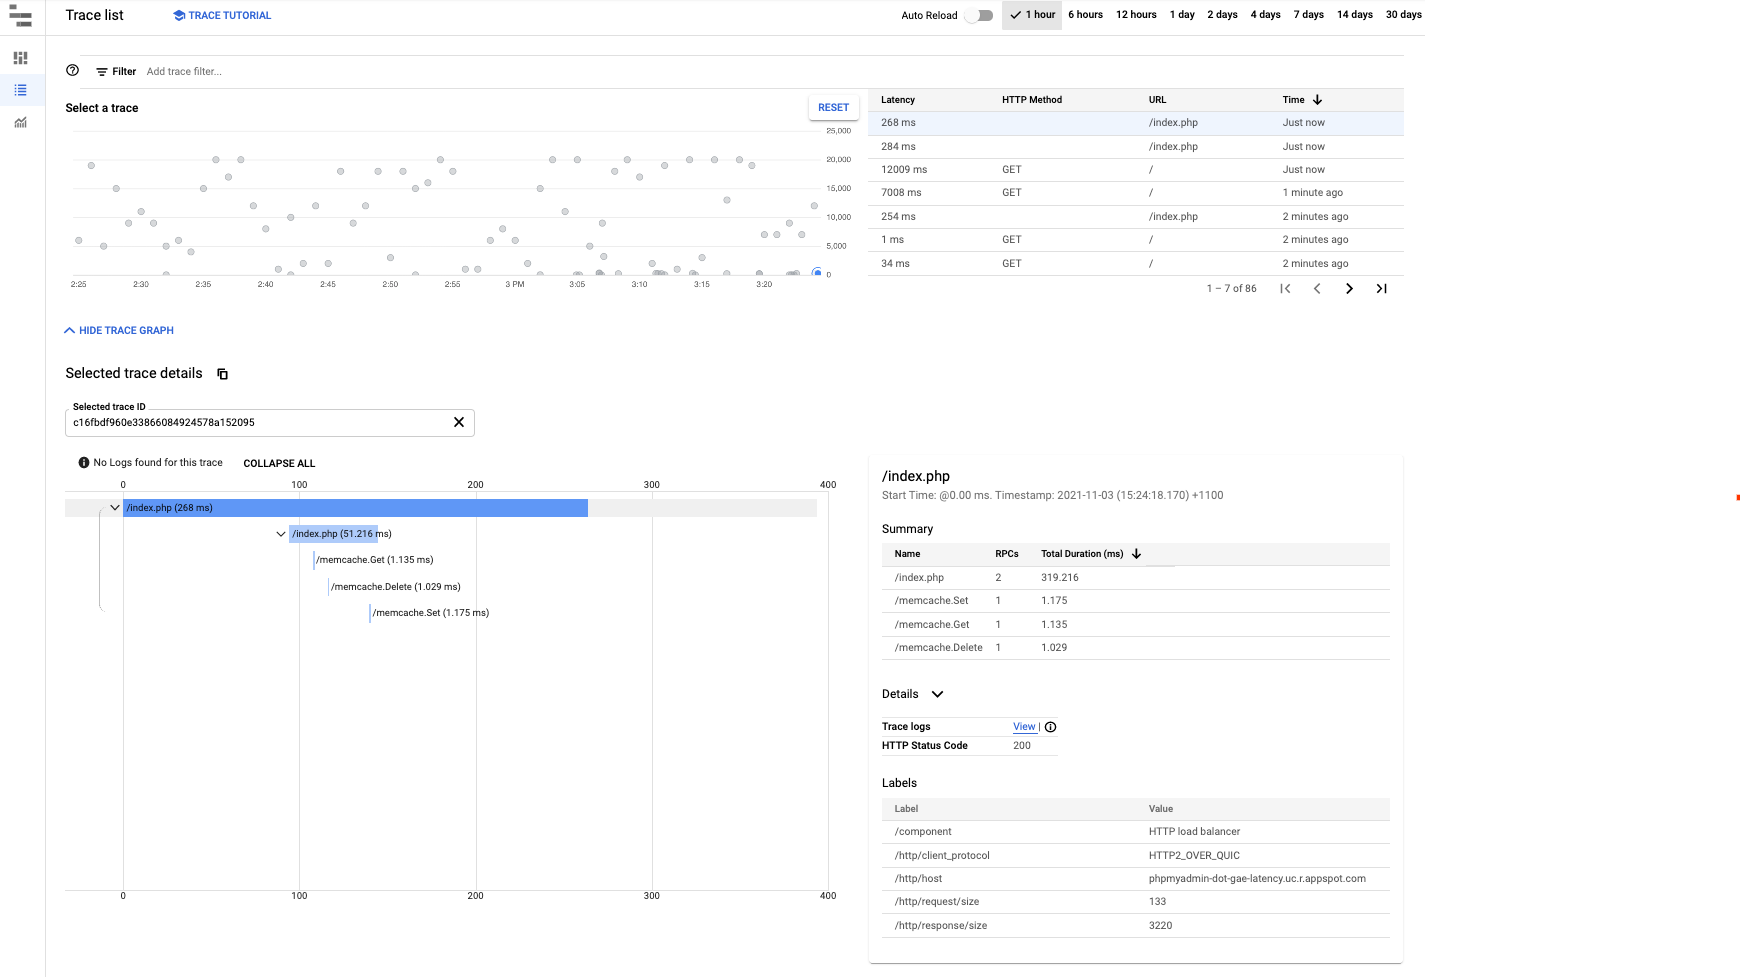
Cloud Trace
Cloud Trace 可協助您瞭解要求在應用程式中傳播的情形。您可以查看單項要求的詳細延遲資訊,或是瀏覽整個應用程式的匯總延遲資料。
如要在 Cloud Trace 中查看追蹤記錄詳細資料,請按照尋找及探索追蹤記錄中的步驟操作。如以下圖片所示,您可以在Trace Explorer 中使用篩選器,依特定 App Engine 服務和版本進行篩選。
除非另有註明,否則本頁面中的內容是採用創用 CC 姓名標示 4.0 授權,程式碼範例則為阿帕契 2.0 授權。詳情請參閱《Google Developers 網站政策》。Java 是 Oracle 和/或其關聯企業的註冊商標。
上次更新時間:2025-09-04 (世界標準時間)。
[[["容易理解","easyToUnderstand","thumb-up"],["確實解決了我的問題","solvedMyProblem","thumb-up"],["其他","otherUp","thumb-up"]],[["難以理解","hardToUnderstand","thumb-down"],["資訊或程式碼範例有誤","incorrectInformationOrSampleCode","thumb-down"],["缺少我需要的資訊/範例","missingTheInformationSamplesINeed","thumb-down"],["翻譯問題","translationIssue","thumb-down"],["其他","otherDown","thumb-down"]],["上次更新時間:2025-09-04 (世界標準時間)。"],[[["\u003cp\u003eThis page guides you through monitoring and receiving alerts for elevated latency in Google App Engine applications.\u003c/p\u003e\n"],["\u003cp\u003eHigh latency in App Engine can be monitored using Cloud Monitoring's Metrics Explorer, which allows for customized graphs and filters based on service or module.\u003c/p\u003e\n"],["\u003cp\u003eAlerting policies for response latency can be created in Cloud Monitoring, where you can set thresholds and notification channels to receive alerts when latency exceeds specified levels.\u003c/p\u003e\n"],["\u003cp\u003eTo debug latency issues, you can check the App Engine dashboard's latency graph, which allows filtering by service, version, and interval.\u003c/p\u003e\n"],["\u003cp\u003eCloud Logging and Cloud Trace are available tools to further understand and debug app latency, allowing you to view request and application logs, and track request propagation through the application.\u003c/p\u003e\n"]]],[],null,["# Monitoring and alerting latency\n\nThis page describes how to monitor and get alerts from elevated latency in\nGoogle App Engine.\n\nHigh latency for App Engine apps can occur for various reasons. For\nexample, the app does not have optimized code, there aren't enough resources,\nthere are busy machines, and so forth. This guide focuses on the latency\ngenerated by App Engine regardless of the reason.\n\nIt is important to understand that high latency can often lead to 5xx errors.\nTherefore, rapid detection of high latency can help you act in time and thus\nresolve application errors.\n\nSetting up Monitoring and Alerting\n----------------------------------\n\n### Monitoring\n\nIf you want to create a customized graph to monitor your app's response latency,\nuse **Cloud Monitoring** \\\u003e **Metrics Explorer** to build your own graph.\n\n[Go to Metrics Explorer page](https://console.cloud.google.com/monitoring/metrics-explorer)\n\nIn the **Resource Type** , select *GAE Application* and select *Response latency*\nin the **Metric** filter. If you have a specific service to check, you can also\nuse **Filters** to filter by the specific module to see the response latency\nchart.\n\nNow that you've set up your customized graph, let's take a look at the next\nsection and learn how to set up notifications for latencies over a certain\namount of seconds.\n\n### Alerting\n\nTo create an alerting policy, do the following:\n\n1. Set up notifications, create an alerting policy in **Cloud Monitoring** \\\u003e **Alerting** and click on **+ CREATE POLICY**.\n2. Add a condition to your alert by clicking **ADD CONDITION**.\n\n [Go to Alerting page](https://console.cloud.google.com/monitoring/alerting)\n3. Select GAE Application as a target:\n\nFor example, if you wanted to get alerts for response latency, such as how long\nyour App Engine app is taking to respond, select response latency.\n\nYou can also select the module ID if it's appropriate, and add a threshold and a\nnotification channel. See\n[Managing notification channels](https://cloud.google.com/monitoring/support/notification-options)\nfor instructions.\n\nAfter you have finished creating the policy, you will see the policy in a list\nin the Alerting page. Click on the created policy to see the details, as shown\nin the following image:\n\nCongratulations, you just created your first App Engine latency policy!\nAfter you create your policy, the app will send an alert to the selected channel\nif it detects an incident.\n\nDebugging latency\n-----------------\n\n### Checking the App Engine latency dashboard\n\nIn general, when you want to see the latency of App Engine applications,\ngo to **App Engine** \\\u003e **Dashboard** and select the **Latency** graph.\n\n[Go to App Engine dashboard](https://console.cloud.google.com/appengine)\n\nIn the latency graph, you can drill into the data by filtering the graphs by\nservice, version, and interval.\n\nIn the previous image, notice how the application latency varies from a few\nmilliseconds to almost 25s.\n\n### Understanding app latency\n\nTo understand now how long a particular request has taken, go to:\n\n- [Cloud Logging](/logging) to view request logs and application logs.\n- [Cloud Trace](/trace) to track how requests propagate.\n\n#### Cloud Logging\n\nIn Cloud Logging you can find two categories of logs, request logs and\napplication logs. Request logs are automatically written by App Engine\nfor each request to your application and contains the HTTP method, response\ncode, and so forth. Application logs are those that you write for your\napplication.\n\nTo view request logs or application logs, see\n[Viewing logs](/appengine/docs/legacy/standard/go111/writing-application-logs#viewing_logs).\n\n#### Cloud Trace\n\nCloud Trace is useful for understanding how requests propagate through your\napplication. You can inspect detailed latency information for a single request\nor view aggregate latency for your entire application.\n\nTo view trace details in Cloud Trace, you can follow\n[Find and explore traces](/trace/docs/finding-traces).\nIn the [Trace explorer](https://console.cloud.google.com/traces/list), as shown in the following\nimage, you can use the filters to filter by your specific App Engine\nservice and version."]]