本页介绍如何在 Google App Engine 中监控延迟时间以及获取有关延迟时间增加的提醒。
App Engine 应用的延迟时间较长可能有多种原因。例如,应用没有优化代码、资源不足、机器忙碌等等。本指南重点介绍 App Engine 导致的延迟时间,无论原因如何。
请务必注意,较长的延迟时间通常会导致 5xx 错误。因此,快速检测较长的延迟时间可帮助您及时采取行动,从而解决应用错误。
设置监控和提醒
监控
如果要创建自定义图表来监控应用的响应延迟时间,请使用 Cloud Monitoring > Metrics Explorer 构建您自己的图表。
在资源类型中,选择“GAE 应用”,然后在指标过滤条件中选择“响应延迟时间”。如果要检查特定服务,您还可以使用过滤条件按特定模块进行过滤以查看响应延迟时间图表。
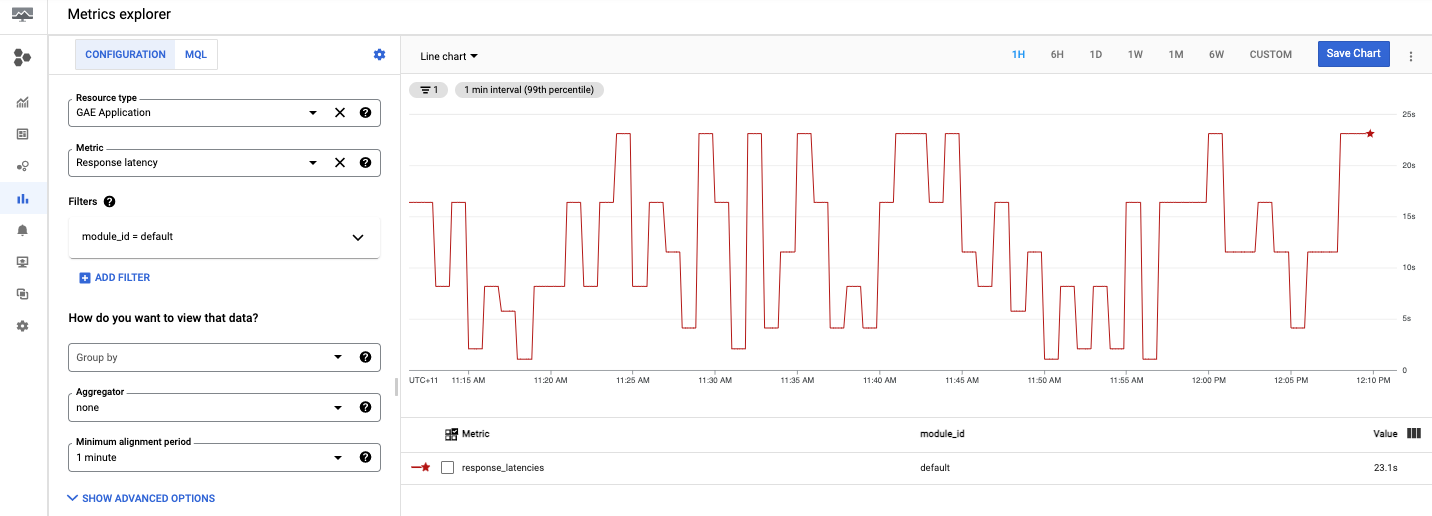
现在您已经设置了自定义图表,我们来看看下一部分,了解如何为若干秒数的延迟时间设置通知。
提醒
如需创建提醒政策,请执行以下操作:
- 设置通知,在 Cloud Monitoring > 提醒中创建提醒政策,然后点击 + 创建政策。
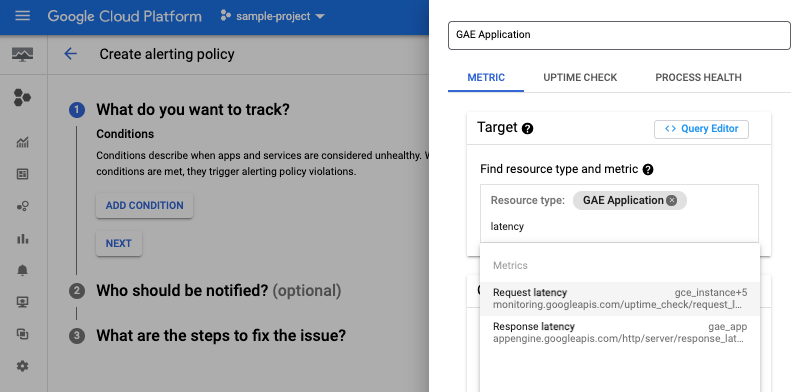
点击添加条件以向提醒添加条件。
选择“GAE 应用”作为目标:
例如,如果您希望收到响应延迟时间提醒(例如 App Engine 应用响应的时长),请选择响应延迟时间。
如有必要,您还可以选择模块 ID,并添加阈值和通知渠道。如需了解相关说明,请参阅管理通知渠道。
创建完政策后,您将在“提醒”页面的列表中看到该政策。点击已创建的政策以查看详细信息,如下图所示:
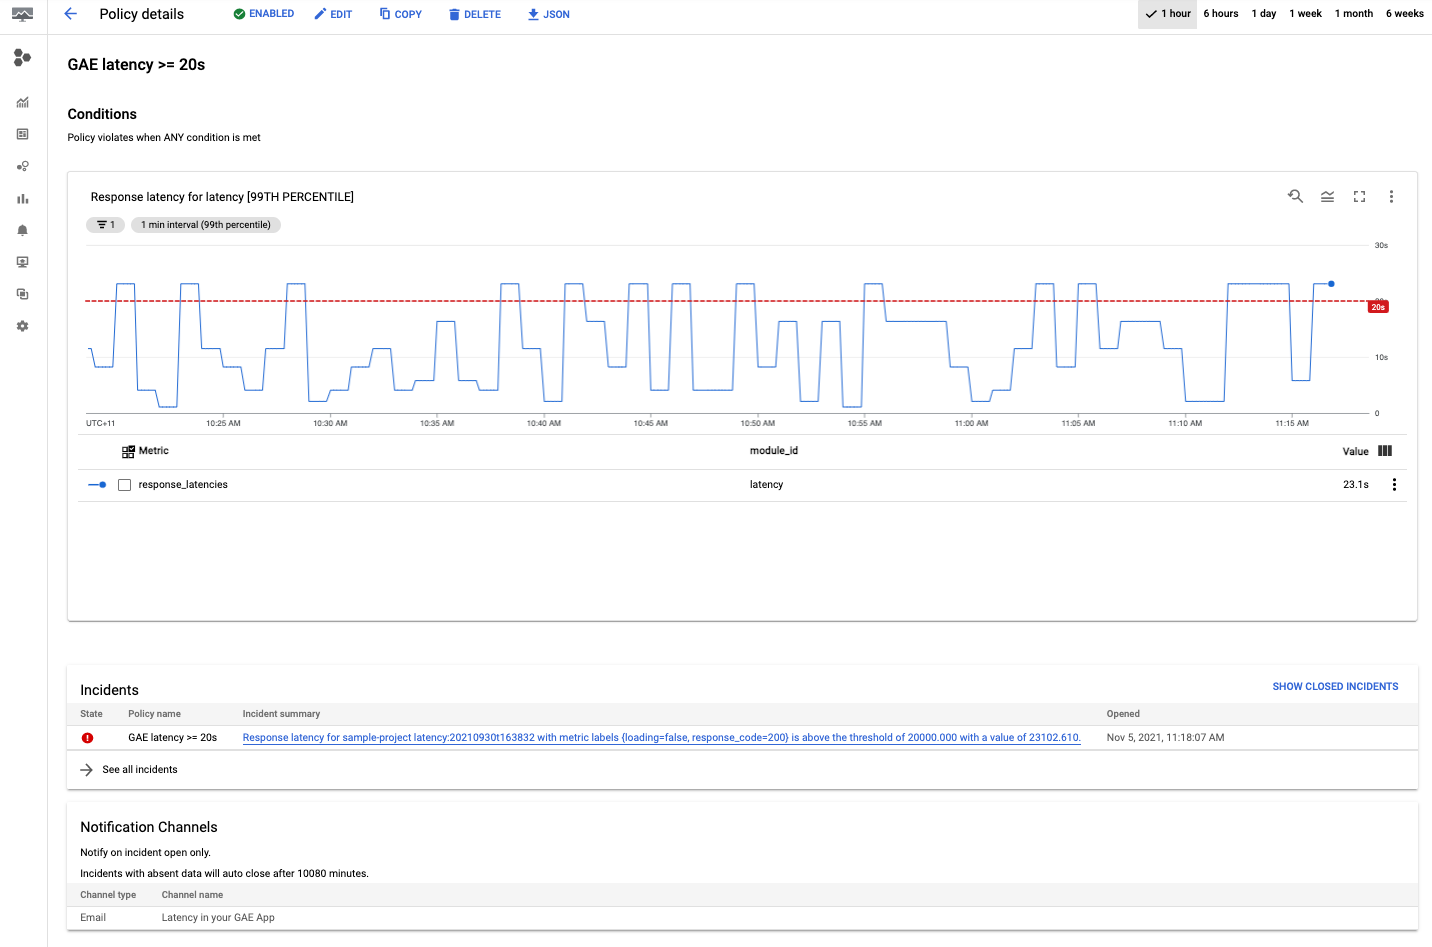
恭喜,您刚刚创建了第一个 App Engine 延迟时间政策!在您创建政策后,如果应用检测到突发事件,则会向所选渠道发送提醒。
调试延迟时间
查看 App Engine 延迟时间信息中心
通常,如果您要查看 App Engine 应用的延迟时间,请转到 App Engine > 信息中心,然后选择延迟时间图表。
在延迟时间图表中,您可以按服务、版本和时间间隔过滤图表来深入了解数据。
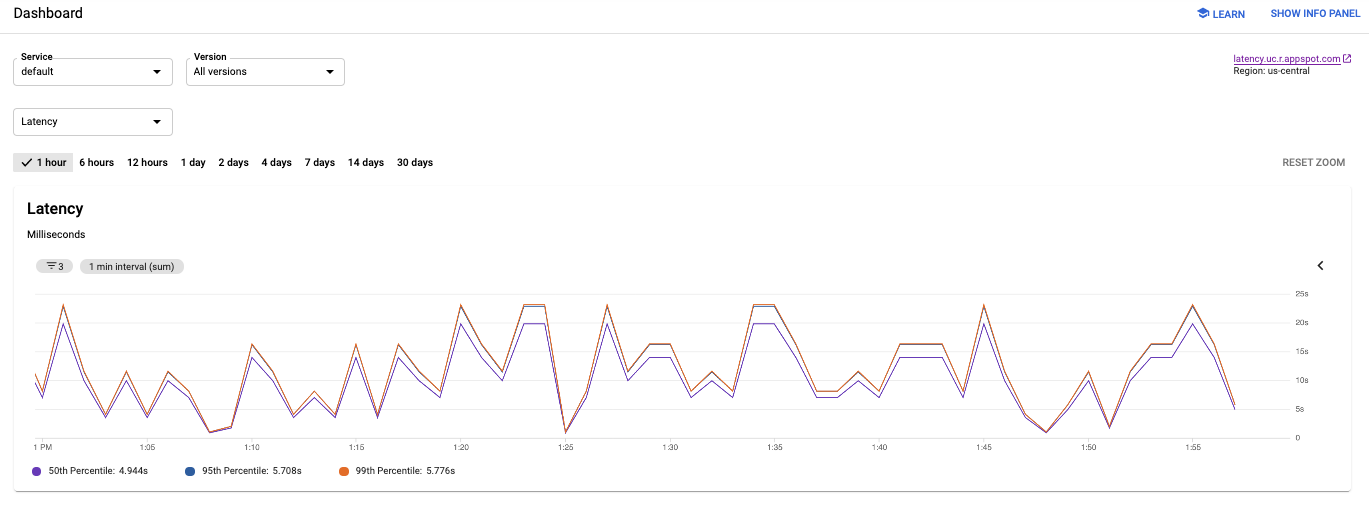
在上图中,请注意应用延迟时间如何从几毫秒变为将近 25 秒。
了解应用延迟时间
如需了解现在特定请求需要多长时间,请转到:
- Cloud Logging,查看请求日志和应用日志。
- Cloud Trace,跟踪请求的传播方式。
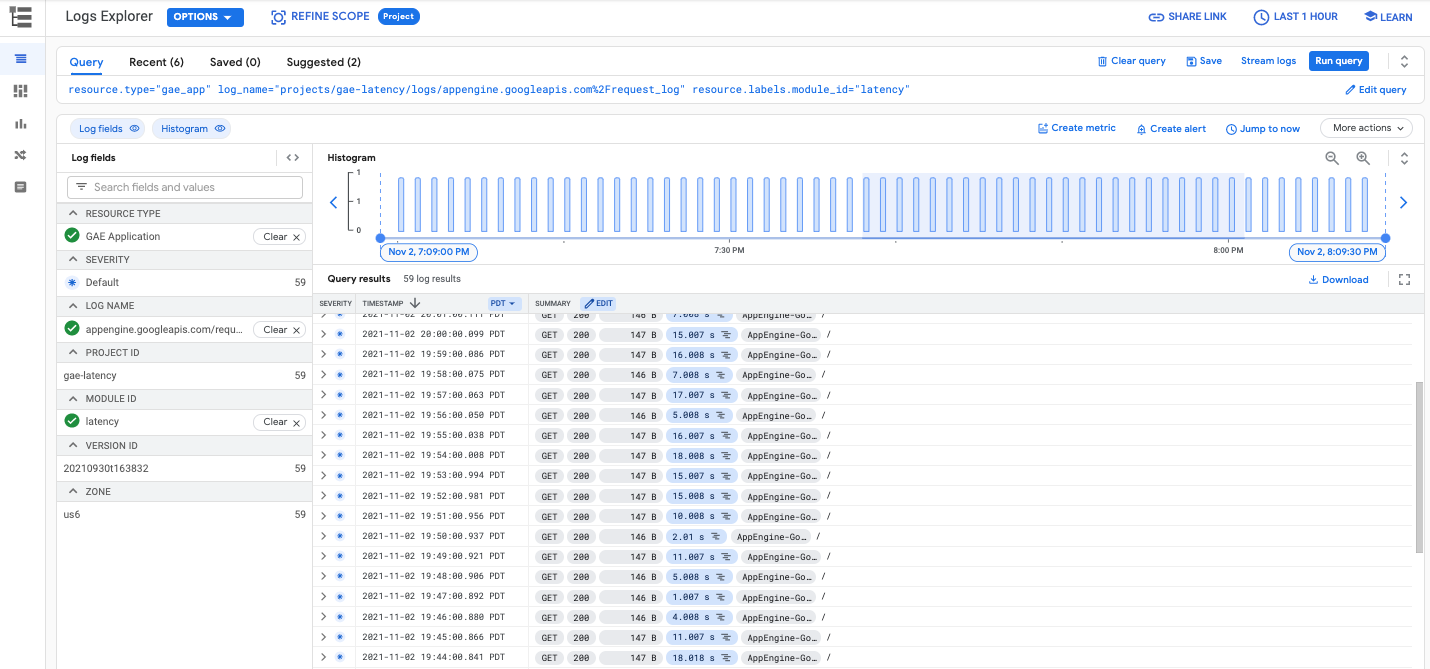
Cloud Logging
在 Cloud Logging 中,您可以找到两类日志:请求日志和应用日志。对于发送到应用的每个请求,App Engine 会自动写入请求日志,其中包含 HTTP 方法、响应代码等。应用日志是您为应用编写的日志。
如需查看请求日志或应用日志,请参阅查看日志。
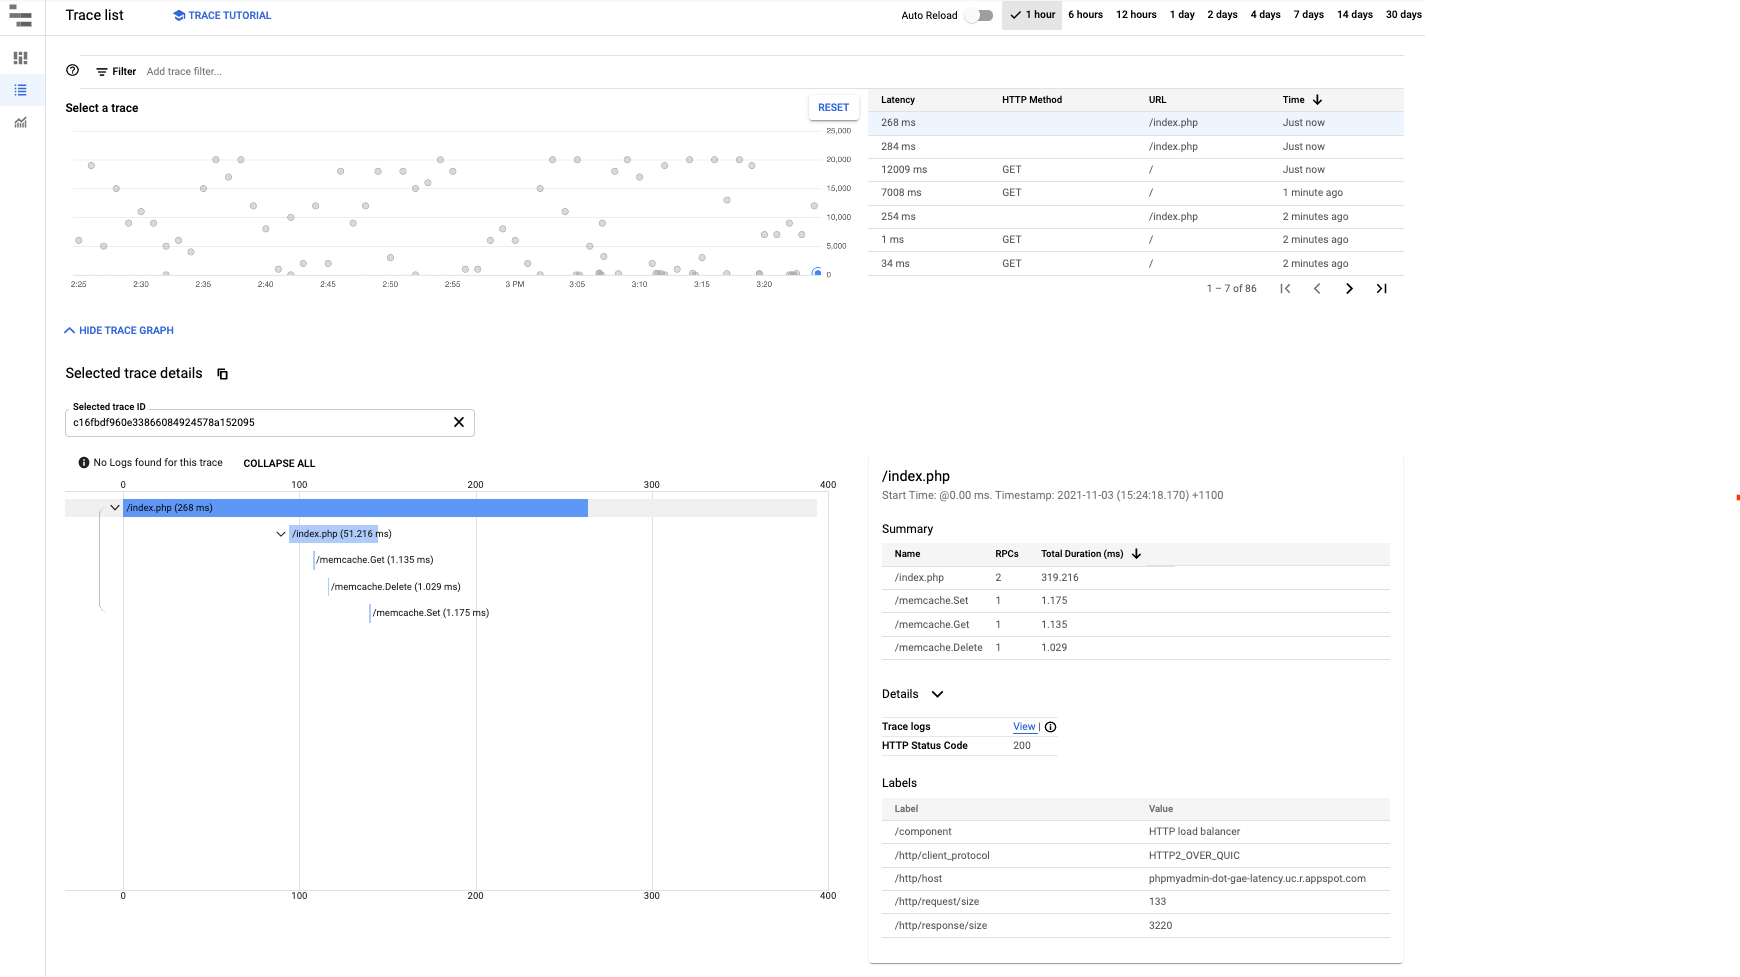
Cloud Trace
Cloud Trace 对于了解请求如何在您的应用中传播非常有用。您可以检查单个请求的详细延迟时间信息,也可以查看整个应用的总体延迟时间。
如需在 Cloud Trace 中查看跟踪记录详细信息,您可以按照查找和探索跟踪记录进行操作。在 Trace 探索器中,如下图所示,您可以使用过滤条件按特定 App Engine 服务和版本进行过滤。