이 페이지에서는 Google App Engine에서 증가한 지연 시간을 모니터링하고 알림을 받는 방법을 설명합니다.
App Engine 앱의 지연 시간이 길어지는 이유에는 여러 가지가 있을 수 있습니다. 예를 들어 앱에 최적화된 코드가 없거나 리소스가 부족하거나 머신의 사용량이 많은 경우가 있습니다. 이 가이드에서는 이유에 관계없이 App Engine에서 생성된 지연 시간을 중점적으로 설명합니다.
지연 시간이 길어지면 5xx 오류가 발생할 수 있다는 점을 이해하는 것이 중요합니다. 따라서 긴 지연 시간을 빠르게 감지할 수 있으므로 제시간에 조치를 취하여 애플리케이션 오류를 해결할 수 있습니다.
모니터링 및 알림 설정
모니터링
앱의 응답 지연 시간을 모니터링할 맞춤설정된 그래프를 만들려면 Cloud Monitoring > 측정항목 탐색기를 사용하여 자체 그래프를 빌드합니다.
리소스 유형에서 GAE 애플리케이션을 선택하고 측정항목 필터에서 응답 지연 시간을 선택합니다. 확인할 특정 서비스가 있으면 필터를 사용하여 특정 모듈별로 필터링하여 응답 지연 시간 차트를 볼 수도 있습니다.
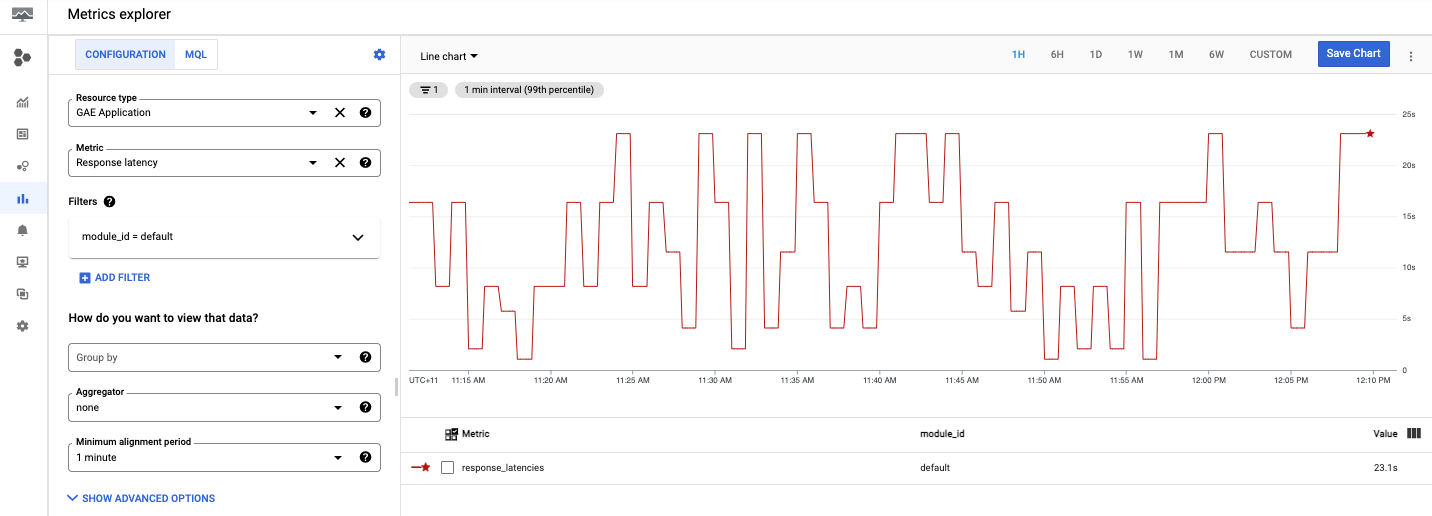
이제 맞춤설정된 그래프를 설정했으므로 다음 섹션을 살펴보고 특정 시간 동안 지연 시간에 대한 알림을 설정하는 방법을 알아보세요.
알림
알림 정책을 만들려면 다음 안내를 따르세요.
- Cloud Monitoring > 알림에서 알림을 설정하고 알림 정책을 만든 후 + 정책 만들기를 클릭합니다.
조건 추가를 클릭하여 알림에 조건을 추가합니다.
GAE 애플리케이션을 대상으로 선택합니다.
예를 들어 App Engine 앱이 응답하는 데 걸리는 시간과 같은 응답 지연 시간에 대한 알림을 받으려면 응답 지연 시간을 선택합니다.
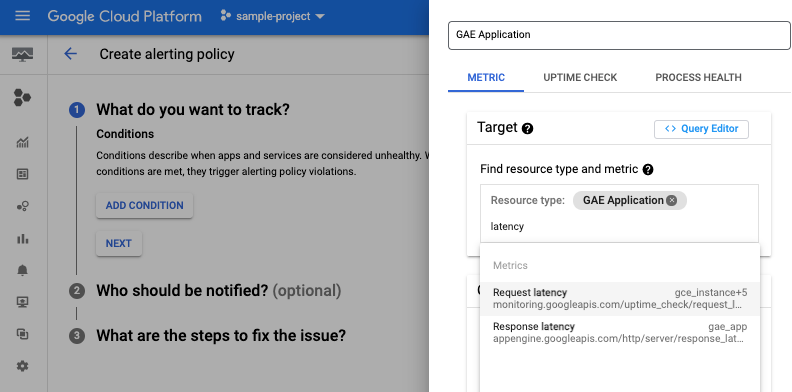
모듈 ID를 적절히 선택하고 기준과 알림 채널을 추가할 수도 있습니다. 자세한 내용은 알림 채널 관리를 참조하세요.
정책 만들기가 완료되면 알림 페이지의 목록에 정책이 표시됩니다. 생성된 정책을 클릭하여 다음 이미지와 같이 세부정보를 확인합니다.
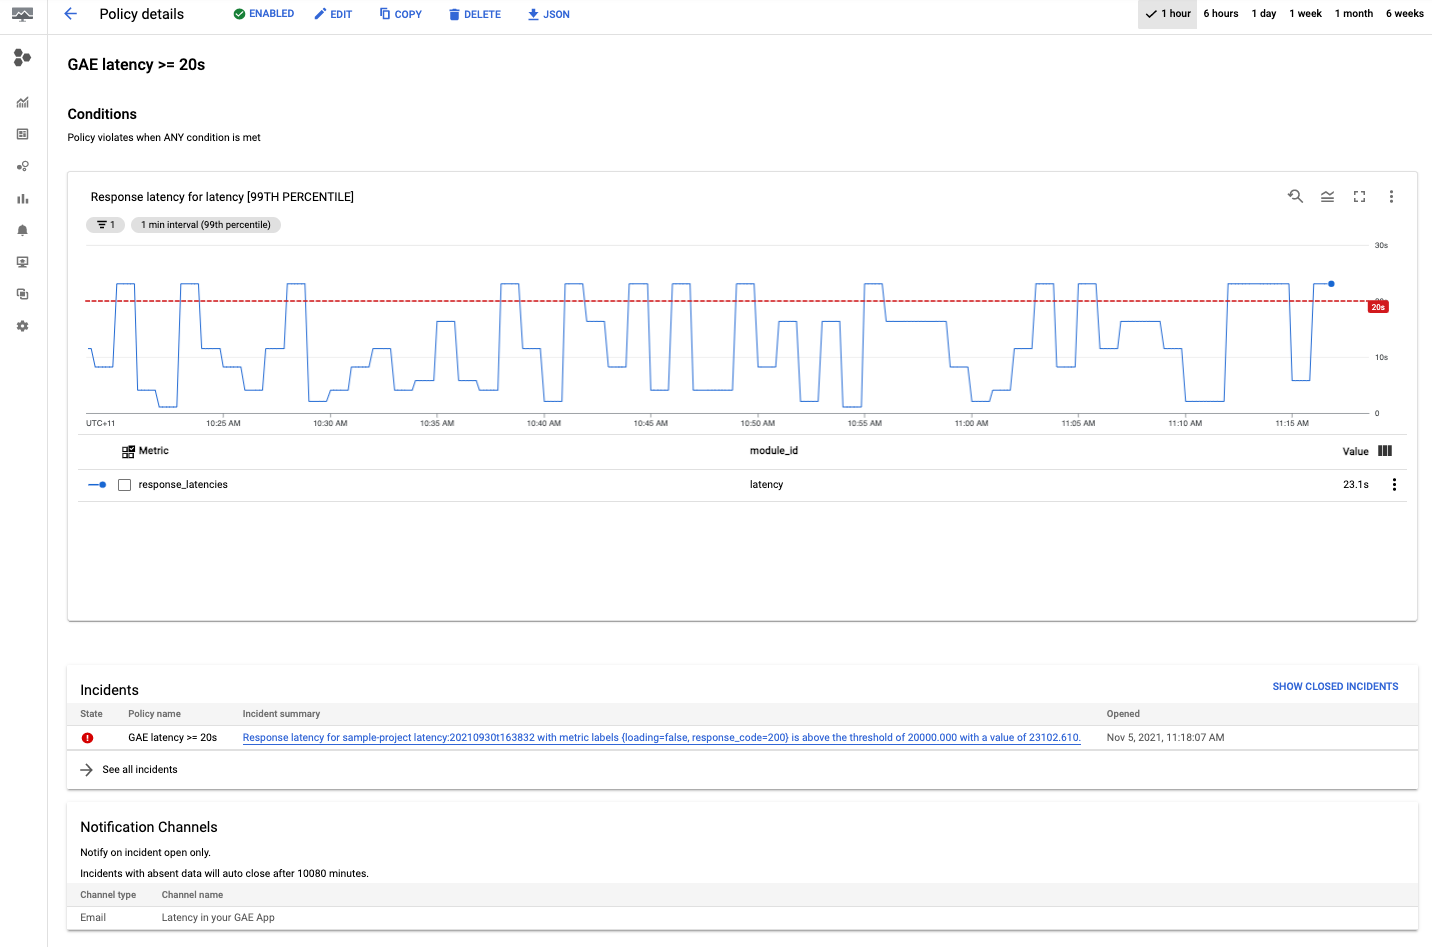
수고하셨습니다. 첫 번째 App Engine 지연 시간 정책이 생성되었습니다. 정책을 만든 후 이슈가 감지되면 앱에서 선택한 채널에 알림을 보냅니다.
디버깅 지연 시간
App Engine 지연 시간 대시보드 확인
일반적으로 App Engine 애플리케이션의 지연 시간을 확인하려면 App Engine > 대시보드로 이동하고 지연 시간 그래프를 선택합니다.
지연 시간 그래프에서 서비스, 버전, 간격별로 그래프를 필터링하여 데이터를 상세히 살펴볼 수 있습니다.
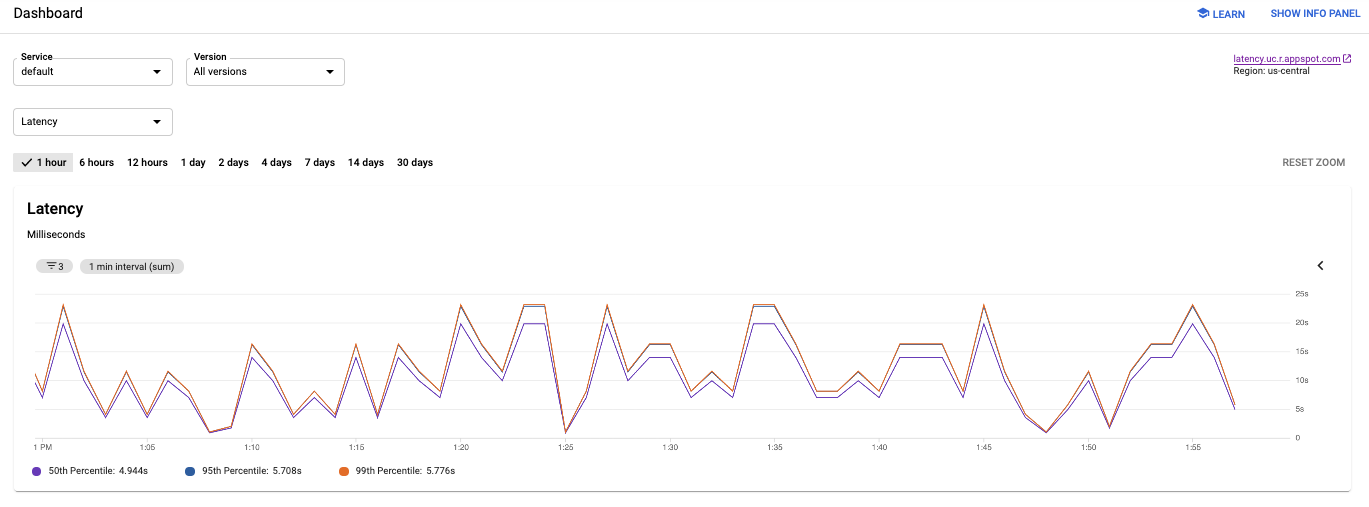
이전 이미지에서 애플리케이션 지연 시간이 몇 밀리초에서 거의 25초로 어떻게 변하는지 확인합니다.
앱 지연 시간 이해
특정 요청에 걸린 시간을 확인하려면 다음으로 이동하세요.
- 요청 로그 및 애플리케이션 로그를 보려면 Cloud Logging으로 이동합니다.
- 요청이 어떻게 전파되는지 추적하려면 Cloud Trace로 이동합니다.
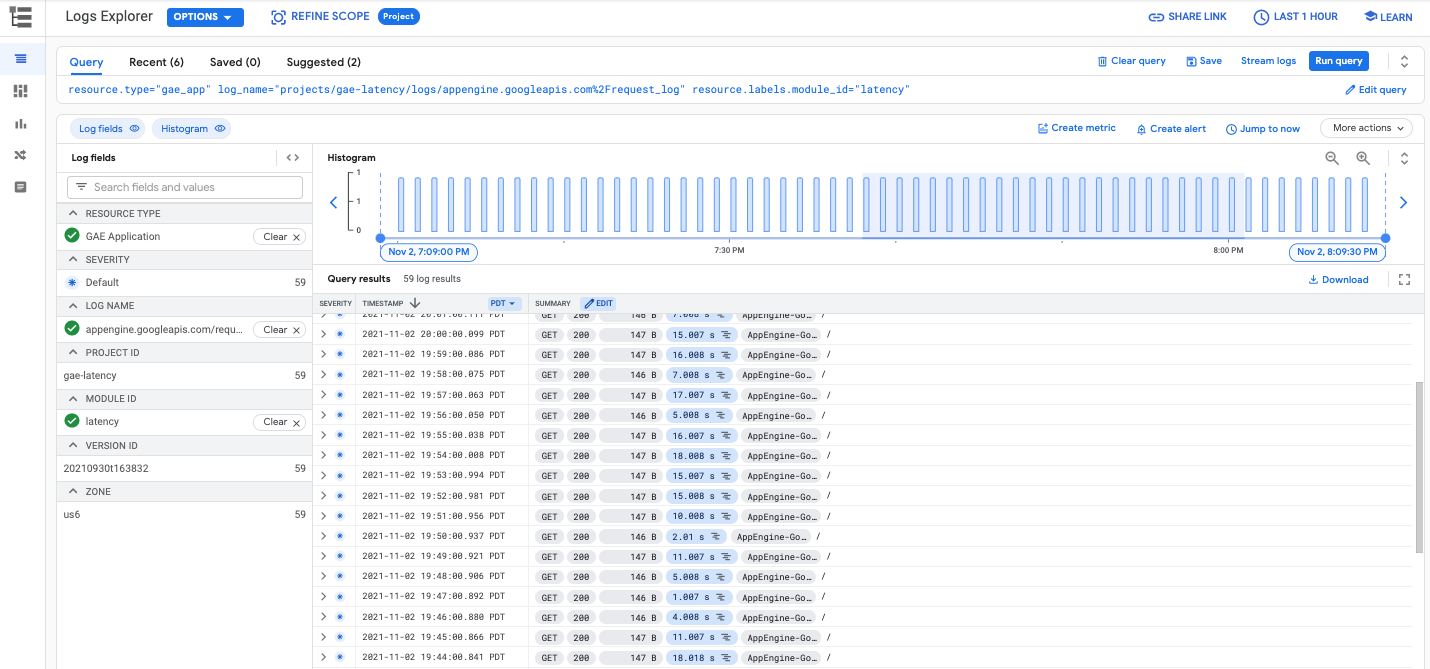
Cloud Logging
Cloud Logging에서 요청 로그와 애플리케이션 로그의 두 가지 로그 카테고리를 찾을 수 있습니다. 요청 로그는 애플리케이션에 대한 각 요청마다 App Engine에서 자동으로 작성되며, HTTP 메서드, 응답 코드 등을 포함합니다. 애플리케이션 로그는 애플리케이션에 대해 작성하는 로그입니다.
요청 로그나 애플리케이션 로그를 보려면 로그 보기를 참조하세요.
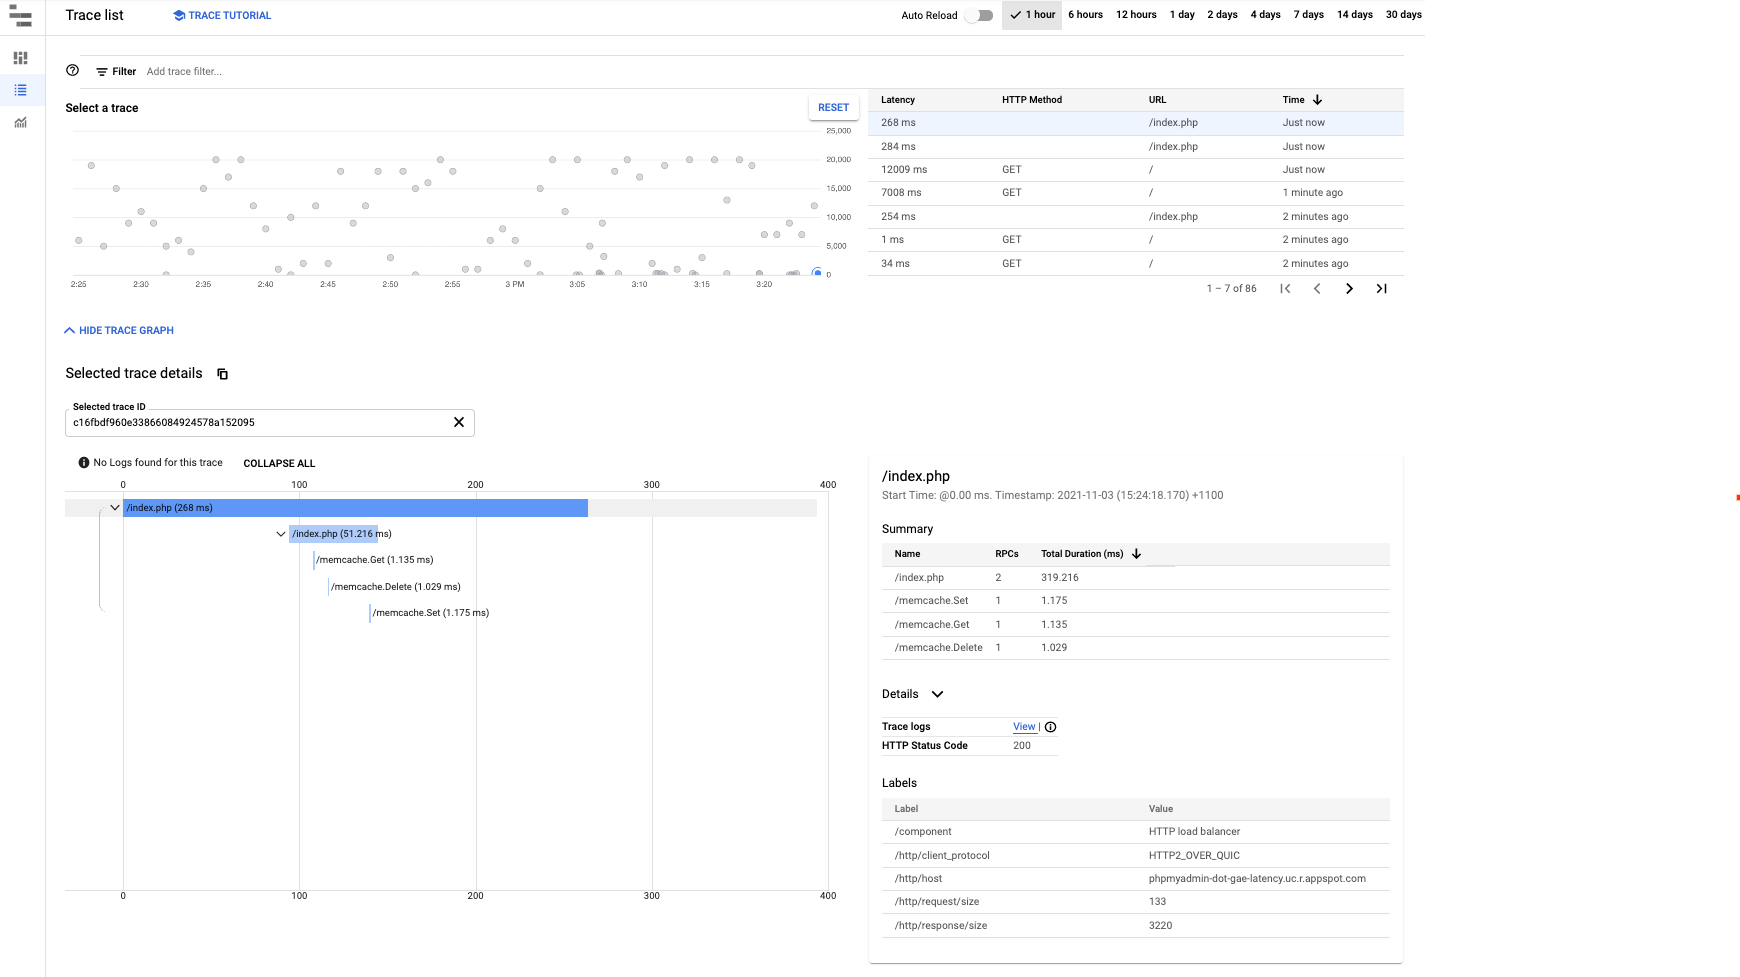
Cloud Trace
Cloud Trace는 요청이 애플리케이션을 통해 전파되는 방식을 이해하는 데 유용합니다. 단일 요청의 상세 지연 시간 정보를 조사하거나 애플리케이션 전반의 지연 시간 합계를 확인할 수 있습니다.
Cloud Trace에서 trace 세부정보를 보려면 trace 찾기 및 탐색을 따르면 됩니다. 다음 이미지와 같이 Trace 탐색기에서 필터를 사용하여 특정 App Engine 서비스 및 버전을 기준으로 필터링할 수 있습니다.