Cloud Code pour IntelliJ vous permet de déboguer facilement vos applications déployées sur un cluster Kubernetes. Vous pouvez déboguer une application sur un cluster local (Minikube ou Docker Desktop, par exemple), Google Kubernetes Engine ou tout autre fournisseur cloud.
Grâce à l'assistance au débogage proposée par Cloud Code, vous pouvez ignorer les étapes de configuration manuelle, comme la configuration du transfert de port, l'installation d'un backend de débogage ou l'injection correcte d'arguments de débogage spécifiques à un langage. Vous avez seulement besoin d'une application Kubernetes compatible avec Cloud Code et comprenant un fichier de configuration skaffold.yaml.
Cloud Code vous permet également de déboguer une application tout en modifiant et en itérant le code source.
IDE compatibles
Le tableau suivant répertorie les langages et les IDE compatibles avec Cloud Code pour le débogage. Le tableau liste également les plug-ins requis, le cas échéant :
| Langue | Éditions et IDE compatibles | Plug-in requis |
|---|---|---|
| Java | IntelliJ IDEA Ultimate | N/A |
| IntelliJ IDEA Community | N/A | |
| Go | IntelliJ IDEA Ultimate | Plug-in Go |
| GoLand | N/A | |
| Node.js | IntelliJ IDEA Ultimate | Plug-in Node.js |
| WebStorm | N/A | |
| Python | IntelliJ IDEA Ultimate | Plug-in Python |
| PyCharm Professional | N/A |
Pour en savoir plus sur la compatibilité avec les IDE, consultez IDE JetBrains compatibles.
Avec Cloud Code, vous pouvez définir des points d'arrêt et déboguer les applications distantes exécutées dans des conteneurs pour les langages suivants :
Java
Cloud Code ajoute automatiquement une variable d'environnement, JAVA_TOOL_OPTIONS, avec la configuration JDWP appropriée pour permettre le débogage. Si JAVA_TOOL_OPTIONS est déjà présent, Cloud Code utilise les paramètres existants spécifiés dans JAVA_TOOL_OPTIONS.
Node.js
Selon la structure de votre application et sa configuration de compilation d'images, vous devrez peut-être aider le débogueur à mapper vos sources locales avec les sources distantes du conteneur. Cela permet au débogueur de nœud de traiter correctement vos points d'arrêt.
Pour ce faire, procédez de l'une des façons suivantes :
Configuration manuelle
Sélectionnez la configuration d'exécution Develop on Kubernetes (Développer sur Kubernetes) dans la liste déroulante, puis cliquez sur Edit Configurations (Modifier les configurations). Dans l'onglet Débogage, configurez le mappage de source de votre source d'application locale avec l'emplacement source dans le conteneur distant.
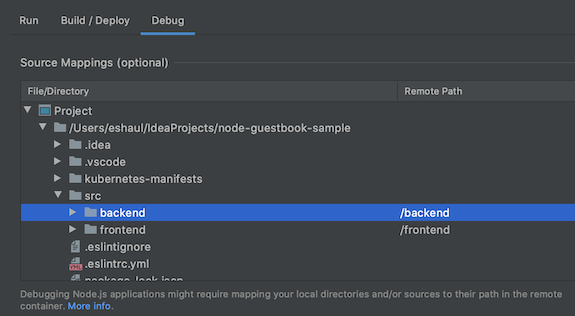
Options de configuration :
- File/Directory (Fichier/Répertoire) : fichier ou répertoire local de votre application s'exécutant sur Kubernetes.
- Remote Path (Chemin d'accès à distance) : chemin d'accès au fichier ou au répertoire exécuté dans le conteneur sur Kubernetes.
Configuration automatique
Vous pouvez choisir de déléguer ce mappage à Cloud Code. Lorsque vous démarrez votre session de débogage, Cloud Code tente de déduire automatiquement ce mappage. Le mappage déduit vous sera présenté dans une boîte de dialogue (une boîte de dialogue pour chaque artefact que vous déboguez).
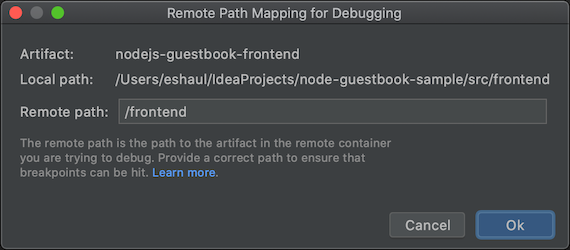
Options de configuration :
- Local path (Chemin d'accès local) : chemin d'accès local à la racine de l'artefact que vous déboguez.
- Remote Path (Chemin d'accès à distance) : chemin d'accès au fichier ou au répertoire exécuté dans le conteneur sur Kubernetes. Vous pouvez choisir de remplacer ce paramètre par votre propre valeur. Si vous cliquez sur Annuler, aucun mappage n'est appliqué.
Go
Pour configurer votre application pour le débogage, elle doit être une application à base de Modules Go et être identifiée en tant que telle en définissant l'une des Variables d'environnement d'exécution Go standard dans le conteneur, par exemple GODEBUG, GOGC, GOMAXPROCS ouGOTRACEBACK. GOTRACEBACK=single est le paramètre par défaut pour Go, et GOTRACEBACK=all est une configuration généralement utile.
Si possible (mais recommandé), votre application doit être créée avec les options -gcflags='all=-N -l' pour désactiver les optimisations. Les profils Skaffold sont une option utile à cette fin. Ils peuvent être définis à l'aide du champ Deployment Profile (Profil de déploiement) de votre configuration d'exécution dans l'onglet Build/Deploy (Compilation/Déploiement).
Python
Pour configurer votre application pour le débogage, assurez-vous de remplir les conditions préalables suivantes :
IDE, édition et plug-in compatibles
Pour connaître les IDE, les éditions et les plug-ins compatibles, consultez la section IDE compatibles.
Version Skaffold 1.25.0 ou ultérieure
Vous pouvez autoriser Cloud Code à gérer vos dépendances ou pointer vers une installation Skaffold locale. Consultez la section Préférences > Outils > Cloud Code > Dépendances.
L'interpréteur Python est configuré
Sans interpréteur Python configuré dans votre projet, le débogage ne fonctionne pas car il n'existe aucun moyen d'exécuter
pydevd, le débogueur Python sous-jacent.IDE Procédure de configuration IntelliJ IDEA Le débogage Python avec Cloud Code nécessite la configuration d'un SDK Python pour votre projet.
Accédez à Fichier > Structure du projet et ajoutez un SDK Python dans l'onglet Projet. S'il n'en existe pas, ajoutez-en un dans l'onglet SDK.PyCharm Accédez à Fichier > Paramètres > Projet > Interpréteur Python ou pour macOS X, PyCharm > Préférences > Projet > Interpréteur Python, puis ajoutez un interpréteur Python.
Pour en savoir plus, consultez la documentation sur le débogage de Skaffold.
Déboguer une application
Pour démarrer le cycle de développement en mode de débogage sur votre cluster Kubernetes, cliquez sur l'action de débogage pour
 Développer sur Kubernetes.
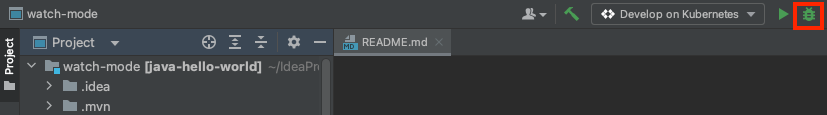
Le cycle de développement continu se lance en mode débogage.
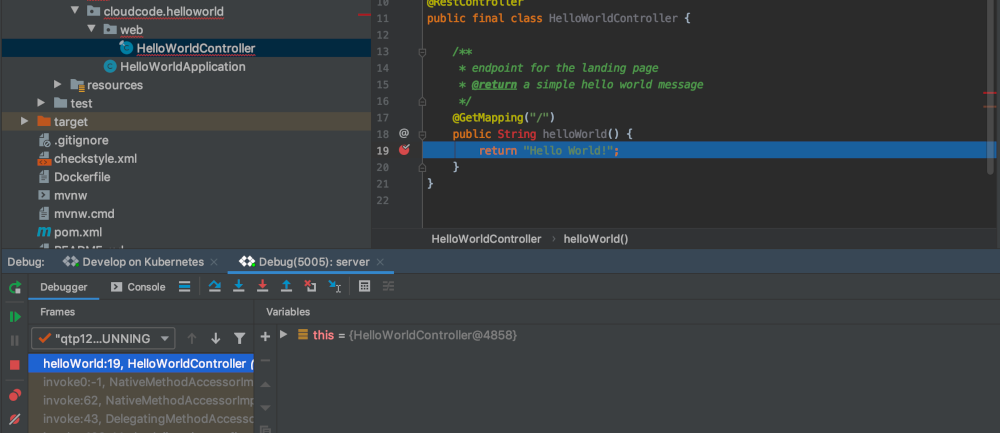
Cloud Code associe une session de débogage :
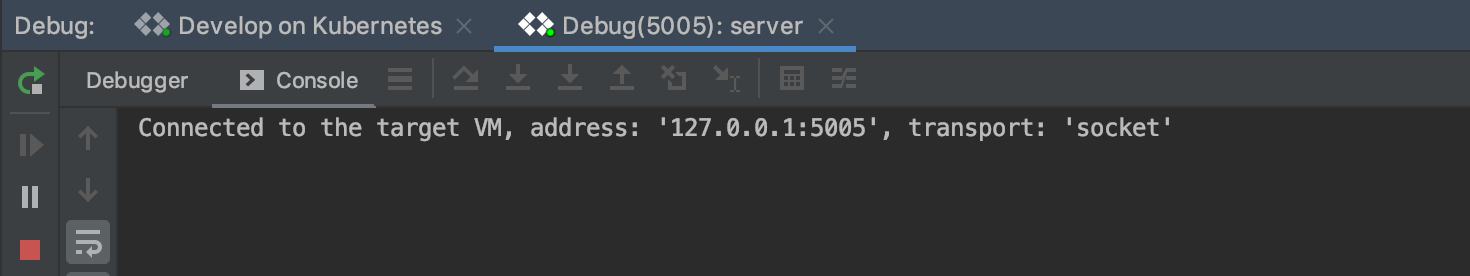
Vous pouvez désormais effectuer vos tâches habituelles de débogage de code local, telles que la définition de points d'arrêt et le passage en revue du code, sur un cluster Kubernetes en service.
Pour mettre fin à la session de débogage, cliquez sur l'icône d'arrêt dans la configuration d'exécution Develop on Kubernetes (Développer sur Kubernetes).
Étapes suivantes
- Utilisez la synchronisation des fichiers et le rechargement à chaud pour accélérer le développement.
- Configurez un environnement de développement continu dans Cloud Code.
- Afficher les journaux Kubernetes dans Cloud Code