This section describes how to perform operations on the data profiles that are generated by the Sensitive Data Protection discovery service.
For more information about the discovery service, see Data profiles.
Before you begin
Confirm that you have the IAM permissions that are required to work with scan configurations and data profiles at the organization or project level.
View the data profiles
To respect data residency, Sensitive Data Protection doesn't combine profiles that reside in different regions. Consequently, in the Google Cloud console, you can only see data profiles for the region that you select.
If you want to create or view reports that combine data profiles across regions into a single view, export your data profiles to BigQuery. This feature lets you query the data profiles in BigQuery and generate a premade report in Looker.
To view the data profiles in the Google Cloud console, follow these steps:
Go to the Sensitive Data Protection discovery profiles page.
Make sure you're viewing the correct organization or project:
- If you generated the data profiles through an organization-level or folder-level scan, then view the organization.
- If you generated the data profiles using a project-level scan, then view the proper project.
To switch to a different view, on the toolbar, click the project selector. Then, select the organization or project that you want to view.
Data profiles generated through a project-level scan only appear in the project view and are not combined with the results of organization-level or folder-level scans. Conversely, data profiles generated through an organization-level or folder-level scan only appear in the organization view.
In the Location list, select the region that contains the data profiles that you want to view. Each data profile is stored in the same region as the data it pertains to.
The page loads the data profiles. On this page, you can view data profiles at various levels.
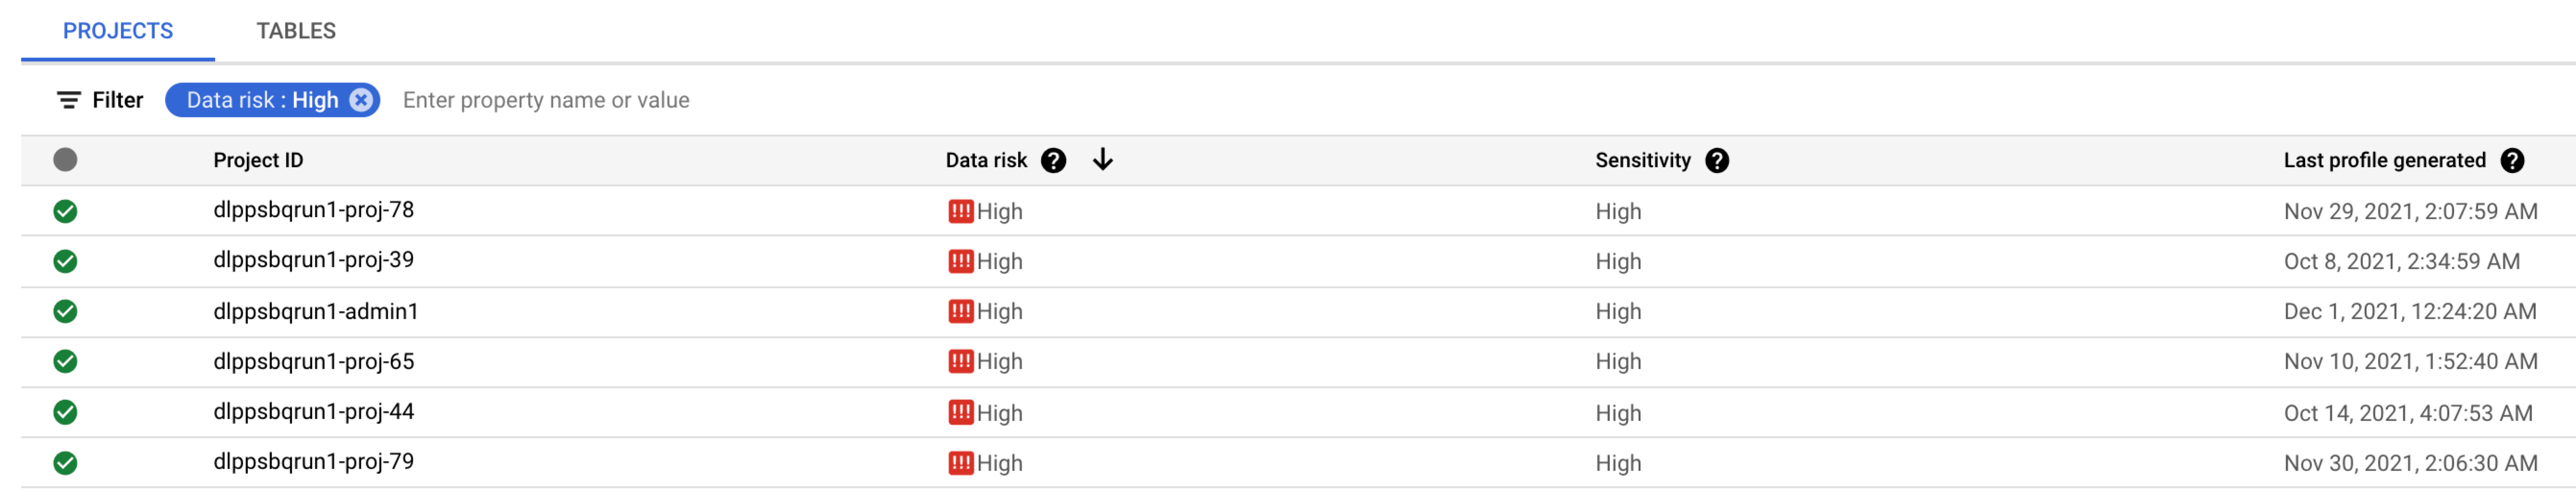
Projects view
On the Projects tab, each project that has data that was scanned in your selected region represents one data profile.
The following image shows a list of project data profiles. Click the image to enlarge it.
Each project data profile is an aggregation of the metrics gathered from data assets that meet both of the following criteria:
- Data assets that belong to that project.
- Data assets that reside in the selected region in the Google Cloud console.
Thus, it's possible to have two or more data profiles for the same project—one for each region. Those project data profiles can have different risk and sensitivity levels.
Consider this example: Project A has tables in the us-west1 and us-west2
regions. If you view your project data profiles in the us-west1 region, there
is a data profile for Project A. It includes only the metrics gathered from
Project A's tables in the us-west1 region. If you switch to the us-west2
region, another data profile for Project A is available. It shows only data that
is related to Project A's tables in the us-west2 region.
For more information about the metrics gathered in project data profiles, see Project-level data profiles.
Tables view
On the Tables tab, each table that was scanned in your selected region represents one data profile.
The following image shows a list of table data profiles. Click the image to enlarge it.

To view the details of a table data profile, click anywhere in its row. Alternatively, click Actions > View details. The details view also shows the column-level data profiles for the table.
To go back to the Tables tab from the columns view, click Sensitive Data Discovery: Table profile details.
For more information on the metrics gathered in table data profiles, see Table-level data profiles.
Columns view
When you click a table data profile in the Tables tab, the columns view appears. In this view, each column of a table that was scanned in your selected region represents one data profile.
The following image shows a list of column data profiles. Click the image to enlarge it.

To view the profile details of a particular column, click Actions and then click View details.
- To go back to the Tables tab from the columns view, click Sensitive Data Discovery: Table profile details.
For more information on the metrics gathered in column data profiles, see Column-level data profiles.
File stores view
On the File stores tab, each file store that was scanned in your selected region represents one data profile. Sensitive Data Protection uses the term file store to refer to a file storage bucket or container.
To view the details of a file store data profile, click anywhere in its row. Alternatively, click Actions > View details.
To go back to the File stores tab, click Sensitive Data Discovery: File store profile details.
For more information on the metrics gathered in file store data profiles, see File store data profiles.
Force a reprofile operation
To force a reprofile operation on a data asset, you delete the asset's table data profile or file store data profile. If the data asset is in the scope of an active scan configuration, the data asset is reprofiled automatically. Otherwise, you must create a scan configuration that includes the data asset.
Multiple data profiles are regenerated when you reprofile your data:
- Reprofiling a table causes the table data profile, column data profiles, and project data profile to be regenerated.
- Reprofiling a file store causes the file store data profile and project data profile to be regenerated.
You might perform this task in the following situations:
- You want to reprofile your data without first introducing a change in it.
- You want to reprofile your data before the next scheduled discovery scan.
To reprofile a data asset, follow these steps:
- View the details of the table data profile or file store data profile that you want to regenerate.
- Click Delete.
- Review the confirmation message that appears, and click Delete. The data profile is deleted.
- If no active scan configuration includes the table or file store, create one.
Perform a deep inspection on a BigQuery table or Cloud Storage bucket
If you profiled a BigQuery table or Cloud Storage bucket and you want to learn more about the data asset's contents, you can perform a deep inspection.
To inspect a data asset that was profiled, follow these steps:
- View the details of the data profile.
- Click Create inspection job.
- Fill in the details of the inspection job that you want to perform. For more information on filling in this form, see Inspect Google Cloud storage and databases for sensitive data.
What's next
- Learn how to manage scan configurations.
- Learn how to analyze the data profiles.