This page provides an overview of Security Command Center Enterprise navigation and what you can do with Security Command Center's top-level pages. If you are using Security Command Center Standard or Premium, see Using Security Command Center Standard or Premium in the Google Cloud console.
If Security Command Center is not active, you are invited to activate it. For more information about activating Security Command Center Enterprise, see Activate the Security Command Center Enterprise tier.
Required IAM permissions
To use Security Command Center with all service tiers, you must have an Identity and Access Management (IAM) role that contains appropriate permissions:
- Security Center Admin Viewer (
roles/securitycenter.adminViewer) lets you view Security Command Center. - Security Center Admin Editor (
roles/securitycenter.adminEditor) lets you view Security Command Center and make changes. - Chronicle Service Viewer (
roles/chroniclesm.viewer) lets you view the associated Google SecOps instance.
If your organization policies are set to restrict identities by domain, you must sign in to the Google Cloud console on an account that's in an allowed domain.
The IAM roles for Security Command Center can be granted at the organization, folder, or project level. Your ability to view, edit, create, or update findings, assets, and security sources depends on the level for which you are granted access. To learn more about Security Command Center roles, see Access control.
You also need any of the following IAM roles:
- Chronicle SOAR Admin (
roles/chronicle.soarAdmin) - Chronicle SOAR Threat Manager (
roles/chronicle.soarThreatManager) - Chronicle SOAR Vulnerability Manager
(
roles/chronicle.soarVulnerabilityManager)
To enable access to SOAR-related features, you must also map these Identity and Access Management roles to a SOC role, Permission group and Environment on the Settings > SOAR settings page. For more information, see Map and authorize users using IAM.
Access Security Command Center in the Google Cloud console
You can access the Security Command Center content in the Google Cloud console from the Risk Overview page.
Go to Security Command Center:
Select the organization where you activated Security Command Center Enterprise.
If Security Command Center is active in the organization or project you select, the Risk overview page displays with an overview.
Security Command Center features and navigation
The following describes the navigation in Security Command Center Enterprise. If you use Security Command Center Standard or Premium, see Using Security Command Center Standard or Premium in the Google Cloud console.
The tasks that you can perform are dependent on your Security Command Center service tier, which services are enabled, and the permissions in the IAM role you have been granted.
Security Command Center Enterprise left navigation includes links to pages in the Google Security Operations tenant that was configured during Security Command Center Enterprise activation.
In addition, the Google Security Operations tenant configured during Security Command Center Enterprise activation includes links to a subset of Google Cloud console pages.
To see which Google Security Operations features are available with Security Command Center Enterprise, see Security Command Center service tiers. Click a link for an explanation of the page.
| Google Cloud console navigation section | Link |
|---|---|
| Risk | |
| Investigation | |
| Detection | |
| Response | |
| Dashboards | |
| Settings |
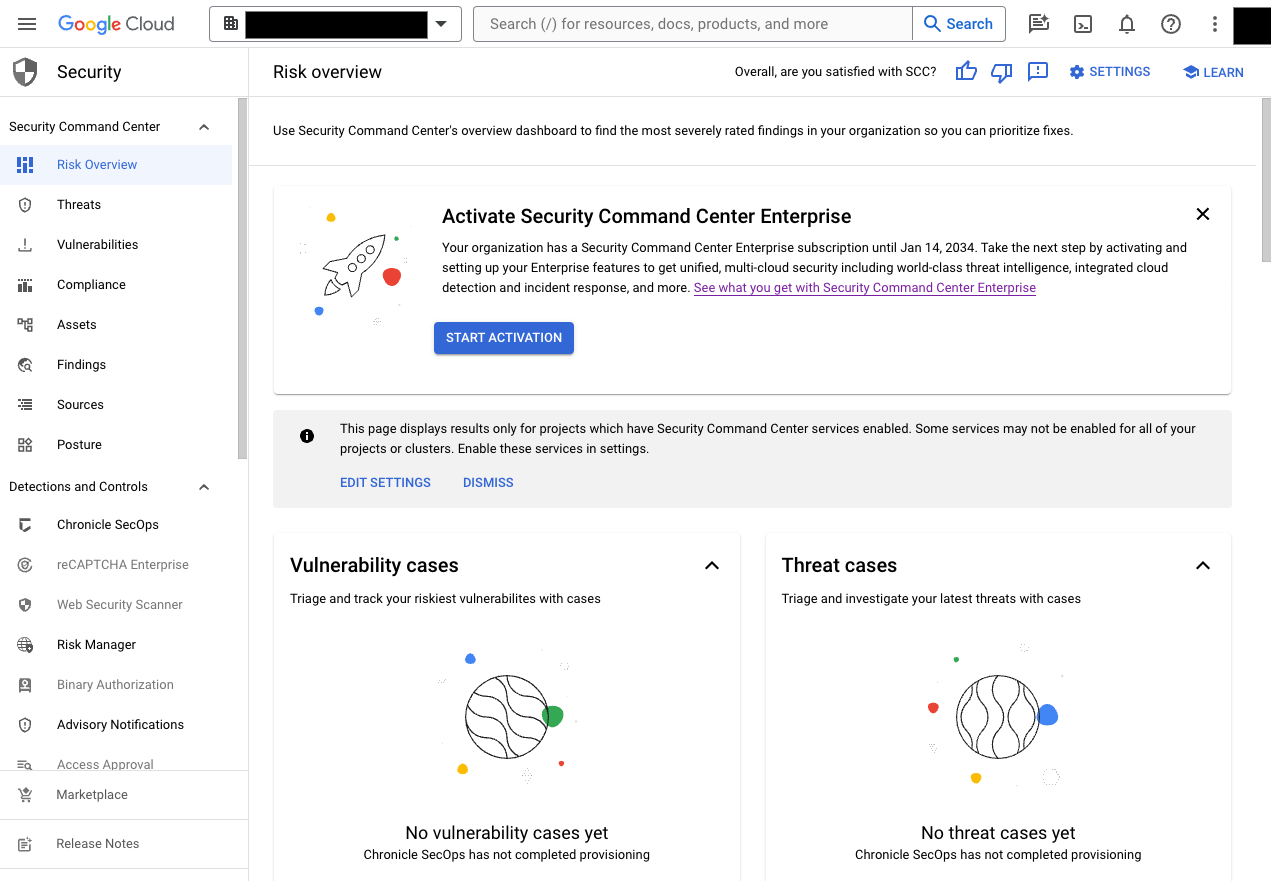
Risk overview page
The Risk overview page provides a quick view of both the new threats and the total number of active vulnerabilities in your Google Cloud environment from all built-in and integrated services.
The Risk overview page serves as your first contact security dashboard, highlighting high-priority risks in your cloud environments. You can view detail about individual investigative areas in Overview by selecting one of the following views:
All risk: shows all data.
CVE Vulnerabilities: displays vulnerabilities and related CVE information.
Data: displays information about your data security posture (Preview).
Code: shows code-related security findings.
AI Security: shows AI-related findings and security posture data.
Issues page
Issues are the most important security risks Security Command Center Enterprise finds in your cloud environments, giving you the opportunity to respond quickly to vulnerabilities and threats. Security Command Center discovers issues through virtual red teaming and rule-based detections. For information about investigating issues, see Issues overview.
Findings page
On the Findings page, you can query, review, mute, and mark Security Command Center findings, the records that Security Command Center services create when they detect a security issue in your environment. For more information about how to work with findings on the Findings page, see Review and manage findings.
Assets page
The Assets page provides a detailed display of all Google Cloud resources, also called assets, in your project or organization.
For more information about how to work with assets on the Assets page, see Work with resources in the console.
Compliance page
By default, when you activate Security Command Center, the Compliance page shows the Monitor tab. This tab shows all regulatory frameworks that Security Command Center supports using Security Health Analytics and the percentage of passing benchmark controls.
The Monitor tab lets you see each regulatory framework and provides additional details about which regulatory controls Security Health Analytics checks, the number of violations detected for each control, and an option to export a compliance report for that regulatory framework.
Security Health Analytics vulnerability scanners monitor for violations of common compliance controls based on a best effort mapping provided by Google. Security Health Analytics compliance reports are not a replacement for a compliance audit, but can help you maintain your compliance status and catch violations early.
When you enable Compliance Manager (Preview) for Security Command Center Enterprise, the Compliance page shows the following additional tabs: Configure (Preview), Monitor (Preview), and Audit (Preview). These tabs let you create and apply cloud controls and frameworks, monitor your environment, and complete audits.
For more information about how Security Command Center supports compliance management if Compliance Manager isn't enabled, see Manage compliance.
Posture management page
On the Posture page, you can view details about the security postures that you created in your organization and apply the postures to an organization, folder, or project. You can also view the available predefined posture templates.
SIEM search
This Security Operations console page lets you find Unified Data Model (UDM) events and alerts within your Google Security Operations instance. For more information, see SIEM search in Google Security Operations documentation.
SOAR search
This Security Operations console page lets you find specific cases or entities indexed by Google Security Operations SOAR. For more information, see Work with the Search page in SOAR in Google Security Operations documentation.
Rules & Detections
This Security Operations console page lets you enable curated detections and create custom rules to identify patterns in data collected using the Security Operations console log data collection mechanisms. For information about the curated detections available with Security Command Center Enterprise, see Investigate threats with curated detections.
Alerts & IOCs
This Security Operations console page lets you view alerts created by curated detections and custom rules. For information about investigating alerts, see the following in Google Security Operations documentation:
- Investigating a GCTI alerts generated by curated detections.
- Investigating an alert.
Playbooks
This Security Operations console page lets you manage playbooks included in the SCC Enterprise - Cloud Orchestration and Remediation use case.
For information about the integrations available in this use case, see Security Command Center service tiers.
For information about the available playbooks, see Update the Enterprise use case.
For information about using the Security Operations console Playbooks page, see What's on the Playbooks page? in Google Security Operations documentation.
Sources page
The Sources page contains cards that provide a summary of assets and findings from the security sources you have enabled. The card for each security source shows some of the findings from that source. You can click the finding category name to view all findings in that category.
SIEM dashboards
This Security Operations console page lets you view Google Security Operations SIEM dashboards to analyze alerts created by Google Security Operations rules and data collected using the Security Operations console log data collection capabilities.
For more information about using SIEM dashboards, see Dashboards overview in Google Security Operations documentation.
SOAR dashboards
This Security Operations console page lets you view and create dashboards using SOAR data that can be used to analyze responses and cases. For more information about using SOAR dashboards, see SOAR Dashboard Overview in Google Security Operations documentation.
SOAR reports
This Security Operations console page lets you view reports against SOAR data. For more information about using SOAR reports, see Understanding SOAR Reports in Google Security Operations documentation.
SCC settings
Lets you configure Security Command Center, including the following:
- Additional Security Command Center services
- Multi-cloud connectors
- High-value resource sets
- Mute findings rules
- Continuous data exports
SCC setup guide
Lets you activate Security Command Center Enterprise and configure additional services. For more information information, see Activate the Enterprise tier.
SIEM settings
This Security Operations console page lets you change configuration for features related to Google Security Operations SIEM. For information about using these features, see Google Security Operations documentation.
SOAR settings
This Security Operations console page lets you change configuration for features related to Google Security Operations SOAR. For information about using these features, see Google Security Operations documentation.
Differences between Security Command Center Enterprise pages
The Security Command Center Enterprise tier includes features available on both the Google Cloud console pages and in Security Operations console pages.
You sign in to the Google Cloud console and navigate to Security Operations console pages from the Google Cloud console navigation. This section describes the tasks that you can perform in each.
Google Cloud console pages
The Google Cloud console pages let you perform tasks such as the following:
- Activate Security Command Center.
- Set up Identity and Access Management (IAM) permissions for all Security Command Center users.
- Connect to other cloud environments to collect resource and configuration data.
- Work with and export findings.
- Assess risks with attack exposure scores.
- Work with issues, the most important security risks Security Command Center Enterprise has found in your cloud environments.
- Identify high-sensitivity data with Sensitive Data Protection.
- Investigate and remediate individual findings for your Google Cloud.
- Configure Security Health Analytics, Web Security Scanner, and other Google Cloud integrated services.
- Manage security postures.
- Configure cloud controls and frameworks.
- Manage a data security posture.
- Assess and report on your compliance with common security standards or benchmarks.
- View and search your Google Cloud assets.
The following image shows the Security Command Center content in the Google Cloud console.

Security Operations console pages
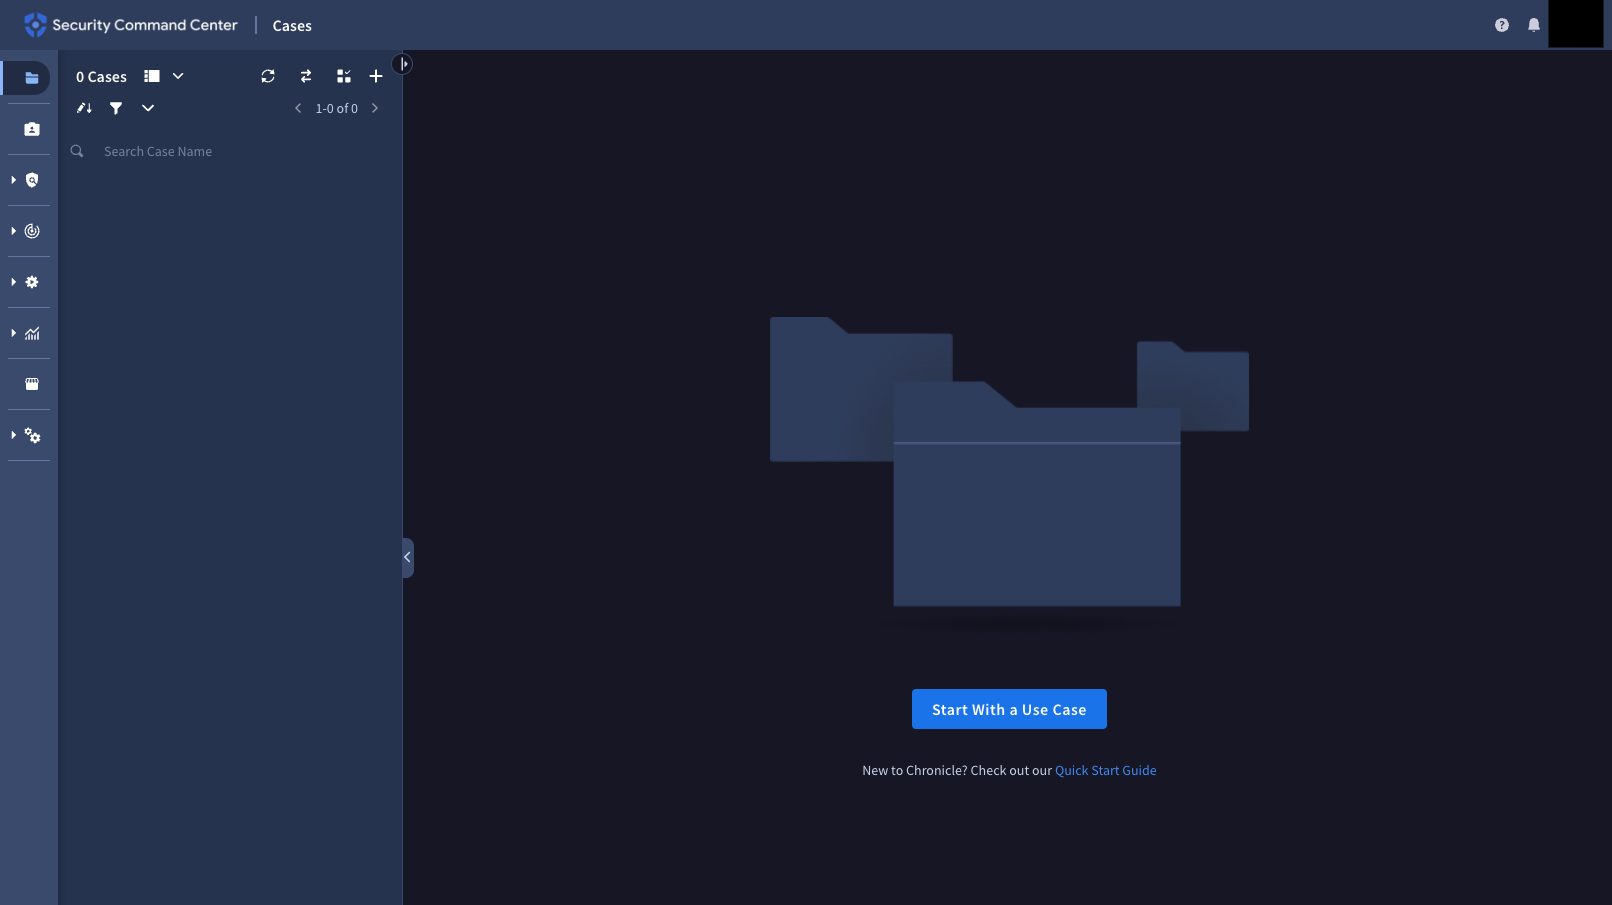
The Security Operations console page lets you perform tasks such as the following:
- Connect to other cloud environments to collect log data for curated detections in security information and event management (SIEM).
- Configure security orchestration, automation, and response (SOAR) settings.
- Configure users and groups for incident and case management.
- Work with cases, which includes grouping findings, assigning tickets, and working with alerts.
- Use an automated sequence of steps known as playbooks to remediate problems.
- Use Workdesk to manage actions and tasks waiting for you from open cases and playbooks.
The following image shows the Security Operations console.

Security Operations console pages have a URL similar to the following pattern.
https://CUSTOMER_SUBDOMAIN.backstory.chronicle.security/cases
Where CUSTOMER_SUBDOMAIN is your customer-specific identifier.
