      All (9.98 s - 10.08 s), 54 profiles
      Top 50% (10.03 s - 10.08 s), 22 profiles
      Top 25% (10.06 s - 10.08 s), 11 profiles
      Top 10% (10.07 s - 10.08 s), 3 profiles
      Top 5% (10.08 s - 10.08 s), 3 profiles
      Top 1% (10.08 s - 10.08 s), 3 profiles
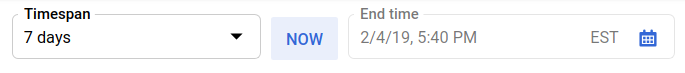
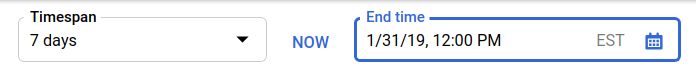
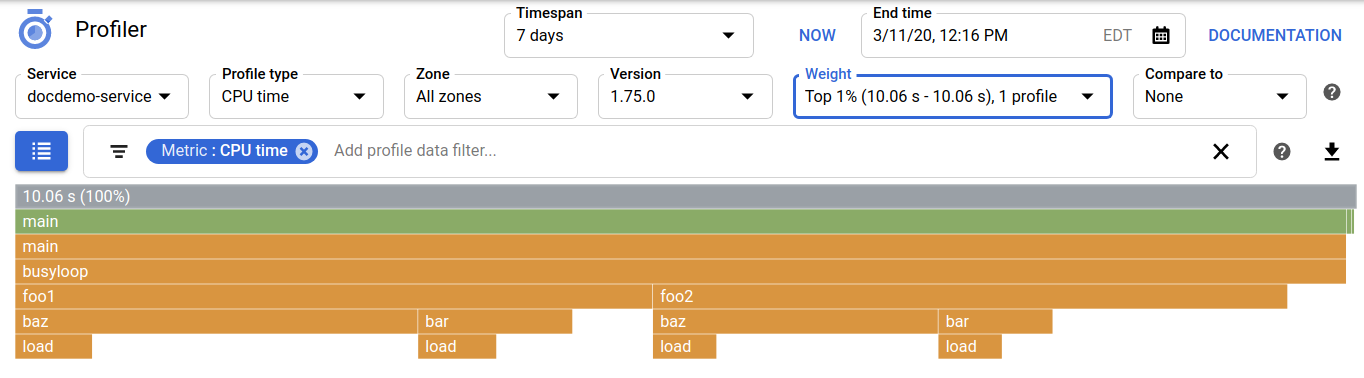
在「Weight」(權重) 選單中,大部分的資料列開頭都是 Top,後面跟著百分比。例如 Top 5% 表示只有前 5% 指標使用期間內收集的剖析資料可用於分析。括號內的兩個值是對應的指標使用範圍。最後一個值是這個範圍所收集到的剖析資料數量。就 Top 5% 資料列來說,收集了 3 個剖析資料。
[[["容易理解","easyToUnderstand","thumb-up"],["確實解決了我的問題","solvedMyProblem","thumb-up"],["其他","otherUp","thumb-up"]],[["難以理解","hardToUnderstand","thumb-down"],["資訊或程式碼範例有誤","incorrectInformationOrSampleCode","thumb-down"],["缺少我需要的資訊/範例","missingTheInformationSamplesINeed","thumb-down"],["翻譯問題","translationIssue","thumb-down"],["其他","otherDown","thumb-down"]],["上次更新時間:2025-09-04 (世界標準時間)。"],[],[],null,["# Select the profiles to analyze\n==============================\n\nThe menu settings in the Profiler interface determine which\nprofile data is used to construct the flame graph or the history view.\n\nTo generate the flame graph, Profiler\nidentifies the set of profiles that match the current menu settings. It then\nrandomly selects a maximum of 250 profiles from this set,\nand uses those to construct the flame graph.\n\nTo generate the history view, Profiler uses all profiles that\nmatch the current settings of the service, zone, and version menus. The\nvalue of the **Metric** filter determines the resource displayed.\n\nBefore you begin\n----------------\n\nIn the Google Cloud console, go to the **Profiler** page:\n\n[Go to **Profiler**](https://console.cloud.google.com/profiler)\n\n\u003cbr /\u003e\n\nYou can also find this page by using the search bar.\n\nRange of time\n-------------\n\nTo set the range of time for which profiling data is displayed in the\nflame graph, you use the **Timespan** menu, the **Now** button,\nand the **End time** menu.\n\nBy default, the time fields have the following settings:\n\n- **Timespan** is set to 7 days.\n- **Now** button is shaded by a blue background.\n- **End time** contains the time when Profiler was started and cannot be modified.\n\nWith these settings, Profiler analyzes profiles\ncaptured in the previous 7 days.\n\nTo set the timespan, click the **Timespan** down arrow, and then select an\noption from the list. Your choices range from 10 minutes to\n30 days, the limit of the retention period for\nprofile data.\n\nTo update the end time to the current time, click **Now**. The background\nof this button toggles between blue and white. In either case, a single\nclick updates the end time field to the current time.\n\nTo set the end time, do the following:\n\n- If the **End time** text isn't changeable, as shown in the following\n image, click **Now**:\n\n- In the **End time** field, enter a date and time, or use the calendar\n option to select a date:\n\nService\n-------\n\nTo select the service whose data you want to analyze, click the **Service**\nmenu and then make a selection. The service name is specified by you\nor by the runtime environment when you run your application\nwith profiling enabled. For information about service names,\nsee the appropriate guide for profiling your application:\n\n- [Go](/profiler/docs/profiling-go#svc-name-and-version)\n- [Java](/profiler/docs/profiling-java#service_name_and_version_arguments)\n- [Node.js](/profiler/docs/profiling-nodejs#svc-name-and-version)\n- [Python](/profiler/docs/profiling-python#svc-name-and-version)\n\nProfile type\n------------\n\nTo select the type of profiling data to visualize, click the\n**Profile type** menu and then make a selection.\n\nEach profile type captures a different kind of information:\n\n- **CPU time**: information about CPU usage.\n- **Heap**: information about the memory allocated in the program's heap when the profile was collected.\n- **Allocated Heap**: information about the total memory that was allocated in the program's heap, including memory that is freed and no longer in use.\n- **Contention**: information about mutex usage.\n- **Threads**: information about thread usage.\n- **Wall time**: information about total time to run.\n\nZone\n----\n\nTo restrict the analysis to instances of the service running in a specific\n[Compute Engine zone](/compute/docs/regions-zones), click the **Zone** menu and then\nselect a zone.\n\nThe default setting for this field is **All zones**.\n\nVersion\n-------\n\nTo restrict the analysis to a specific version of the named service, click\nthe **Version** menu, and then select the version of interest.\n\nThe service version is an optional value you or the runtime environment can\nspecify when your application is run with profiling enabled. For more\ninformation\non service versions, see the profiling guides for [Go](/profiler/docs/profiling-go#svc-name-and-version),\n[Java](/profiler/docs/profiling-java#service_name_and_version_arguments), [Node.js](/profiler/docs/profiling-nodejs#svc-name-and-version), or [Python](/profiler/docs/profiling-python#svc-name-and-version).\n\nThe default setting for this field is **All versions**.\n\nWeight\n------\n\nTo display in the flame graph only profile data that was captured when the\nmetric consumption was within a selected percentage of peak consumption, you\nuse the **Weight** menu. An example **Weight** menu is as follows: \n\n```\n All (9.98 s - 10.08 s), 54 profiles\n Top 50% (10.03 s - 10.08 s), 22 profiles\n Top 25% (10.06 s - 10.08 s), 11 profiles\n Top 10% (10.07 s - 10.08 s), 3 profiles\n Top 5% (10.08 s - 10.08 s), 3 profiles\n Top 1% (10.08 s - 10.08 s), 3 profiles\n```\n\nMost rows in the **Weight** menu start with `Top` followed by a percentage.\nFor example,`Top 5%`\nindicates that only profiles that were collected during the top 5% of\nmetric consumption are available for analysis. The two values in the\nparentheses list the corresponding range of metric consumption. The last value\nis the number of profiles collected over this range.\nFor the `Top 5%` row, 3 profiles were collected.\n\nThe first row is the default setting for the **Weight** field. The word\n`All` indicates that all collected profiles, or equivalently 100% of the\ncollected profiles, are available for analysis.\n\nThe following screenshot shows a weight-filtered graph:\n\nThe default setting for this field is all profiles.\n\nCompare to\n----------\n\nTo create a flame graph that displays a comparison of two profiles that differ\nby a single user-defined attribute, click\nthe **Compare To** menu, and then select the attribute. For example,\nyou can compare profiles by zone or by version. The two profiles being\ncompared must have the same profile type and be for the same service.\n\nFor more information, see [Comparing profiles](/profiler/docs/comparing-profiles).\n\nThe default setting for this field is **None**.\n\nWhat's next\n-----------\n\n- [Interact with the flame graph](/profiler/docs/interacting-flame-graph).\n- [Filter the flame graph](/profiler/docs/filtering-profiles).\n- [Focus the flame graph on a function](/profiler/docs/focusing-profiles).\n- [View historical trends](/profiler/docs/history-view).\n- [Compare profiles](/profiler/docs/comparing-profiles)."]]