評估應用程式效能
本文說明如何設定及使用 Cloud Profiler。您使用 Cloud Shell 下載 Go 程式範例後,將剖析功能啟用並執行程式,然後使用 Profiler 介面來探索擷取的資料。
如果您打算剖析在Google Cloud以外環境執行的應用程式,則需要執行一些本文件未討論的設定步驟。如要瞭解這些步驟,請參閱「剖析在 Google Cloud Platform 以外環境執行的應用程式 Google Cloud」。
事前準備
- Sign in to your Google Cloud account. If you're new to Google Cloud, create an account to evaluate how our products perform in real-world scenarios. New customers also get $300 in free credits to run, test, and deploy workloads.
-
In the Google Cloud console, on the project selector page, select or create a Google Cloud project.
Roles required to select or create a project
- Select a project: Selecting a project doesn't require a specific IAM role—you can select any project that you've been granted a role on.
-
Create a project: To create a project, you need the Project Creator
(
roles/resourcemanager.projectCreator), which contains theresourcemanager.projects.createpermission. Learn how to grant roles.
-
Enable the required API.
Roles required to enable APIs
To enable APIs, you need the Service Usage Admin IAM role (
roles/serviceusage.serviceUsageAdmin), which contains theserviceusage.services.enablepermission. Learn how to grant roles. - 如要開啟 Cloud Shell,請在 Google Cloud 控制台工具列中,按一下「啟用 Cloud Shell」:

稍後,Cloud Shell 工作階段會在Google Cloud 控制台中開啟:
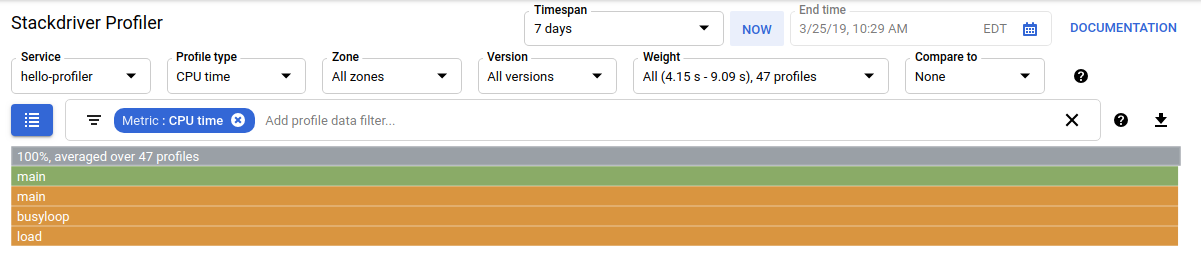
- 灰色的框架代表整個可執行檔,佔了 100% 要使用的資源。
- 綠色的
main框架是 Goruntime.main。 - 橘色的
main框架是範例程式的main常式。 - 橘色的
busyloop框架是從範例的main呼叫的常式。 - 橘色的
main.load框架是從範例的main呼叫的常式。 - Cloud Profiler 總覽
- 剖析概念
- 參閱DevOps相關資源,並探索 DORA 的研究計畫。
讓程式進行剖析
範例程式 main.go 位於 GitHub 的 golang-samples 存放區。如要取得這個程式,請在 Cloud Shell 中執行下列指令,擷取 Go 範例套件:
git clone https://github.com/GoogleCloudPlatform/golang-samples.git
套件擷取作業需要一些時間才能完成。
剖析程式碼
在 Cloud Shell 中,前往已擷取套件中 Profiler 範例程式碼的目錄:
cd golang-samples/profiler/profiler_quickstart
main.go 程式會建立需要使用大量 CPU 的工作負載,藉此為分析器提供資料。在 Cloud Shell 中執行下列指令,啟動並持續執行程式:
go run main.go
這個程式能在本身執行時載入 CPU,且設定為使用 Profiler;因此能在程式執行時,從中收集剖析資料並定期儲存。
啟動程式後,您會在幾秒內看到 profiler has started 訊息。大約一分鐘後,畫面上會再多顯示兩則訊息:
 successfully created profile CPU
 start uploading profile
這些訊息表示剖析資料已建立並上傳到您的 Cloud Storage 專案,程式會持續發出倒數兩則訊息,並維持約每分鐘發出一次訊息的頻率直到結束執行。
如果在啟動服務後收到「權限遭拒」錯誤訊息,請參閱「 Google Cloud 專案設定錯誤」。
Profiler 介面
啟動應用程式後,Profiler 會在稍後顯示初始設定檔資料。介面提供各種控制項和火焰圖,方便您探索剖析資料。
除了時間控制項,您還可以選擇要使用的剖析資料組合。剖析多個應用程式時,您可以使用「Service」(服務) 來選取剖析資料的來源。「Profile type」(剖析類型) 可讓您選擇要顯示的剖析資料種類。「Zone name」(區域名稱) 和「Version」(版本) 則可讓您限制要顯示的資料,使系統僅顯示所選 Compute Engine 區域或應用程式版本的資料。「Weight」(權重) 可讓您選取在資源使用高峰期間擷取的剖析資料。
如要進一步調整火焰圖如何顯示您已選定要進行分析的剖析資料,您可以新增篩選器。在上一個螢幕截圖中,篩選列 filter_list 顯示了一個篩選器。這個篩選器選項為 Metric,篩選器值則為 CPU time。
探索資料
火焰圖會顯示程式的呼叫堆疊。火焰圖以框架代表每個函式。框架的寬度代表該函式的資源用量比例。頂端框架代表整個程式,一律顯示 100% 資源使用量,並且列出這個圖表中是用多少組剖析資料來計算平均值。
在前文的螢幕擷圖中,程式範例的呼叫堆疊組合並不複雜,只有 5 個框架:
篩選器選取器可讓您篩選出符合特定名稱的函式。舉例來說,如果有公用程式函式標準程式庫,您可以從圖表中將其移除。此外,您也可以移除從特定方法發出的呼叫堆疊,或者用其他方式來簡化圖表。main.go 應用程式很簡單,因此沒有什麼內容可篩選排除。
即使是簡單的應用程式,篩選器也能讓您隱藏不需要的框架,以便更清楚地查看所需的框架。舉例來說,在範例程式碼的剖析螢幕截圖中,灰色框架比下方的第一個 main 框架稍微大一點,這是因為有其他正在執行的事件,但因為 main 呼叫堆疊耗用的資源比例如此之大,所以無法立即顯示出來嗎?如要查看應用程式的 main 常式外部正在發生的事件,請新增可以隱藏 main 常式呼叫堆疊的篩選器。main 外部只占 0.227% 的資源用量:

如要進一步瞭解篩選及其他探索剖析資料的方式,請參閱「選取要分析的剖析資料」。
後續步驟
如需剖析作業的一般資訊,請參閱下列文件: