Flow Analyzer analyzes VPC Flow Logs data stored in a record format. Log records contain base fields, which are the core fields of every log record, and metadata fields, which provide more information. The log records for monitoring traffic flows consist of three primary components:
- Resource information
- Metric types
- Time series
Resource information
The log records include the following data about the resources:
Metric types
The log records include data for the following metric types:
- Bytes sent: contains information about the payload volumes and doesn't include headers. This metric value can be zero because some packets have only headers and don't include any payloads.
- Packets sent: indicates the number of packets sent from the source to the destination.
Raw time-series data
The amount of raw metric data in a single time series can be enormous, and there are usually many time series associated with a metric type. To analyze the whole set of data for commonalities, trends, or outliers, some processing must be done on the time series in the set. Otherwise, there is too much data to consider.
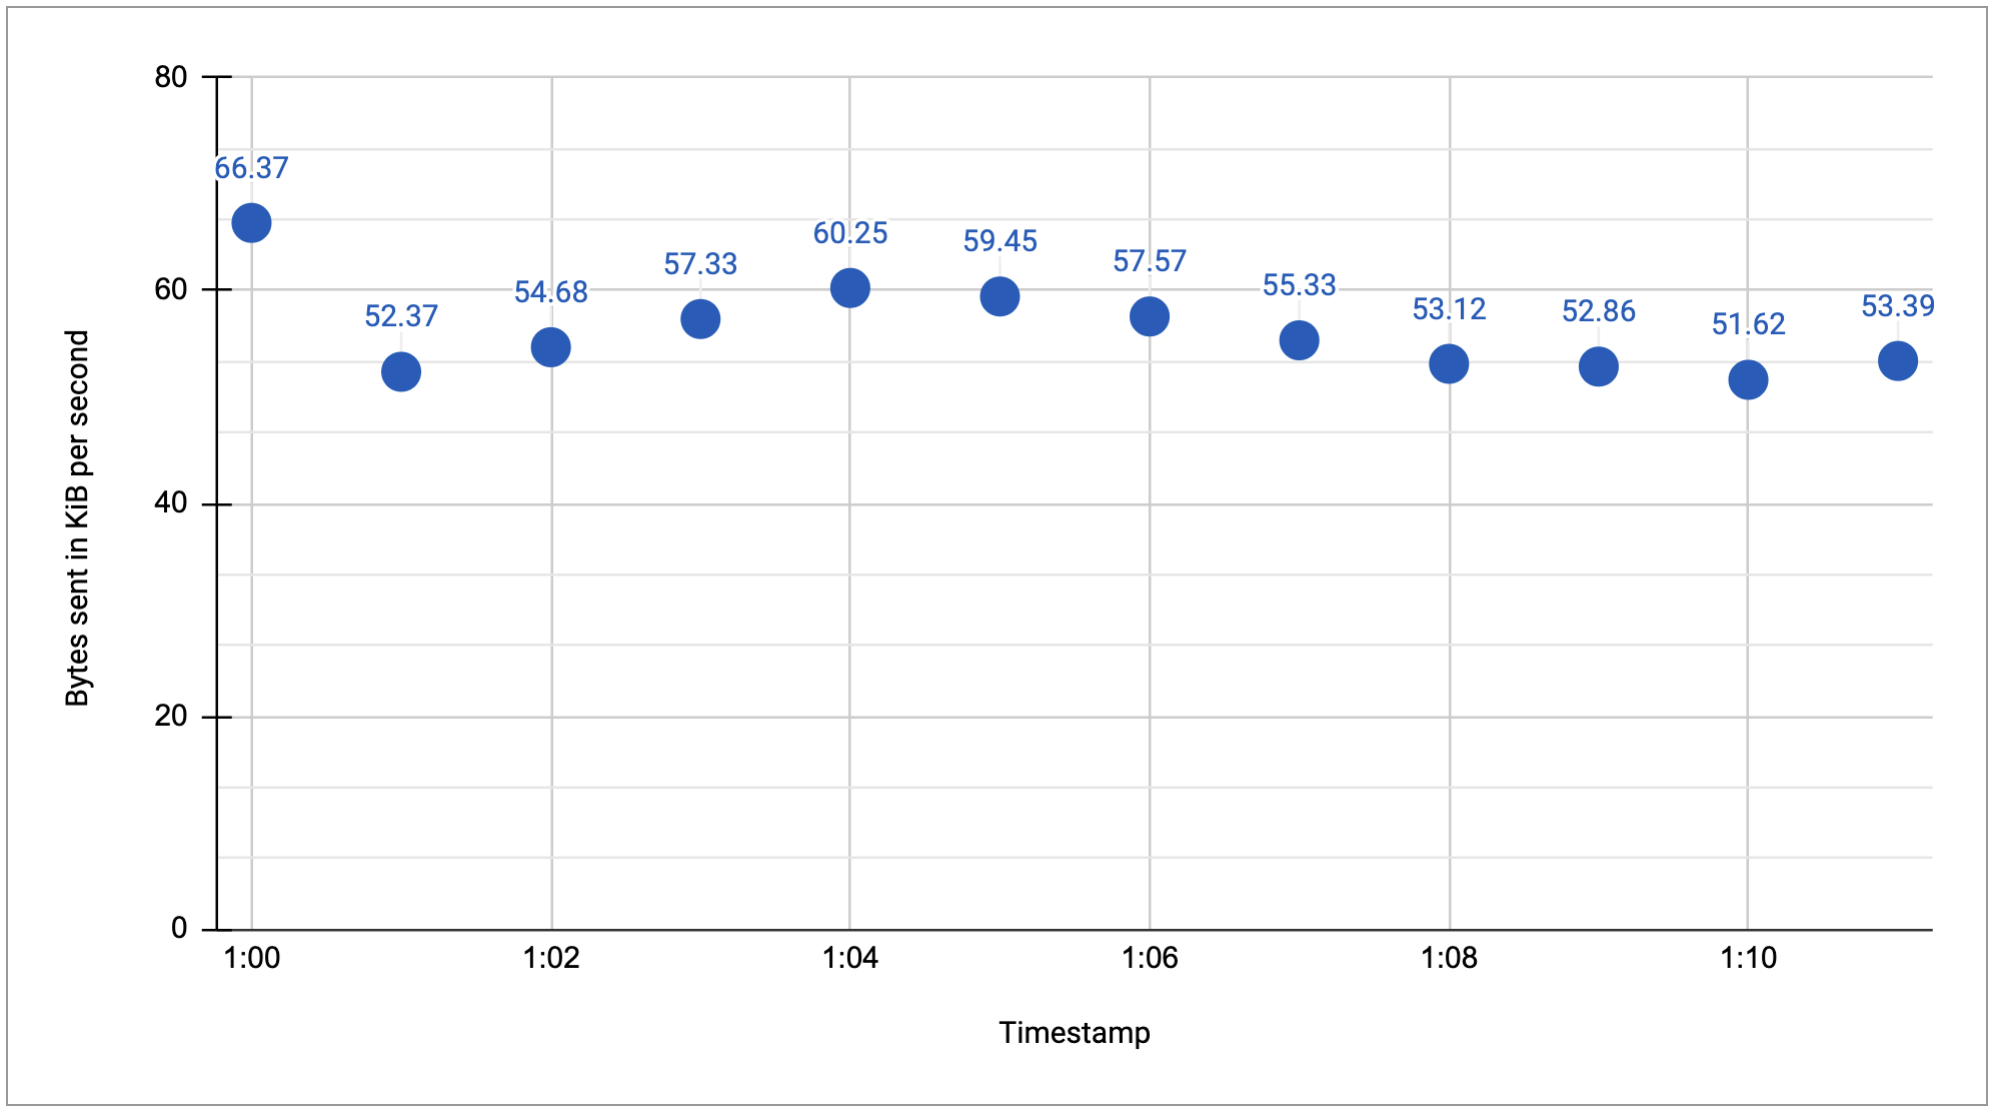
To introduce sampling and aggregation of the examples on this page, use a small number of hypothetical time series. For example, the following diagram shows a few minutes worth of raw data for the metric type of bytes per second:
Raw time-series data must be manipulated before it can be analyzed, and analysis often involves sampling the data and aggregating some together. This page describes two primary techniques for refining raw data:
- Sampling, which removes some of the data from consideration. Google Cloud does the sampling and uses the required data from the log records to perform operations as indicated in the queries.
- Aggregation, which combines multiple pieces of data into a smaller set along dimensions you specify.
Sampling and aggregation are powerful tools to help identify interesting patterns and highlight trends or outliers in the data, among other things.
Understanding alignment period
The first step in aggregating time-series data is alignment. Alignment creates a new time series in which the raw data is regularized in time so it can be combined with other aligned time series. Alignment produces time series with regularly spaced data.
Alignment involves two steps:
- Dividing the time series into regular time intervals, also called bucketing the data. The interval is called the alignment period.
- Computing a single metric value for the points in the alignment period. You choose how that single point is computed; you might sum all the values, or compute their average, or use the maximum.
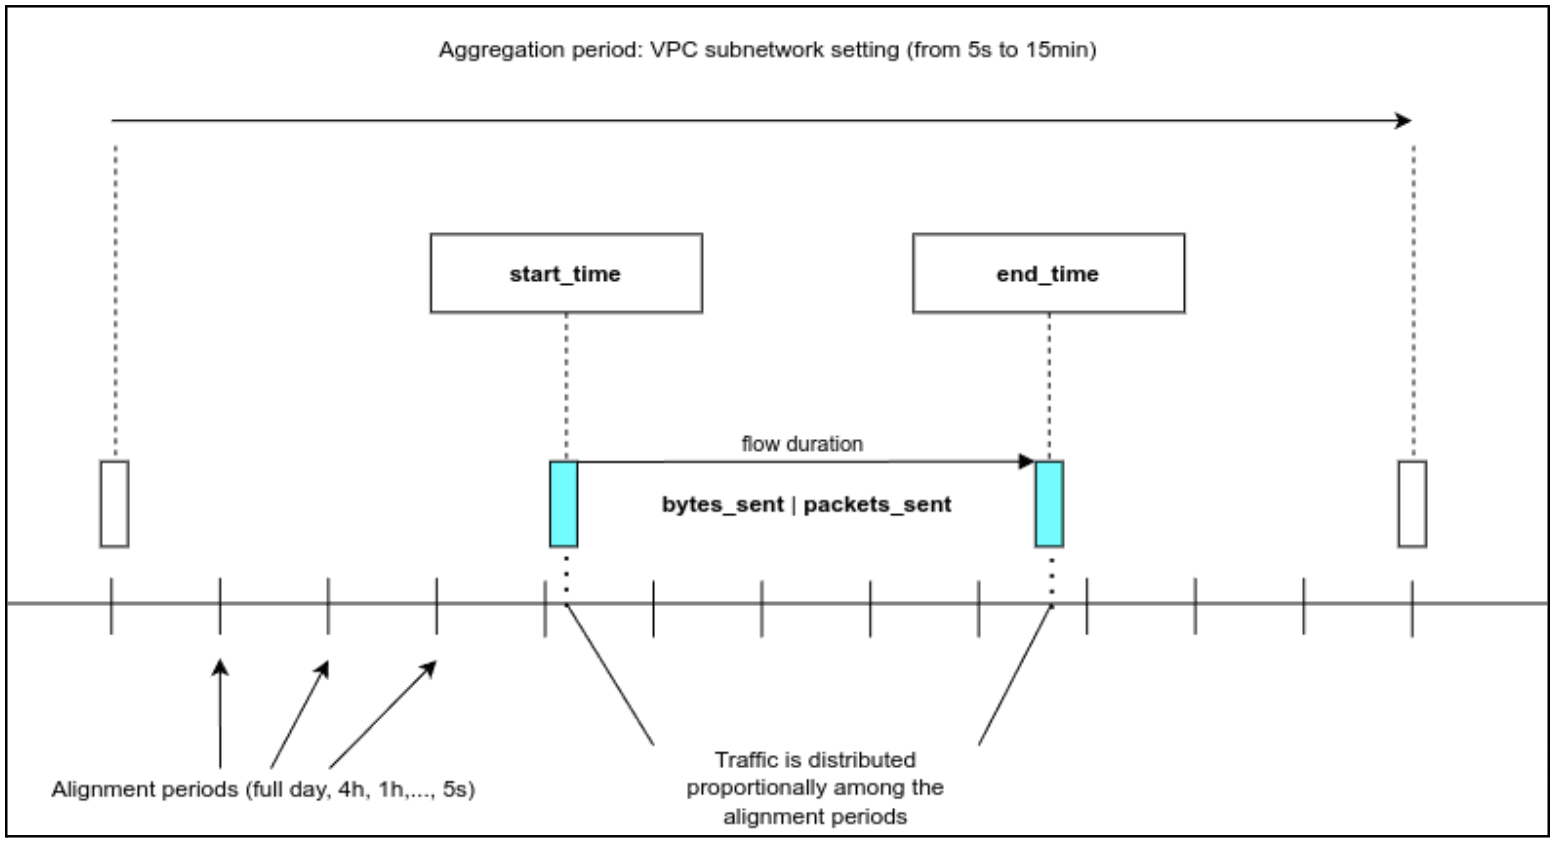
The following diagram shows how the alignment period is used to bucket the data within the start time and the end time.
The following diagram shows the result of using an alignment period of five minutes with the following steps:
- Creating an alignment period of five minutes time interval.
- Computing the single metric value by using the sum of the metric values from the raw data.

Granularity
If you know that something happened within a span of a couple of minutes, and you want to dig deeper, you probably want to use a period of a minute for alignment.
If you are interested in exploring trends over longer periods of time, a larger alignment period might be more appropriate. Large alignment periods are typically not useful for looking at short-term anomalous conditions, such as short spikes in traffic. If you use, for example, a multiple-week alignment period, the existence of an anomaly in that period can still be detected, but the aligned data might be too general to be of much help.
For large time durations, a smaller alignment period is not helpful. For example, if you select a 1 minute alignment for a 30 day period, Flow Analyzer generates more than 43,000 data points. Because 43,000 data points is 10 times more than the 4k display pixels, you cannot view all the details and some options are disabled for large time durations.
Alignment options
Alignment options include summing the values, or finding the max, min, or mean of the values, finding a chosen percentile value, counting the values, and others. Using Flow Analyzer, you can use various metric aggregations as alignment options.
If you select Bytes sent as the metric type and Source and destination as the traffic aggregation, the following options are available.
- Total traffic
- Average traffic rate
- Median traffic rate
- P95 traffic rate
- Maximum traffic rate
If you select Packets sent as the metric type and Source and destination as the traffic aggregation, the following options are available.
- Aggregate packets
- Average packets rate
- Median packets rate
- P95 packets rate
- Maximum packets rate
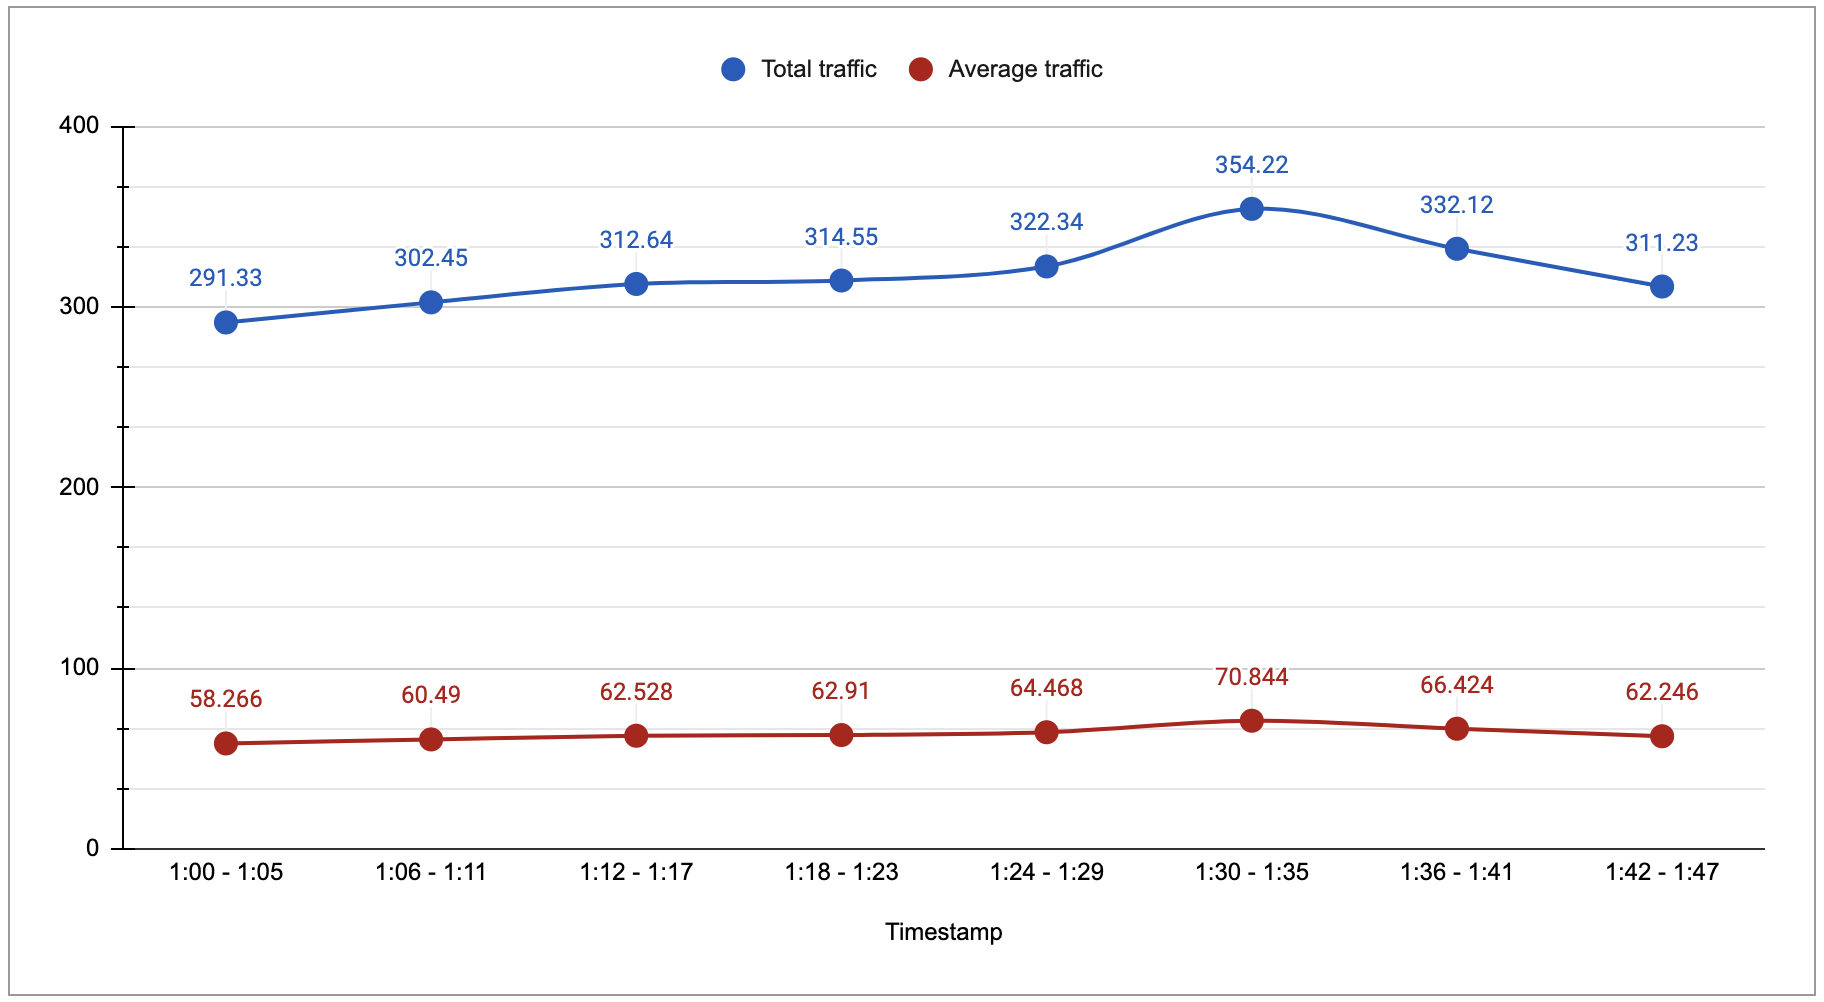
The following diagram shows the result of using two alignment options of total traffic and average traffic rate.
Using alignment period
You can use the Alignment period option to aggregate the traffic flows into time intervals of the selected duration. You can further zoom in the graph and see the specific details, if needed.
What's next
- Analyze traffic flows
- Enable Log Analytics
- Configure a central bucket
- Run Connectivity Tests from Flow Analyzer
- Monitor your traffic flows
- Troubleshoot data issues in Flow Analyzer