Cloud Code를 사용하면 다음 언어로 중단점을 설정하고 컨테이너에서 실행 중인 원격 애플리케이션을 디버깅할 수 있습니다.
자바
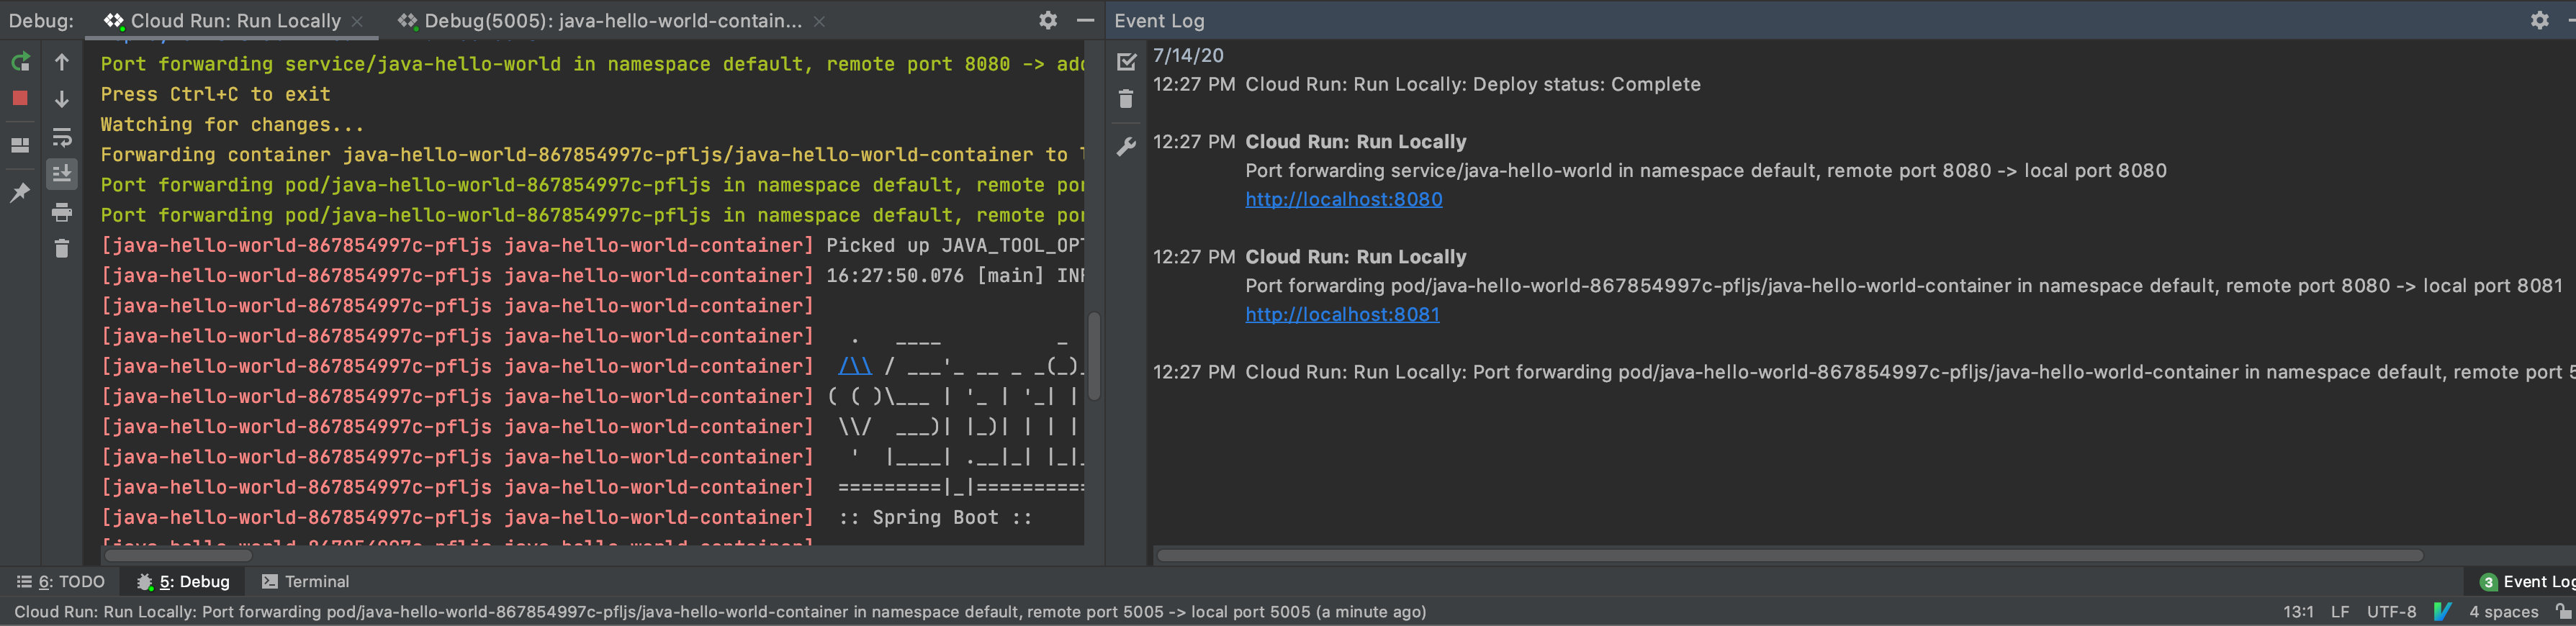
Cloud Code는 디버깅을 사용 설정하는 적절한 JDWP 구성과 함께 환경 변수 JAVA_TOOL_OPTIONS를 자동으로 추가합니다. JAVA_TOOL_OPTIONS이 이미 있으면 Cloud Code가 JAVA_TOOL_OPTIONS에 지정된 기존 설정을 사용합니다.
Node.js
애플리케이션 구조와 이미지 빌드 구성에 따라 디버거가 로컬 소스를 컨테이너의 원격 소스에 매핑할 수 있도록 해야 할 수 있습니다. 그러면 노드 디버거가 중단점을 올바르게 처리할 수 있습니다.
다음 방법 중 하나로 이를 구성할 수 있습니다.
수동 구성
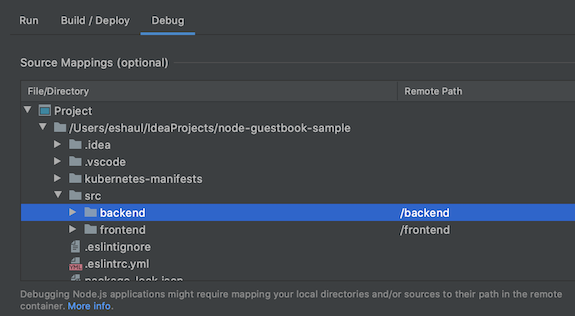
드롭다운에서 Cloud Run: 로컬로 실행 실행 구성을 선택한 후 구성 수정을 클릭합니다. 디버그 탭에서 로컬 애플리케이션 소스에서 원격 컨테이너의 소스 위치로의 소스 매핑을 구성합니다.
구성 옵션:
파일/디렉터리 - Cloud Run에서 실행 중인 애플리케이션의 로컬 파일 또는 디렉터리입니다.
원격 경로 - Cloud Run의 컨테이너에서 실행 중인 파일 또는 디렉터리의 경로입니다.
자동 구성
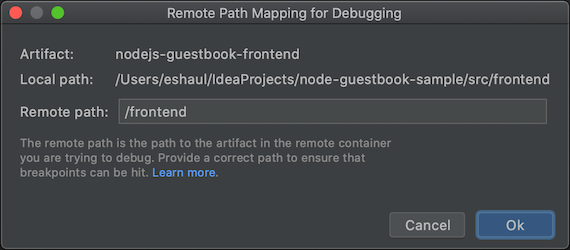
Cloud Code에 대한 이 매핑을 연기하도록 선택할 수 있습니다. 사용자가 디버그 세션을 시작하면 Cloud Code에서 이 매핑을 자동으로 추론하려고 시도합니다. 추론된 매핑이 대화상자에 표시됩니다. 디버깅 중인 각 아티팩트에 대해 하나의 대화상자가 표시됩니다.
구성 옵션:
로컬 경로 - 디버깅 중인 아티팩트의 루트에 대한 로컬 경로입니다.
원격 경로 - Cloud Run의 컨테이너에서 실행 중인 파일 또는 디렉터리의 경로입니다. 이를 사용자의 고유 값으로 재정의할 수 있습니다. 취소를 클릭하면 매핑이 적용되지 않습니다.
Go
디버깅을 위해 애플리케이션을 구성하려면 앱이 Go 모듈 기반 애플리케이션이어야 하고 GODEBUG, GOGC, GOMAXPROCS, 또는 GOTRACEBACK과 같이 컨테이너에서 표준 Go 런타임 환경 변수 중 하나를 설정하여 Go 기반 앱으로 식별되어야 합니다. GOTRACEBACK=single이 Go의 기본 설정이며 GOTRACEBACK=all은 일반적으로 유용한 구성입니다.
선택적으로(권장) 최적화를 사용 중지하는 -gcflags='all=-N -l' 옵션을 사용하여 앱을 빌드해야 합니다. Skaffold 프로필은 이 용도에 유용한 옵션이며 빌드/배포 탭의 실행 구성에서 배포 프로필 필드에 설정할 수 있습니다.
[[["이해하기 쉬움","easyToUnderstand","thumb-up"],["문제가 해결됨","solvedMyProblem","thumb-up"],["기타","otherUp","thumb-up"]],[["이해하기 어려움","hardToUnderstand","thumb-down"],["잘못된 정보 또는 샘플 코드","incorrectInformationOrSampleCode","thumb-down"],["필요한 정보/샘플이 없음","missingTheInformationSamplesINeed","thumb-down"],["번역 문제","translationIssue","thumb-down"],["기타","otherDown","thumb-down"]],["최종 업데이트: 2025-09-04(UTC)"],[[["\u003cp\u003eCloud Code allows local debugging of Cloud Run services in a Cloud Run-like environment, enabling users to set breakpoints, step through code, and debug remote services running in containers.\u003c/p\u003e\n"],["\u003cp\u003eDebugging a service requires creating a debug configuration by selecting "Cloud Run: Run Locally" under "Cloud Code: Cloud Run" in the Run/Debug configurations.\u003c/p\u003e\n"],["\u003cp\u003eCloud Code supports debugging for Java, Go, Node.js, and Python, with specific IDEs and plugin requirements detailed for each language.\u003c/p\u003e\n"],["\u003cp\u003eNode.js debugging may require manual or automatic source mapping to align local and remote sources, while Go applications need to be Go Module-based and may benefit from specific build options.\u003c/p\u003e\n"],["\u003cp\u003ePython debugging requires a Python SDK configured within your project's IDE, and it also requires a skaffold version of 1.25.0 or greater.\u003c/p\u003e\n"]]],[],null,["# Debug a locally running service in Cloud Code for IntelliJ\n\n| **Note:** Debugging support is currently available for Java, Go, Node.js, and Python services.\n\nWith Cloud Code, you can debug your Cloud Run services\nlocally in a Cloud Run-like environment. You can set breakpoints, step through\nyour code, and debug remote services running in containers.\n\nCloud Code also enables you to [debug an application while making\nchanges to, and iterating on, source code](/code/docs/intellij/watch-modes#applying-changes-while-debugging).\n\nDefining your debug configuration\n---------------------------------\n\nBefore you debug your service, you must create your debug configuration:\n\n1. Navigate to **Run/Debug** configuration selector in the Navigation bar and click **Edit Configurations**.\n2. Choose **Cloud Run: Run Locally** under **Cloud Code: Cloud Run**.\n3. Click **OK**.\n\nDebugging your service\n----------------------\n\nTo debug your service, follow these steps:\n\n1. Click\n **Debug** for **Cloud Run: Run Locally** to start the development cycle in\n debug mode.\n\n2. Cloud Code will attach a debug session. Once successful, the Debug Tool\n window opens, confirming connection (within the Console tab).\n\n3. Click the gutter at the executable line of the code where you want to\n add a breakpoint.\n\n Red filled circles denote active breakpoints, while red-outlined hollow\n circles signify disabled breakpoints.\n4. To access your running service, click the URL displayed in your Event Log panel.\n\n When you do, a new request is sent to your service and it pauses at the\n breakpoint-marked line.\n\n5. To end the debugging session, click the stop icon on the\n Cloud Run: Run Locally run configuration.\n\nSupported IDEs\n--------------\n\nThe following table lists the languages and IDEs that Cloud Code supports for\ndebugging. The table also lists the required plugins, where applicable:\n\nFor more information about IDE support, see\n[Supported JetBrains IDEs](/code/docs/intellij/ides).\n\nWith Cloud Code, you can set breakpoints and\ndebug remote applications running in containers for the following languages: \n\n### Java\n\nCloud Code automatically adds an environment variable,\n`JAVA_TOOL_OPTIONS`, with the appropriate JDWP configuration to\nenable debugging. If `JAVA_TOOL_OPTIONS` is already present,\nCloud Code uses existing settings specified in\n`JAVA_TOOL_OPTIONS`.\n\n### Node.js\n\nDepending on the structure of your application and its image build\nconfiguration, you might have to help the debugger map your local sources\nto the remote sources in the container. This enables the Node debugger\nto correctly process your breakpoints.\n\nYou can configure this in one of the following ways:\n\n- **Manual configuration**\n\n Select the **Cloud Run: Run Locally** Run Configuration from the dropdown\n and then click **Edit Configurations** . On the **Debug** tab, configure the\n source mapping from your local application source to the source\n location in the remote container.\n\n Configuration options:\n - **File/directory** - the local file or directory of your application running on Cloud Run.\n - **Remote path** - the path to the file or directory running in the container on Cloud Run.\n- **Automatic configuration**\n\n You can choose to defer this mapping to Cloud Code. When you\n start your debug session, Cloud Code attempts to infer\n this mapping automatically. The inferred mapping is presented to you in a\n dialog; one dialog for each artifact you are debugging.\n\n Configuration options:\n - **Local path** - the local path to the root of the artifact you are debugging.\n - **Remote path** - the path to the file or directory running in the container on Cloud Run. You can choose to override this with your own value. If you click **Cancel**, no mapping is applied.\n\n | **Note:** Automatic mapping is a best effort guess based on heuristics.\n\n### Go\n\nTo configure your application for debugging, your app must be a\n[Go Module](https://blog.golang.org/using-go-modules)-based application\nand be identified as being Go-based by setting one of the\n[standard Go runtime environment variables](https://godoc.org/runtime)\nin the container, such as `GODEBUG`, `GOGC`, `GOMAXPROCS`, or\n`GOTRACEBACK`. `GOTRACEBACK=single` is the default setting for Go\nand `GOTRACEBACK=all` is a generally useful configuration.\n\nOptionally (but recommended), your app should be built with the\n`-gcflags='all=-N -l'` options to disable optimizations. Skaffold\n[Profiles](https://skaffold.dev/docs/environment/profiles/) are a useful\noption for this purpose and can be set with the **Deployment Profile**\nfield in your Run configuration on the **Build/Deploy** tab.\n\n### Python\n\nTo configure your application for debugging, ensure you meet the following\nprerequisites:\n\n- **IDE, edition, and plugin are compatible**\n\n For compatible IDEs, editions, and plugins, see\n [Supported IDEs](#supported_ides).\n- **Skaffold version is 1.25.0 or greater**\n\n You can allow Cloud Code to [manage your dependencies](/code/docs/intellij/install#managed_dependencies),\n or point to a local Skaffold installation. See **Preferences \\\u003e Tools \\\u003e\n Cloud Code \\\u003e Dependencies**.\n- **Python interpreter is configured**\n\n Without a Python interpreter configured in your project,\n debugging won't work, as there is no way to run `pydevd`, the\n underlying Python debugger.\n\n \u003cbr /\u003e\n\n \u003cbr /\u003e\n\nFor more information, see the [Skaffold debug\ndocumentation](https://skaffold.dev/docs/workflows/debug/).\n\nGet support\n-----------\n\nTo submit feedback or report an issue in your IntelliJ IDE, go to **Tools** \\\u003e **Cloud Code** \\\u003e **Help / About** \\\u003e **Submit\nfeedback or report an issue** to report an issue on [GitHub](https://github.com/GoogleCloudPlatform/cloud-code-intellij/issues)."]]
 디버그를 클릭하여 디버그 모드로 개발 주기를 시작하세요.