Cloud Code for IntelliJ 可讓您輕鬆地對已部署至 Kubernetes 叢集的應用程式進行偵錯。您可以對本機叢集 (例如 minikube 或 Docker Desktop)、Google Kubernetes Engine,或其他雲端服務供應商上的應用程式進行偵錯。
使用 Cloud Code 的偵錯支援,您就能略過手動設定,例如設定通訊埠轉送、安裝偵錯後端,或使用正確的方式插入特定語言偵錯引數。您只需要具備 Cloud Code 且包含 skaffold.yaml 設定檔在內的 Kubernetes 應用程式即可。
此外,您也可以使用 Cloud Code 在對原始碼進行變更及疊代時,對應用程式進行偵錯。
支援的 IDE
下表列出 Cloud Code 支援偵錯的語言和 IDE。下表也列出必要外掛程式 (如適用):
| 語言 | 支援的 IDE 和版本 | 必要外掛程式 |
|---|---|---|
| Java | IntelliJ IDEA Ultimate | 不適用 |
| IntelliJ IDEA Community | 不適用 | |
| Go | IntelliJ IDEA Ultimate | Go 外掛程式 |
| GoLand | 不適用 | |
| Node.js | IntelliJ IDEA Ultimate | Node.js 外掛程式 |
| WebStorm | 不適用 | |
| Python | IntelliJ IDEA Ultimate | Python 外掛程式 |
| PyCharm Professional | 不適用 |
如要進一步瞭解 IDE 支援,請參閱「系統支援的 JetBrains IDE」。
使用 Cloud Code 時,您可以設定中斷點,並針對以容器執行的遠端應用程式進行偵錯,支援的語言如下:
Java
Cloud Code 會自動新增環境變數 JAVA_TOOL_OPTIONS,並提供適當的 JDWP 設定來啟用偵錯功能。如果 JAVA_TOOL_OPTIONS 已存在,Cloud Code 會使用 JAVA_TOOL_OPTIONS 中指定的現有設定。
Node.js
視應用程式的結構和映像檔建構設定而定,您可能必須協助偵錯工具將本機來源對應至容器中的遠端來源。這樣 Node 偵錯工具才能正確處理中斷點。
您可以透過下列任一方式設定這項功能:
手動設定
從下拉式選單中選取「Develop on Kubernetes」執行設定,然後按一下「Edit Configurations」。在「Debug」分頁中,設定從本機應用程式來源到遠端容器中來源位置的來源對應。
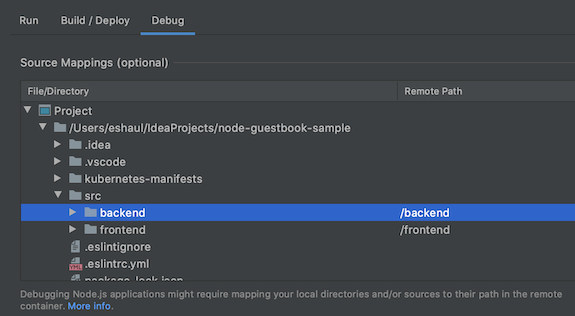
設定選項:
- 檔案/目錄 - 在 Kubernetes 上執行的應用程式本機檔案或目錄。
- 遠端路徑:在 Kubernetes 容器中執行的檔案或目錄路徑。
自動設定
您可以選擇將這項對應作業延後至 Cloud Code 執行。啟動偵錯工作階段時,Cloud Code 會嘗試自動推斷這項對應。系統會在對話方塊中顯示推斷的對應關係,每個要偵錯的構件都會顯示一個對話方塊。
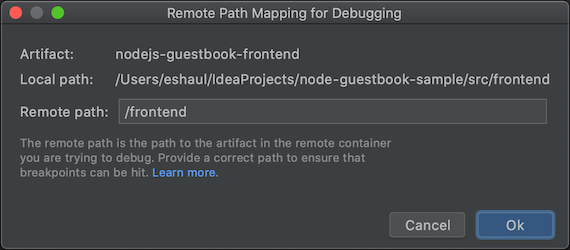
設定選項:
- 本機路徑:要偵錯的構件根目錄本機路徑。
- 遠端路徑:在 Kubernetes 容器中執行的檔案或目錄路徑。您可以選擇以自己的值覆寫此值。如果按一下「取消」,系統不會套用任何對應。
Go
如要設定應用程式以進行偵錯,應用程式必須是以 Go 模組為基礎,並在容器中設定其中一個標準 Go 執行階段環境變數 (例如 GODEBUG、GOGC、GOMAXPROCS 或 GOTRACEBACK),以識別為 Go 應用程式。GOTRACEBACK=single 是 Go 的預設設定,GOTRACEBACK=all 則是一般實用的設定。
建議您使用 -gcflags='all=-N -l' 選項建構應用程式,停用最佳化功能 (選用)。Skaffold 設定檔是這項用途的實用選項,可在「Build/Deploy」分頁的「Run」設定中,透過「Deployment Profile」欄位進行設定。
Python
如要設定應用程式以進行偵錯,請確認您符合下列必要條件:
IDE、版本和外掛程式相容
如要瞭解相容的 IDE、版本和外掛程式,請參閱「支援的 IDE」。
Skaffold 版本為 1.25.0 以上
您可以允許 Cloud Code 管理依附元件,或指向本機 Skaffold 安裝位置。請參閱「偏好設定」>「工具」>「Cloud Code」>「依附元件」。
已設定 Python 解譯器
如果專案中未設定 Python 解譯器,就無法進行偵錯,因為系統無法執行基礎 Python 偵錯工具
pydevd。IDE 設定操作說明 IntelliJ IDEA 如要使用 Cloud Code 進行 Python 偵錯,必須為專案設定 Python SDK。
依序前往「File」>「Project Structure」,然後在「Project」分頁中新增 Python SDK。如果沒有,請在「SDK」分頁中新增。PyCharm 依序前往「File」(檔案) >「Settings」(設定) >「Project」(專案) >「Python Interpreter」(Python 解譯器),或在 Mac OS X 中依序前往「PyCharm」>「Preferences」(偏好設定) >「Project」(專案) >「Python Interpreter」(Python 解譯器),然後新增 Python 解譯器。
詳情請參閱 Skaffold 偵錯說明文件。
對應用程式進行偵錯
如要在 Kubernetes 叢集上以偵錯模式啟動開發週期,請按一下「Develop on Kubernetes」
 的偵錯動作圖示。
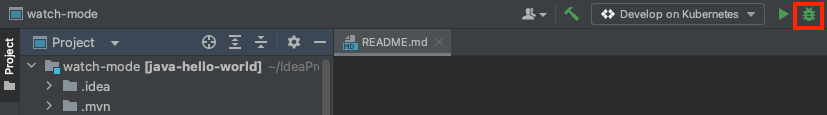
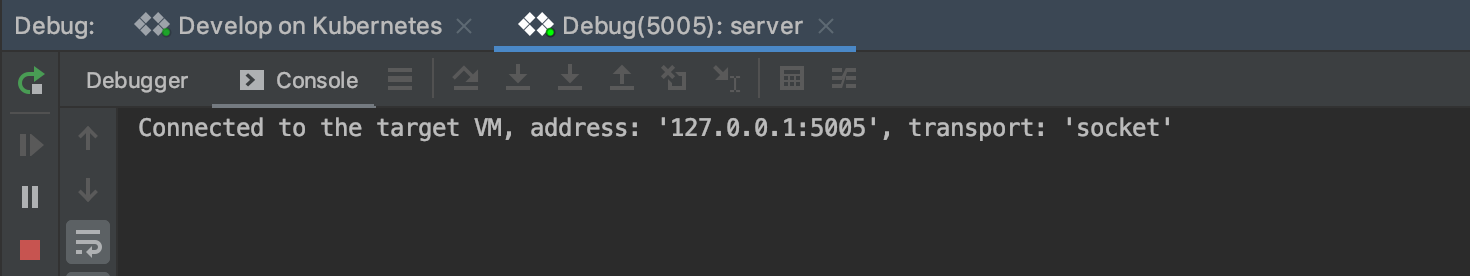
持續開發週期會以偵錯模式啟動。
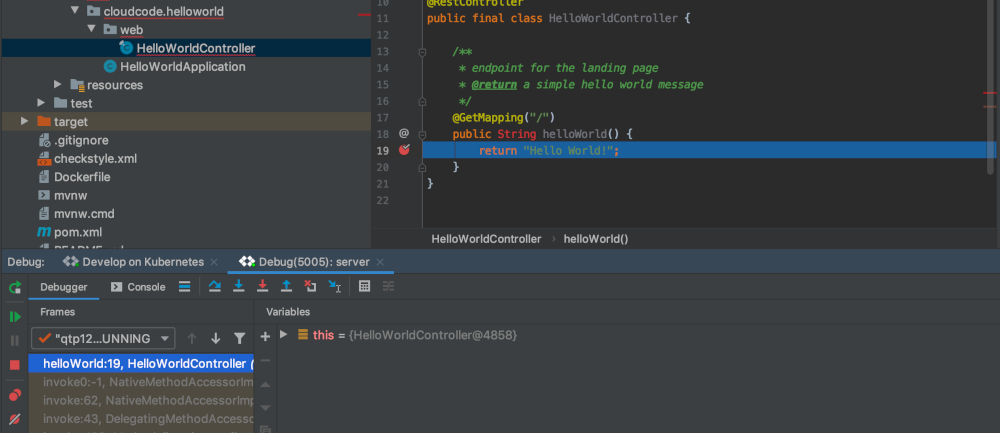
Cloud Code 會連結偵錯工作階段:
對本機程式碼偵錯的同時,您可以如常執行所有工作,例如設定中斷點及逐步完成程式碼,只是多了對使用中的 Kubernetes 叢集進行偵錯的附加優勢。
如要結束偵錯工作階段,請按一下「在 Kubernetes 上開發」執行設定旁的停止圖示。
後續步驟
- 使用 檔案同步和熱重載 加快開發速度。
- 在 Cloud Code 中設定持續開發環境。
- 在 Cloud Code 中查看 Kubernetes 記錄檔。