Mit Cloud Code for IntelliJ lassen sich mühelos Fehler in ihren auf einem Kubernetes-Cluster bereitgestellten Anwendungen beheben. Sie können in einer Anwendung Fehler auf einem lokalen Cluster (z. B. Minikube oder Docker Desktop), Google Kubernetes Engine oder einem anderen Cloud-Anbieter beheben.
Mit der Unterstützung für die Fehlerbehebung von Cloud Code überspringen Sie die manuelle Einrichtung wie die Einrichtung der Portweiterleitung, die Installation eines Debugging-Back-Ends oder das Einfügen von sprachspezifischen Debug-Argumenten. Sie benötigen lediglich eine Cloud Code-fähige Kubernetes-Anwendung, die eine skaffold.yaml-Konfigurationsdatei enthält.
Mit Cloud Code können Sie auch Fehler in einer Anwendung beheben, während Sie Änderungen am Quellcode vornehmen und iterieren.
Unterstützte IDEs
In der folgenden Tabelle sind die Sprachen und IDEs aufgeführt, die von Cloud Code für das Debugging unterstützt werden. In der Tabelle sind gegebenenfalls auch die erforderlichen Plug-ins aufgeführt:
| Sprache | Unterstützte IDEs und Versionen | Erforderliches Plug-in |
|---|---|---|
| Java | IntelliJ IDEA Ultimate | – |
| IntelliJ IDEA Community | – | |
| Go | IntelliJ IDEA Ultimate | Go-Plug-in |
| GoLand | – | |
| Node.js | IntelliJ IDEA Ultimate | Node.js-Plug-in |
| WebStorm | – | |
| Python | IntelliJ IDEA Ultimate | Python-Plug-in |
| PyCharm Professional | – |
Weitere Informationen zur IDE-Unterstützung finden Sie unter Unterstützte JetBrains-IDEs.
Mit Cloud Code können Sie Haltepunkte festlegen und Fehler in Remote-Anwendungen beheben, die in Containern für die folgenden Sprachen ausgeführt werden:
Java
Cloud Code fügt automatisch die Umgebungsvariable JAVA_TOOL_OPTIONS mit der entsprechenden JDWP-Konfiguration hinzu, um die Fehlerbehebung zu aktivieren. Wenn JAVA_TOOL_OPTIONS bereits vorhanden ist, verwendet Cloud Code die in JAVA_TOOL_OPTIONS angegebenen Einstellungen.
Node.js
Je nach Struktur Ihrer Anwendung und ihrer Image-Build-Konfiguration müssen Sie möglicherweise helfen, dass der Debugger Ihre lokalen Quellen den Remotequellen im Container zuordnet. Dadurch kann der Node.txt-Debugger Ihre Haltepunkte ordnungsgemäß verarbeiten.
Dies kann auf eine der folgenden Arten geschehen:
Manuelle Konfiguration
Wählen Sie im Drop-down-Menü Develop on Kubernetes die Option Konfigurationen bearbeiten aus. Konfigurieren Sie im Tab Debugging die Quellzuordnung von Ihrer lokalen Anwendungsquelle zum Quellspeicherort im Remote-Container.
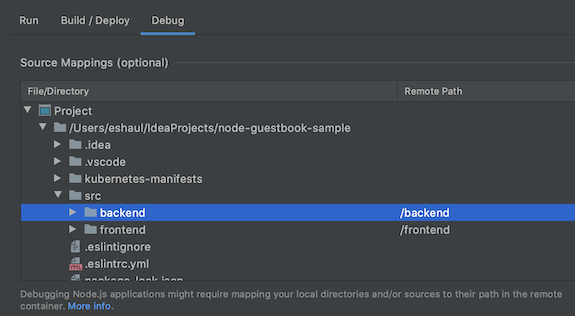
Konfigurationsoptionen:
- Datei/Verzeichnis: Die lokale Datei oder das lokale Verzeichnis Ihrer Anwendung, die auf Kubernetes ausgeführt wird.
- Remote Path: Der Pfad zur Datei oder dem Verzeichnis, die im Container in Kubernetes ausgeführt werden.
Automatische Konfiguration
Sie können diese Zuordnung zu Cloud Code aufheben. Wenn Sie die Fehlerbehebungssitzung starten, versucht Cloud Code, diese Zuordnung automatisch abzuleiten. Die abgeleitete Zuordnung wird Ihnen in einem Dialogfeld angezeigt. Ein Dialogfeld für jedes Artefakt, das Sie debuggen.
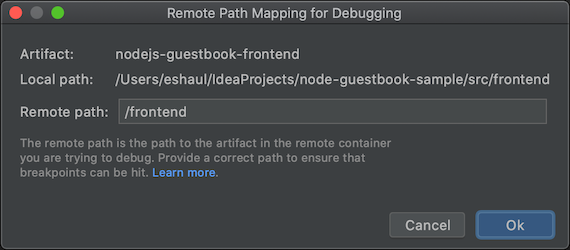
Konfigurationsoptionen:
- Lokaler Pfad: der lokale Pfad zum Stammverzeichnis des Artefakts, für das Sie eine Fehlerbehebung durchführen
- Remote Path: Der Pfad zur Datei oder dem Verzeichnis, die im Container in Kubernetes ausgeführt werden. Sie können diese Einstellung mit einem eigenen Wert überschreiben. Wenn Sie auf Abbrechen klicken, wird keine Zuordnung angewendet.
Go
Um Ihre Anwendung für die Fehlerbehebung zu konfigurieren, muss Ihre Anwendung eine auf dem Go-Modul basierende Anwendung sein und als Go-basiert identifiziert werden, indem Sie eine der Standard-Umgebungsvariablen der Go-Laufzeit im Container einstellen, z. B. GODEBUG, GOGC, GOMAXPROCS oder GOTRACEBACK. GOTRACEBACK=single ist die Standardeinstellung für Go und GOTRACEBACK=all eine allgemeine nützliche Konfiguration.
Optional (aber empfohlen) sollte Ihre Anwendung mit den -gcflags='all=-N -l'-Optionen erstellt werden, um Optimierungen zu deaktivieren. Skaffold-Profile sind für diesen Zweck nützlich und können in Ihrer Ausführungskonfiguration auf dem Tab Build/Bereitstellen mit dem Feld Bereitstellungsprofil festgelegt werden.
Python
Um Ihre Anwendung für das Debugging zu konfigurieren, müssen die folgenden Voraussetzungen erfüllt sein:
IDE, Edition und Plug-in sind kompatibel
Kompatible IDEs, Versionen und Plug-ins finden Sie unter Unterstützte IDEs.
Skaffold-Version ist 1.25.0 oder höher
Sie können Cloud Code die Verwaltung Ihrer Abhängigkeiten erlauben oder auf eine lokale Skaffold-Installation verweisen. Weitere Informationen finden Sie unter Einstellungen > Tools > Cloud Code > Abhängigkeiten.
Python-Interpreter ist konfiguriert
Ohne einen in Ihrem Projekt konfigurierten Python-Interpreter funktioniert das Debugging nicht, da es keine Möglichkeit gibt,
pydevd, den zugrunde liegenden Python-Debugger, auszuführen.IDE Konfiguration IntelliJ IDEA Für die Python-Fehlerbehebung mit Cloud Code muss ein Python-SDK für Ihr Projekt konfiguriert sein.
Rufen Sie Datei > Projektstruktur auf und fügen Sie auf dem Tab Projekt ein Python SDK hinzu. Falls keine vorhanden sind, fügen Sie auf dem Tab SDK eines hinzu.PyCharm Wählen Sie unter Datei > Einstellungen > Projekt > Python-Interpreter oder für Mac OS X PyCharm > Einstellungen > Projekt > Python-Interpreter einen Python-Interpreter aus.
Weitere Informationen finden Sie in der Skaffold-Debug-Dokumentation.
Anwendung debuggen
Klicken Sie auf die Debug-Aktion für
 Auf Kubernetes entwickeln, um den Entwicklungszyklus im Debug-Modus auf Ihrem Kubernetes-Cluster zu starten.
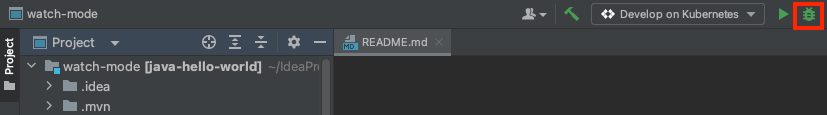
Der kontinuierliche Entwicklungszyklus wird im Debug-Modus gestartet.
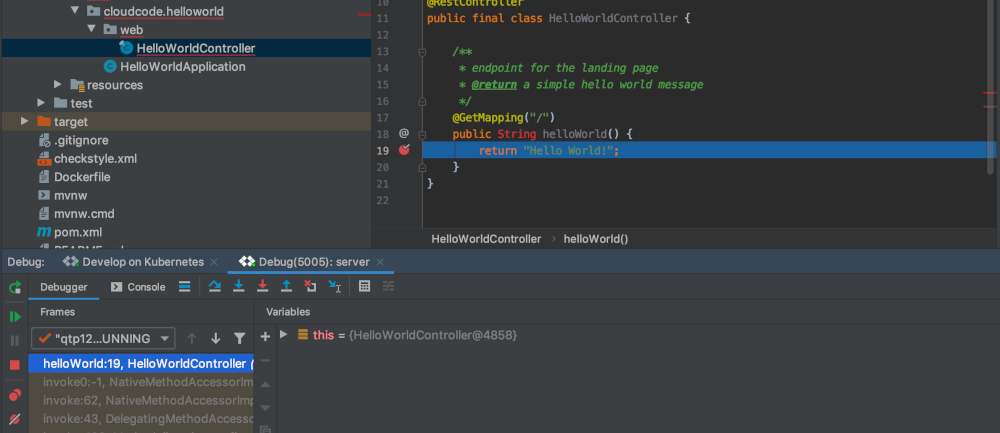
Cloud Code hängt eine Debug-Sitzung an:
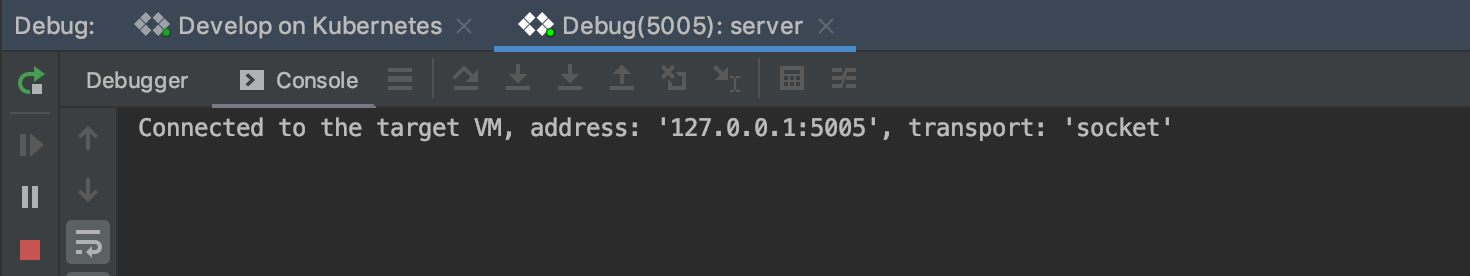
Sie können jetzt die Aufgaben ausführen, die Sie normalerweise beim Debuggen von lokalem Code ausführen, z. B. das Festlegen von Haltepunkten und das Durchlaufen von Code in einem Live-Kubernetes-Cluster.
Klicken Sie zum Beenden der Debugging-Sitzung auf das Stopp-Symbol in der Ausführungskonfiguration für Auf Kubernetes entwickeln.
Nächste Schritte
- Verwenden Sie die Dateisynchronisierung und Hot Reload, um die Entwicklung zu beschleunigen.
- Richten Sie eine Umgebung für die kontinuierliche Entwicklung in Cloud Code ein.
- Kubernetes-Logs in Cloud Code ansehen