Want to know why your application is slow? Cloud Trace’s new features can help.
Sharat Shroff
Product Manager
Since releasing Cloud Trace for Google Cloud Platform beta last year, thousands of developers have been using the service to improve their applications’ performance. Today, we’re adding more features and functionality, based on feedback from our beta users.
Here’s a shortlist of the latest updates:
1. Automatic tracing and performance analysis for all App Engine projects
Cloud Trace now automatically instruments Google App Engine applications. It continuously evaluates all App Engine requests and periodically analyzes each endpoint-level traces to identify performance bottlenecks and insights. It looks for suboptimal patterns in RPC calls and provides recommendations to fix them.

Here's how it works:
Cloud Trace currently analyzes billions of traces daily and generates millions of reports. It continuously inspects your application requests for a number of things — such as memcache size, datastore batch size, cursors usage and other data — and it looks for opportunities to optimize your application performance.
For example, using a cursor to make datastore queries may be more optimal than using an offset when the offset is large. When Cloud Trace observes a call pattern with an offset that slows down the application, it surfaces an insight with a recommendation to use cursors. We're continuously refining existing insights and adding new insights to Cloud Trace to provide accurate and actionable suggestions.
2. Latency shift detection
Cloud Trace builds analysis reports for the most frequently used endpoints, and now we can use these reports to determine changes in your application’s latency. Using our latency shift detection algorithms, we can surface significant and minor changes in your application latencies when there's a noticeable change. You can access this feature directly from the Analysis Reports tab within Cloud Trace.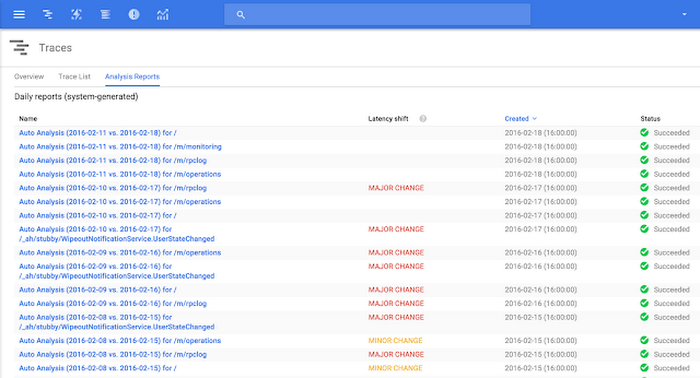

3. Use Trace API to trace custom workloads
If you have your own custom workloads that you wish to trace and analyze, the Cloud Trace API and Trace SDK can now be used to optimize the performance of those workloads. The Cloud Trace API can be used to add custom spans to a trace. A span represents a unit of work within a trace, such as an RPC request or a section of code. For custom workloads, you can define your custom start and end of a span using the Cloud Trace SDK. This data is uploaded to Cloud Trace, where you can leverage all the Trace Insights and Analytics features mentioned above. Currently Cloud Trace SDK is available for Java 1 and Node.js. A REST API is available for all other languages.4. Intuitive UI with a focus on developer workflows
The new Trace Overview page brings together all the Cloud Trace goodness into a simple unified view. The page summarizes the various performance insights gleaned from your application traces. It also summarizes the latencies for each application endpoint and the latencies associated with your most frequently called RPCs. The latest analysis report is readily available on the overview page.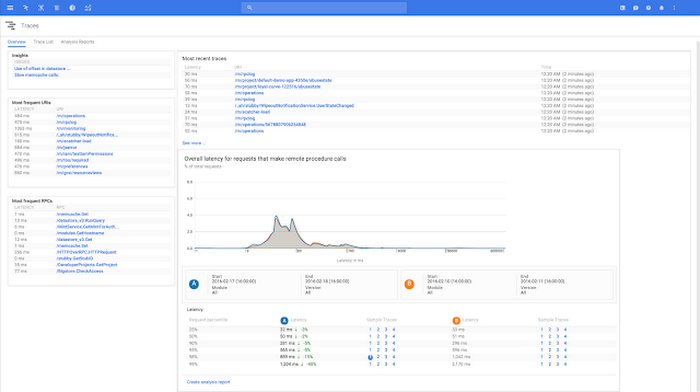

Many users have often expressed a desire to analyze Traces when viewing logs or when viewing the health of App Engine projects. Trace is now accessible from the Logs Viewer in Cloud Console and from the App Engine dashboard. If you're using Google Cloud Monitoring, then you'll now be able to navigate to a relevant and filtered set of Traces from your monitoring dashboard.


Stay tuned for more Cloud Trace improvements over the coming weeks, including expanded support for Google Compute Engine and Google Container Engine as well as more detailed auto analysis and insights. As always, we love direct feedback and will be monitoring Stack Overflow for issues and suggestions.
If you haven’t tried Cloud Trace to optimize your application performance, go ahead and give it a try! If you're attending GCP NEXT 2016, check out the talk “Diagnostics - Spend less time diagnosing and more time developing” to learn more about Cloud Trace and all the other development tools available on Google Cloud Platform to manage your applications.
1 Java is the registered trademark of Oracle and/or its affiliates.
