Viewing Stackdriver Trace spans and request logs in multi-project deployments
Morgan McLean
Product Manager
John Bryan
Software Engineer
Google Cloud Platform (GCP) provides developers and operators with fine-grained billing and resource access management for separate applications through projects. But while isolating application services across projects is important for security and cost allocation, it can make debugging cross-service issues more difficult.
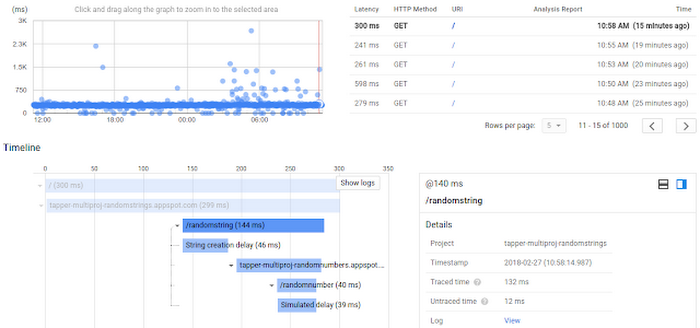
Stackdriver Trace, our tool for analyzing latency data from your applications, can now visualize traces and logs for requests that cross multiple projects, all in a single waterfall chart. This lets you see how requests propagate through services in separate projects and helps to identify sources of poor performance across your entire stack.
To view spans and log entries for cross-project traces, follow the instructions in the Viewing traces across projects documentation. Your projects will need to be part of a single organization, as explained in Best Practices for Enterprise Organizations. To do so, create an organization and then migrate existing projects to it.
Once your projects are in an organization, you’re ready to view multi-project traces. First, select any one of the relevant projects in the GCP Console, and then navigate to the Trace List page and select a trace. You will see spans for all the projects in your organization for which you have “cloudtrace.traces.get” permission. The “Project” label in the span details panel on the right indicates which project the selected span is from.


You can also view log entries associated with the request from all projects that were part of the trace. This requires the “logging.logEntries.list” permission on the associated projects and it requires you to set the LogEntry “trace” field using the format “projects/[PROJECT-ID]/traces/[TRACE-ID]” when you write your logs to Stackdriver Logging. You may also set the LogEntry “span_id” field as the 16-character hexadecimal encoded span ID to associate logs with specific trace spans. See Viewing Trace Details > Log Entries for details.
If you use Google Kubernetes Engine or the Stackdriver Logging Agent via Fluentd, you can set the LogEntry “trace” and “span_id” fields by writing structured logs with the keys of “logging.googleapis.com/trace” and “logging.googleapis.com/span_id”. See Special fields in structured payloads for more information.
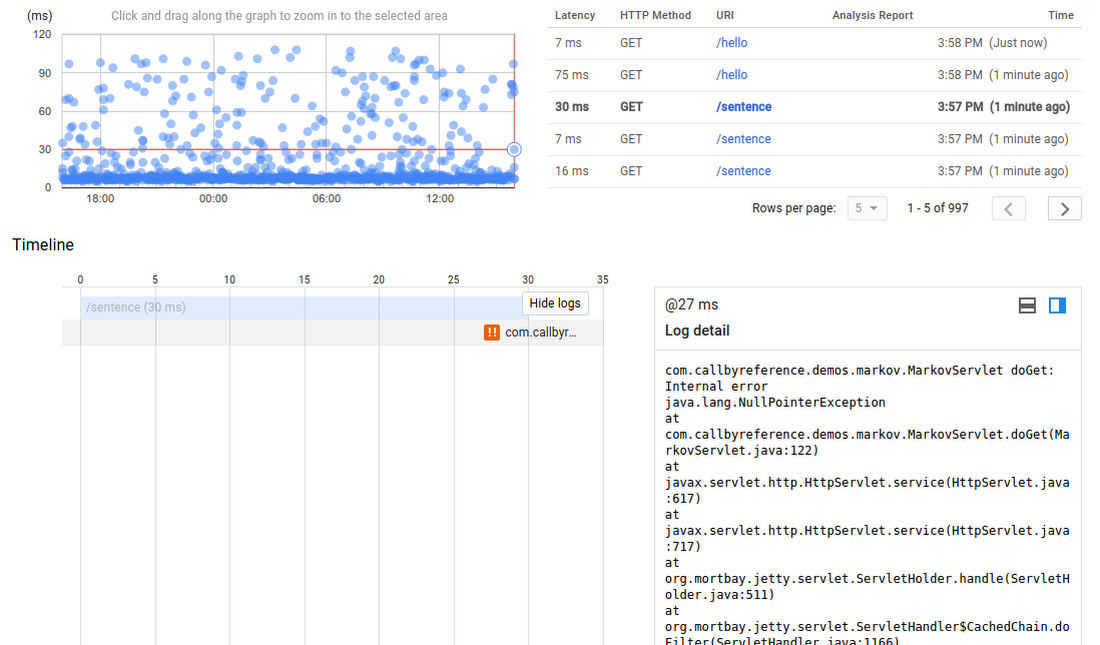
To view the associated log entries inline with trace spans, click “Show Logs.”


Automatic association of traces and logs
Here are the GCP languages and environments that support automatically associating traces and log entries:
- Node.js: if you use the Stackdriver Trace Node.js SDK, and you write your logs using Winston or Bunyan, you can use the @google-cloud/logging-bunyan or @google-cloud/logging-winston packages, which will automatically annotate your log entries with the “trace” field when the request is sampled for trace and a trace context is available.
- Ruby: use the google-cloud-trace and the google-cloud-logging gems to automatically assign the “trace” field of log entries.
- Java Spring: the Spring Boot Starter for Stackdriver Trace can collect trace spans and the Spring Cloud GCP Stackdriver Logging Support can automatically tag log entries with trace and span IDs.
- Both the App Engine Standard environment and App Engine Flexible default containers for Ruby, PHP, Java and Node.js automatically associate traces and logs.
- The GCP HTTP(S) load balancers also write trace and span IDs in log entries.


