Adding machine learning to a serverless data analysis pipeline
Lorenzo Ridi
Software Engineer & Technical Trainer, Noovle
In the right architecture, machine-learning functionality takes data analytics to the next level of value.
Editor’s note: This guest post (translated from Italian and originally published in late 2016) by Lorenzo Ridi, of Google Cloud Platform partner Noovle of Italy, describes a POC for building an end-to-end analytic pipeline on GCP that includes machine-learning functionality.
“Black Friday” is traditionally the biggest shopping day of the year in the United States. Black Friday can be a great opportunity to promote products, raise brand awareness and kick-off the holiday shopping season with a bang. During that period, whatever the type of retail involved, it's also becoming increasingly important to monitor and respond to consumer sentiment and feedback across social media channels.
For example, put yourself in the shoes of the fictional ACME Corporation, a famous retailer that, as the name suggests, produces and markets literally everything (“ACME” = “A Company Making Everything”).
With Black Friday approaching, the marketing director of ACME decided to commission an analysis of social-network activity, especially on Twitter, to capture insights that could be useful for promotions-related decision-making before and during the event. This goal is all the more crucial if you consider that with the enormous size of the company catalog, misdirecting any advertising and promotional funds would be problematic, at best.
In this post, I’ll describe on a high level an example architecture on Google Cloud Platform (GCP), which includes machine-learning services, that would meet ACME’s requirements. Although this particular use case is for illustration/POC purposes only, this architecture is based on real-life deployments on which I have personally worked for my own clients in Italy, where shopping “events” like Black Friday are also becoming popular. You can explore all sample code for this post here.
Going serverless
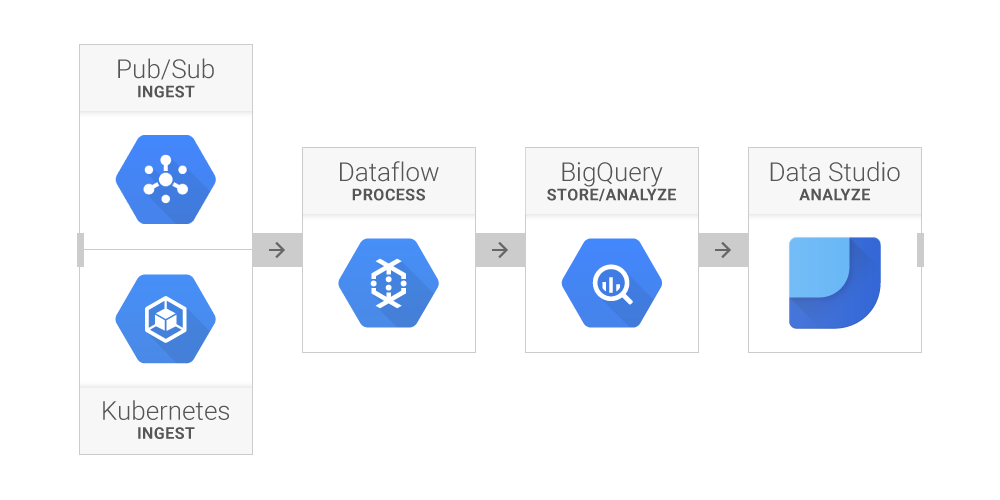
The expert data architects at ACME start working immediately. Mindful of similar experiences, they decide to rely on cloud infrastructure. Infrastructure sizing is a complex task, and any errors in assessment could jeopardize the success of the project.This analysis process will use a pretty common pattern in real-time data analytics projects: Ingest, process, store and analyze. To manage the heavy traffic expected during the event, ACME engineers decide to implement this architecture on GCP, using only serverless components (i.e., managed services that require no infrastructure-management overhead, such as spinning up/down clusters, at all):
Ingestion
To retrieve the data, the data architects design a simple Python application, that, using the TweePy library, accesses Twitter’s Streaming API to collect tweets about Black Friday and related topics. TweePy allows you to filter for tweets that meet specific parameters. In ACME’s case, all tweets that contain a series of keywords:The list of keywords also includes, other than a number of relevant brands and vendors (brand names are masked in this example), some of the terms “hostile” to Black Friday, such as “hands up do not spend” or “black out Black Friday.” (After all, in the words of Oscar Wilde: “There is only one thing in the world worse than being talked about, and that is not being talked about.”)
To ensure that this component maintains intended reliability standards, it runs within a Docker container on Google Container Engine, the implementation of Kubernetes on GCP. For that reason, ACME doesn’t need to worry about outages or malfunctions; everything is handled (and, if necessary, automatically restarted) by Kubernetes.

First of all, the ACME architects need to create the Docker image. For this purpose, it's sufficient to appropriately prepare a Dockerfile that contains the instructions to install the necessary libraries, copy the app and start the script:

Et voilà! The Docker image is ready to run anywhere: on a laptop, on an on-prem server, or, as in this case, on a Kubernetes cluster. Deploying it on Container Engine is straightforward using the GCP command-line tool: only three instructions are needed to create the Kubernetes cluster, acquire the login credentials and run the application within a Replication Controller.
The second link in the chain, which is where the raw data will go, is Google Cloud Pub/Sub, GCP’s managed service for real-time integration of data sources. Its role in a data architecture is to decouple the components that produce the data from the components that consume them. This approach improves the flexibility and reliability of the system, since even if a consumer were to go offline, Cloud Pub/Sub maintains a queue of undelivered messages that will be delivered the moment the system is back online.

Processing and storage
Thus far, ACME has implemented a reliable and scalable ingestion mechanism. To maintain the same standards in the next processing phase, two other tools in the GCP suite will be required:- Google Cloud Dataflow, a managed service for running parallel processing pipelines in batch or real time. Pipelines are developed using the open source Apache Beam API/programming model.
- Google BigQuery, a managed service for SQL analytics/data warehousing in the cloud. BigQuery is a key component in any data analytic architecture.
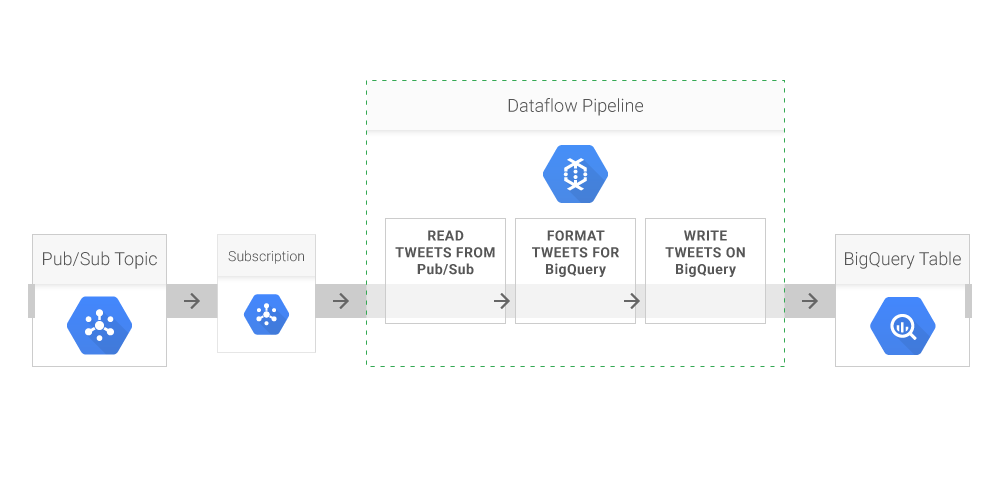
Writing the pipeline code is relatively easy: To appropriately transform the data, all that's needed is to create a Pipeline object and then repeatedly invoke the apply() method. Data is read and written using two I/O elements included in the SDK, PubSubIO and BigQueryIO, so with Beam, it's not necessary to write boilerplate code to implement systems integration.
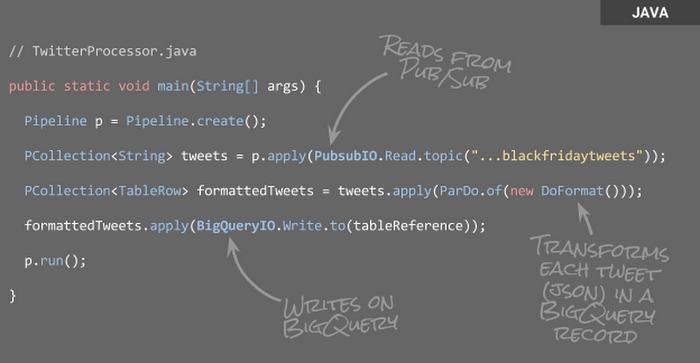
Being a Java program, the pipeline execution can be invoked directly via command line with a tool like Maven:
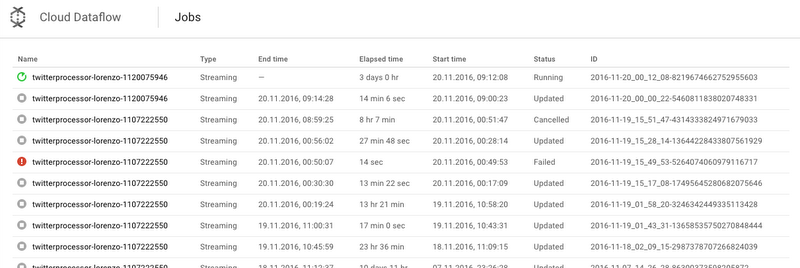
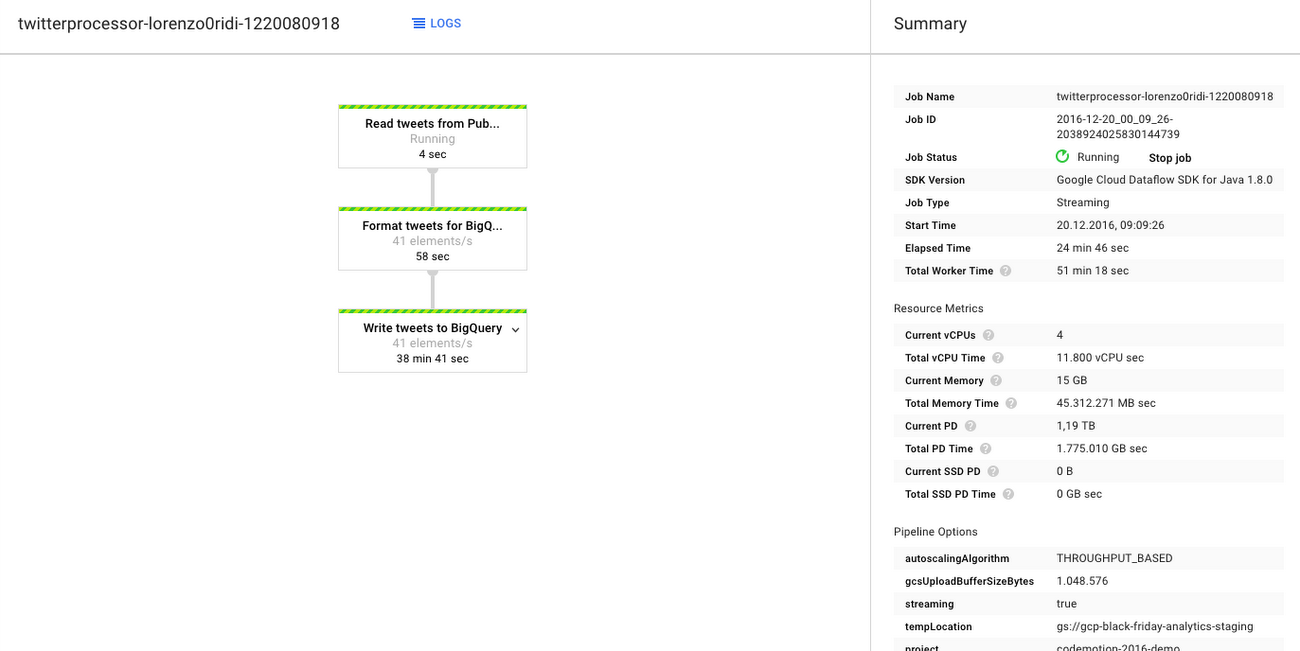
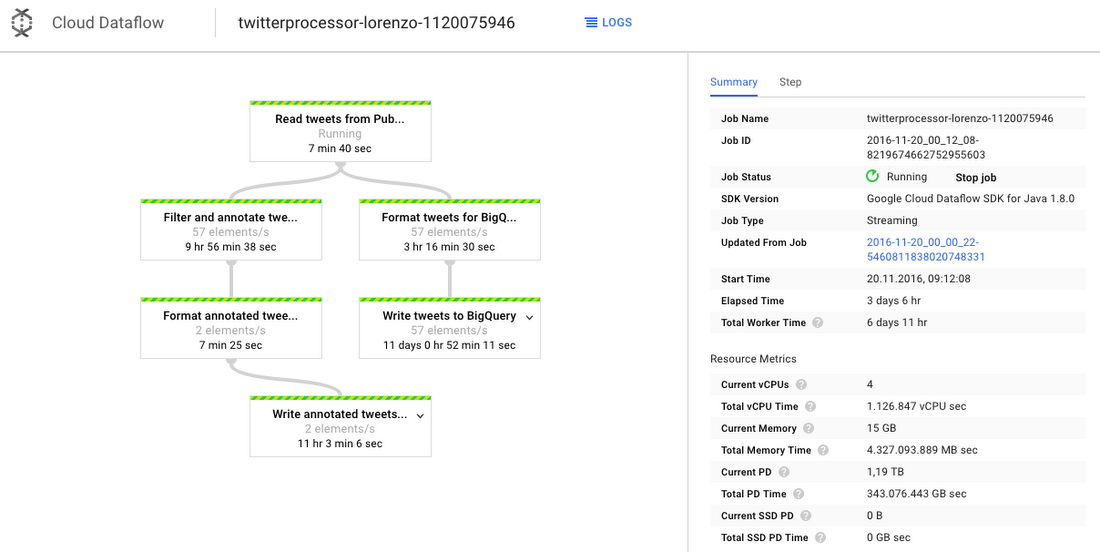
Once the pipeline has been started, it can be monitored from the Web Console.
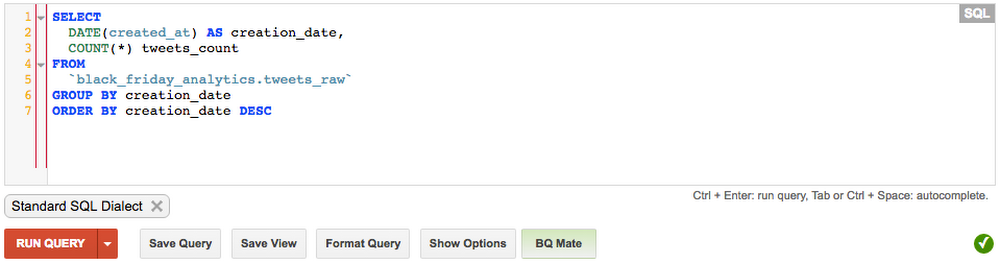
At this point, if everything works fine, the architects will observe the data flowing into the BigQuery table. The best way to check is to execute some queries on the table, using the Web interface:
Analysis
After a few days of collection, the ACME architects decide to try some more complex analysis. The following query reflects the expressiveness of BigQuery’s SQL support, which is compliant with the SQL:2011 standard:Notice the nested query here: The innermost one counts the number of tweets coming every day from each of the four US time zones — a sort of pivot, elaborated through the use of SUM() and IF() functions. The outermost one uses one of BigQuery’s analytical functions (Window Functions) to calculate a rolling average of the values on the three previous days.
Now, to close the circle, after finding some interesting analyses, the architects decide to share the results in the form of visualizations. For this purpose, they use Google Data Studio, which allows you to build various types of graphical visualizations from different data sources, including BigQuery. They can then share the dashboards, or make them publicly accessible, just as you would with a Google Drive document.
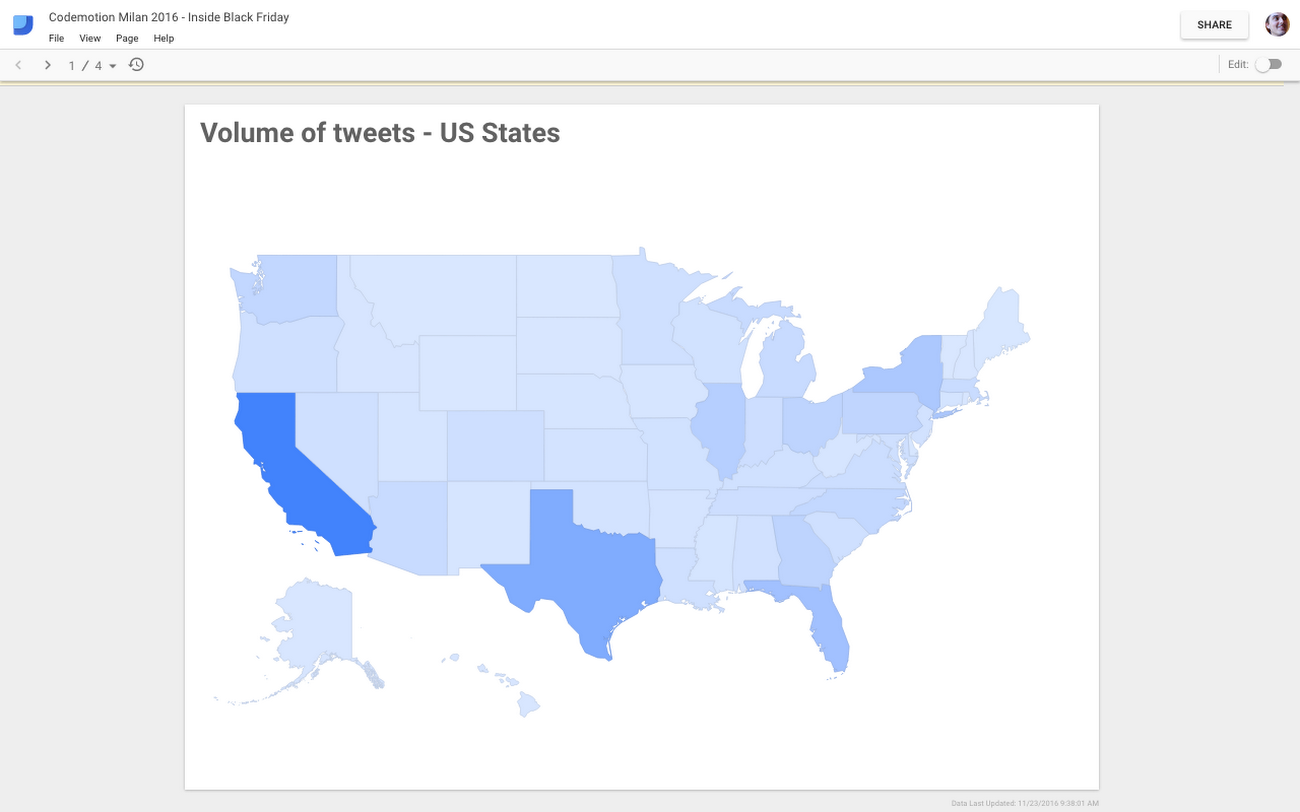
For example, the graph above shows the number of collected tweets originating from each state in the U.S. Although this finding is somewhat useful for making investment decisions, the ACME architects realize that they could get even more value out of “Black Friday tweets” with deeper analysis.
Bringing machine learning to the pipeline
ACME soon learns that GCP offers a set of machine-learning APIs designed to bring a bit more intelligence to the analysis process. In particular, the Google Cloud Natural Language API could be useful for capturing the sentiment of each tweet —i.e., a numerical indicator of the positivity (or negativity) of the text contained in the message.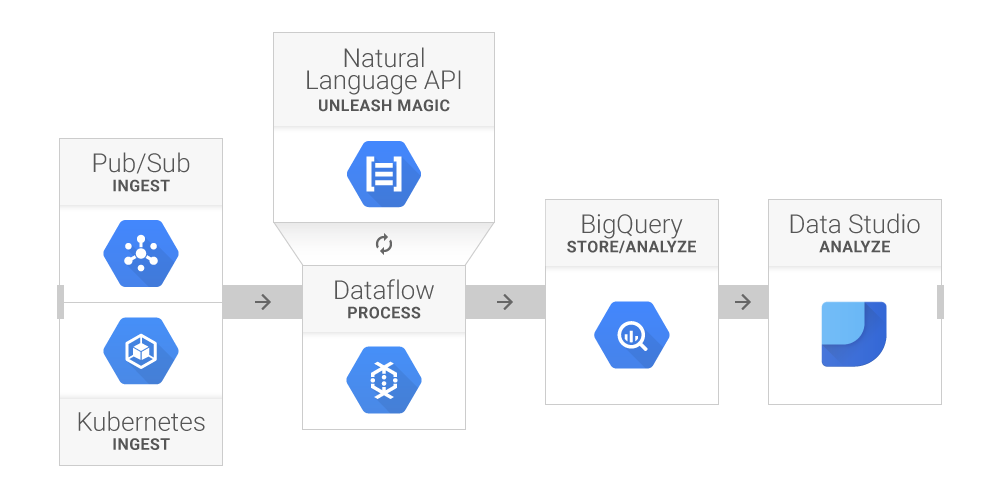
Simply enough, the API, which basically provides REST access to a pre-built/pre-trained model, takes as input a piece of text (such as a tweet) and returns two parameters:
- Polarity (FLOAT variable from -1 to 1) expresses the mood of the text; positive values denote positive feelings.
- Magnitude (FLOAT variable from 0 to +inf) expresses the number of intense words used in the text. Higher values denote stronger feelings (whether they be anger or joy), although the actual magnitude has to be interpreted in conjunction with the length of the text.
So, the architects need to modify the Cloud Dataflow pipeline to include this new step —which is relatively simple due to the ability to reuse existing code.
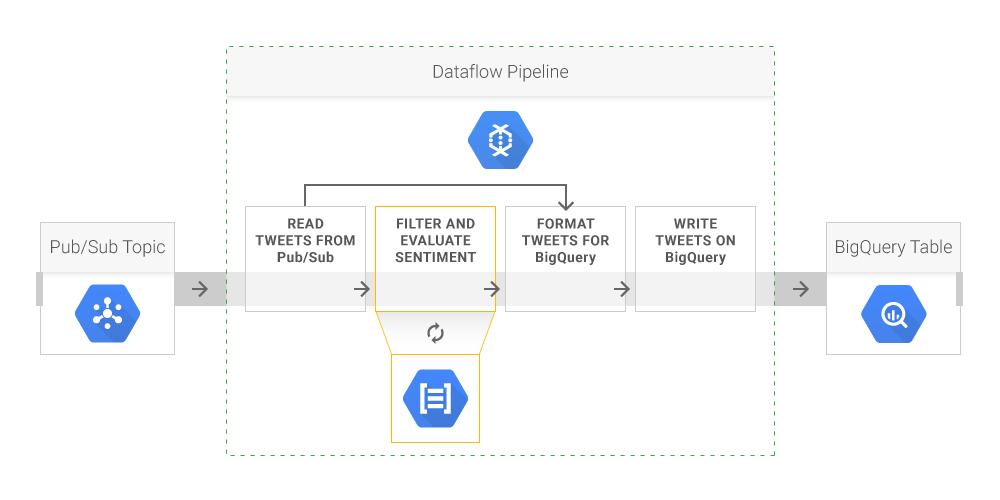
Furthermore, thanks to a rolling update mechanism, this update does not require any interruption of data flow. All that's needed is to set it inside the Maven command that does the build, using the --update flag:
ACME is now off and running!
Results
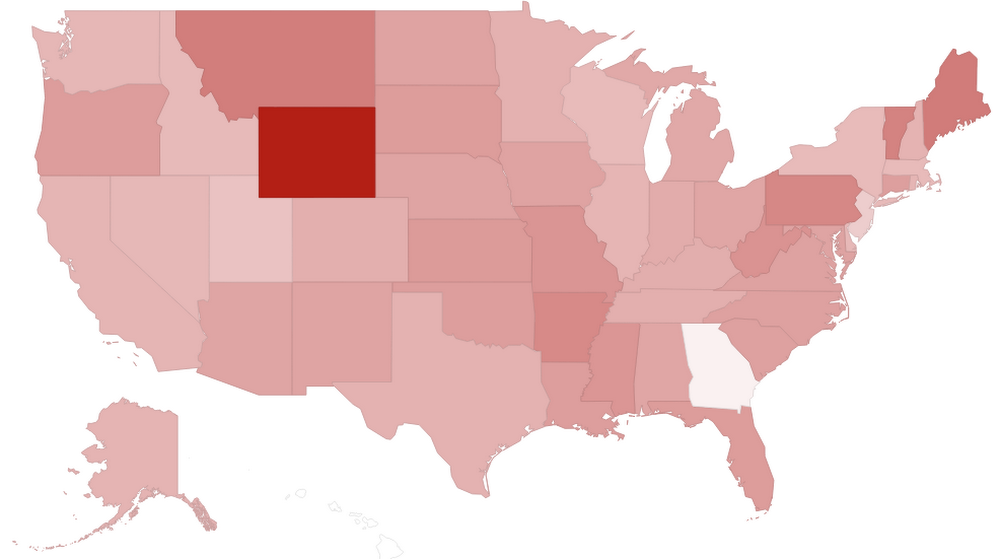
With this new data and enhance pipeline, ACME can do far more interesting analyses that inform its decision-makers about the geographical and temporal distribution of customer sentiment before and during the Black Friday event.For example, the map below shows the average sentiment recorded in each state: darker colors represent more negative sentiments. The red square in the middle is Wyoming, which may indicate the need for a targeted campaign in that state.
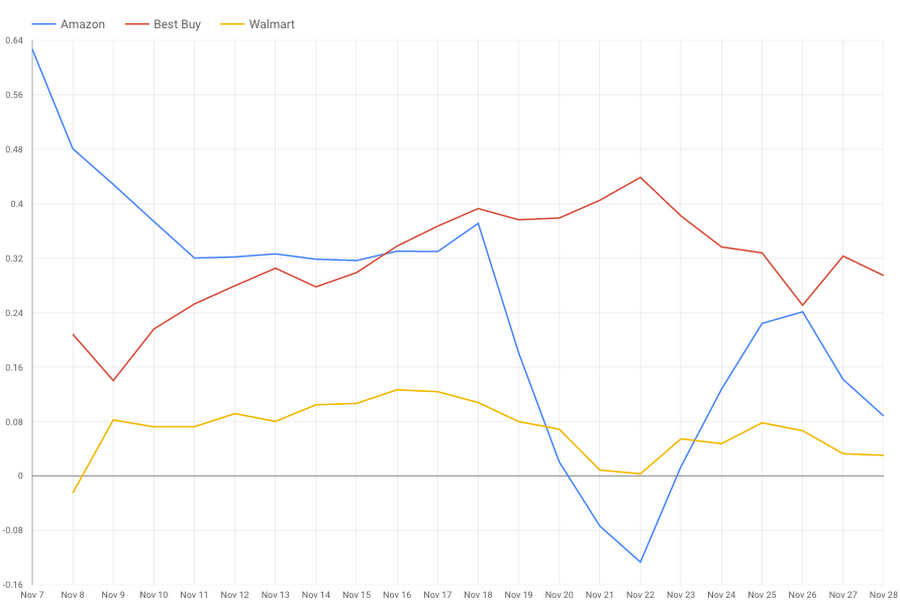
This other analysis returns the sentiment trend related to three major retailers. From this simple analysis, with a little drill-down on the data, ACME analysts see some interesting trends:
- Twitter users did not appreciate one retailer’s decision to start its sales the day before Black Friday (i.e., on Thanksgiving itself). Its popularity seems to have suffered since early November, possibly by this decision (gold line).
- The pre-Black Friday promotional sales of another retailer (starting on November 18) were initially heavily criticized by users, with a collapse in popularity that reached its peak on November 22 (blue line).
- The third retailer seems to have increased its good reputation in the lead up to Black Friday (red line).
The above insights are pretty instructive for ACME’s own planning, so it can determine which mistakes to avoid and which opportunities to explore.
Next steps
As you can see from this simple example, ACME took advantage of several GCP components to build a serverless data analysis pipeline, and then added machine-learning functionality to the mix for sentiment analysis via a highly-consumable REST API (with no models needing to be built or trained). I hope that his architectural pattern will be inspirational for your own projects!Learn more via the following blog posts: