Revevol: How we built a BI dashboard with GCP to track G Suite adoption
Stanislas Marion
Principal Engineer, Revevol
Editor’s note: Want inspiration on how to use Google Cloud Platform’s extensive data analytics and visualization tools? Using a combination of App Engine, Cloud Storage, Cloud Dataflow, BigQuery and Data Studio, Google Cloud partner Revevol created a series of dashboards to help a client better understand how its employees were using G Suite. Read on to learn how Revevol did it.
Here at Revevol, we’ve deployed G Suite at dozens of companies, migrating over 400k users and training 80k people with our change management programs. After using G Suite for a few years, one of our largest clients, a 30k-employee global industrial company, wanted to understand more about how their employees were actually using G Suite. They needed a more data-driven approach to service delivery and change management in order to optimize collaboration.
But with their complex organizational structure, questions like, “How is G Suite being used in my organization?” “Where are people struggling?” and “How do we improve?” were nearly impossible to answer using the G Suite admin console. They turned to us to give them a comprehensive picture of their users’ G Suite usage based on activity logs and metadata.
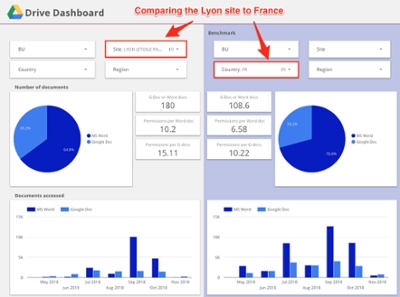
As a long-time GCP shop, for both our projects and products (like AODocs), we naturally turned to GCP to build the solution. Our customer wanted to be able to display usage and activity data filtered by location, country, region, business unit and time, and export data to spreadsheets for further analysis. This entailed joining data from G Suite Directory and G Suite usage, and displaying it through a filterable business intelligence (BI) dashboard that looks like this:
At a high level, the architecture is as follows: we extract data from the G Suite APIs using App Engine, store it in Google Cloud Storage, transform it in Cloud Dataflow and store it in BigQuery for analysis. We then use Data Studio for visualization. Let’s go over each of these components.
Data extraction
The first step in building a solution like this is to extract the data. There are two ways to do so: with REST APIs and the BigQuery Export feature.
REST APIs
G Suite provides a large number of REST APIs that allow querying for services metadata, such as documents that are stored in Google Drive and activity logs. In this case, we developed an extraction module on top of App Engine. App Engine is great because it is completely serverless and can scale up and down without having to tweak the configuration, provision capacity, or handle load balancing.
There are a number of APIs from which to extract data and two kinds of extractions: snapshots of the current state and activity logs. Snapshots are extracted from the Directory API, the Drive API, or the Groups Settings API. The Directory extraction stores a list of users in BigQuery. For Drive, we request all the documents owned by each user by impersonating a service account, a special type of Google account that belongs to your application rather than to an individual end user. Your application assumes the identity of the service account to call Google APIs so that the users aren't directly involved. Thanks to the integration of identity between G Suite and GCP, this a breeze.
We make requests to the API using Google Cloud Tasks. Each user gets its own Task in a Task Queue, and we launch up to 100 tasks at a time. All API responses are pushed to Cloud Storage. If the user owns so many documents that it’s impossible to page through all of them inside of the 10-minute limit, the user’s task adds itself back to the task queue. If an extraction fails, it also goes back into the queue. The state of the extraction is maintained as a decreasing counter in Memcache that is updated by each task if it’s successful. Once the counter hits 0, the job is done, triggering backup/transformation jobs.
If you’ve been paying attention, you’re probably wondering, “What about Team Drives?”—how do I extract data from documents stored there? Great question. While you can as an admin get the list of all the Team Drives in a domain, you cannot then list the documents stored inside of these Team Drives, so it is a bit complex. This is how we do it: First we list all the Team Drives in the domain. Then we go through each user one by one in order to find a user belonging to each Team Drive, and be able to impersonate them with the service account, and finally, list the files in the Team Drive.
Thanks to the power and flexibility of Google Cloud Tasks, we were able to implement a parallel and coordinated task queue very easily, without worrying about servers, and extract all the Drive metadata content of a 35k-employee company in under 10 minutes. In fact, the bottleneck here is the Drive API quota.
Extracting activity logs is more straightforward as they come from the Admin Report API, so there is no need to impersonate all the users. As time-series data, we query it daily, triggered by a cronjob in App Engine, again relying on Task Queues.
BigQuery Exports
Unlike with other G Suite products, G Suite Enterprise customers can export Gmail daily logs directly into BigQuery. This is an example of the tight integration between G Suite and GCP. If similar export capabilities existed for other G Suite services, we would completely bypass the APIs and implement the whole solution without writing a single line of code (except SQL queries of course).
Data transformation and storage
The data that was exported from the REST APIs now lies in Cloud Storage in raw JSON, and we keep it there for backup and archiving purposes. For analysis, however, we need to copy it over to BigQuery. At the end of each extraction, a message is sent to the Cloud Pub/Sub topic that we’ve subscribed to using Cloud Functions. The cloud function loads the data using the BigQuery and Cloud Storage APIs:
If we want to transform the data before it reaches BigQuery, we can use Cloud Dataflow in batch mode. Otherwise we can use BigQuery queries to create transformed tables from the raw tables. Your decision will likely be guided by two factors:
- Costs: The BigQuery and Dataflow pricing models are very different. If your transformations frequently scan large tables, BigQuery costs can quickly add up.
- Maintenance overhead: It’s typically easier to maintain Cloud Dataflow and its clear, readable code, compared to the typical long, complex, unversioned SQL queries that are stored in BigQuery’s web UI.
We currently do transformations in BigQuery as it is faster to prototype, but we plan on moving some of the larger ones to Cloud Dataflow soon. We might also experiment with Cloud Dataprep which could enable us to describe Dataflow transformation pipelines without coding, but we haven’t tried it yet.
Data visualization
Data Studio, a free BI product that’s part of Google Marketing Platform (GMP), is a great example of the tight integration between Google Cloud and the greater Google ecosystem. Data Studio dashboards obey the same access patterns as Google Docs and Sheets, (user, group and domain permissions), have the same real-time collaboration features, and are available to anyone who has a Google account.
From the outset, our client wanted one dashboard per G Suite service—one for Google Drive, Gmail, Hangouts Meet, etc. Data Studio provides a connector to BigQuery, which enables the creation of data sources based on BigQuery tables. Whoever creates the data source is the only person who needs access to the underlying dataset, and G Suite credentials allow authentication to happen in the background, with nothing to configure.
We created one data source per dashboard, to which we added charts and KPIs through the Data Studio UI. Thus, without writing any front-end code or SQL, we are able to display KPIs and charts based on BigQuery tables, all in a slick, professional dashboard, as well as add filters.
While Data Studio can be magical, there are some things to keep in mind. For instance:
- Having additional aggregation functions like AVG_DISTINCT can help to display the average number of Meet meeting participants filtered by location.
- If the simple G Suite/Drive-based access control does not work for your use case, you might have to implement a custom solution using row-level access in BigQuery or building your own Community Connector.
- While reusable templates exist, declarative (YAML-like) sources would be great to industrialize dashboard management and maintenance.
- There is no easy way to drill down into the underlying data that was used to build the chart.
- Security controls on BigQuery data sources make collaborating on them slightly difficult: it would be great to be able to view the query even as a non-owner.
We look forward to seeing some of these features in future releases of Data Studio. That said, Data Studio is a simple, but seriously powerful BI product that you can use for a long time before needing to use a competitive paid offering.
Data exports
As you might recall, our customer asked for a way to export underlying chart data to a spreadsheet for further analysis. Here we once again took advantage of integrations between G Suite and GCP, using the brand new Google Sheets data connector for BigQuery. It’s very straightforward to use: just select your project and schema from the Google Sheets UI, insert your query (which can be parameterized), run it and voilà!
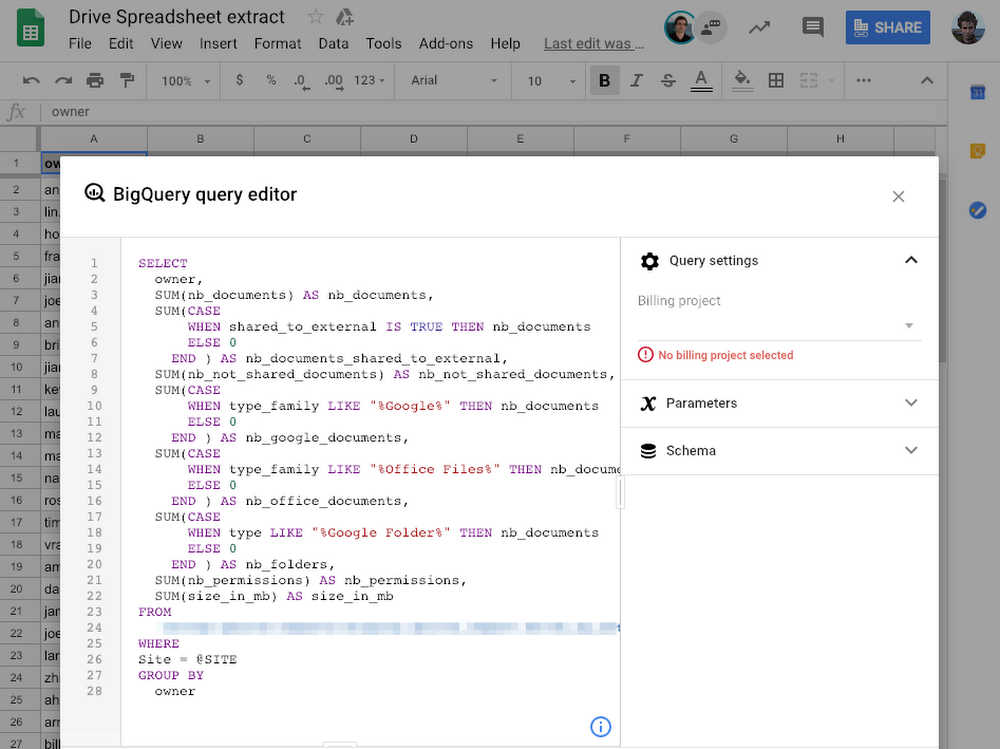
Google Sheets also provides a refresh button for spreadsheet end-users to refresh the data.
It’s important to realize that both in the visualization and export use cases, if GCP and G Suite services weren’t so well integrated, we would have had to create a complex API to expose data from BigQuery, handle authentication, and maintain it as our queries or schemas changed. With this solution, we didn’t have to do any of this.
Conclusion
The brunt of our work fell into three areas:
- Extracting data from the APIs. In and of itself, this process adds no business value and could be completely bypassed if G Suite exported metadata and logs for all services directly into BigQuery, as it does for Gmail.
- Transforming the data to make it valuable from a business point of view. This is where our expertise in G Suite collaboration really shined through.
- Creating dashboards to make the transformed data easy to consume and adds a lot of business value.
Notably absent from this list is integrating services together, or performing DevOps tasks such as setting up logging infrastructure, managing database capacity, replication and backup, and setting up networking and VMs. This allowed us to deliver a working business intelligence solution quickly with a very small team of empowered developers, and is consistent with our overall impression of GCP: it does an amazing job of letting us focus on adding business value, rather than tending to servers and writing integration code. If you have further questions about how we built this solution, or if you want to learn more about Revevol and our offerings, you can find me at stanislas.marion@revevol.eu.