익숙하게 즐겨 사용하는 Vertex AI의 모든 기능을 이제 Gemini Enterprise Agent Platform에서 사용할 수 있습니다. 공지 블로그에서 자세히 알아보세요.

Gemini Enterprise 에이전트 플랫폼
엔터프라이즈용 에이전트 혁신, 빌드, 배포
Gemini Enterprise Agent Platform은 개발자가 에이전트를 빌드, 확장, 제어, 최적화할 수 있는 Google Cloud의 포괄적인 플랫폼입니다. 기술팀이 엔터프라이즈 애플리케이션과 워크플로를 강력한 에이전트 시스템으로 혁신할 수 있는 에이전트를 빌드할 수 있는 단일 목적지입니다.
신규 고객에게는 최대 $300의 무료 크레딧이 제공되어 Agent Platform 및 기타 Google Cloud 제품을 사용해 볼 수 있습니다.

기능
엔터프라이즈급 AI 에이전트 빌드, 확장, 제어, 최적화
Agent Platform은 기업이 엔터프라이즈 데이터에 기반한 엔터프라이즈급 에이전트를 신속하게 빌드, 확장, 제어, 최적화할 수 있도록 지원하는 Google Cloud의 개방적이고 포괄적인 플랫폼입니다. 애플리케이션과 워크플로를 전 세계 규모로 강력하고 안정적인 에이전트 시스템으로 전환하는 데 필요한 풀 스택 기반과 광범위한 개발자 선택권을 제공합니다.
Google의 가장 뛰어난 멀티모달 모델 Gemini
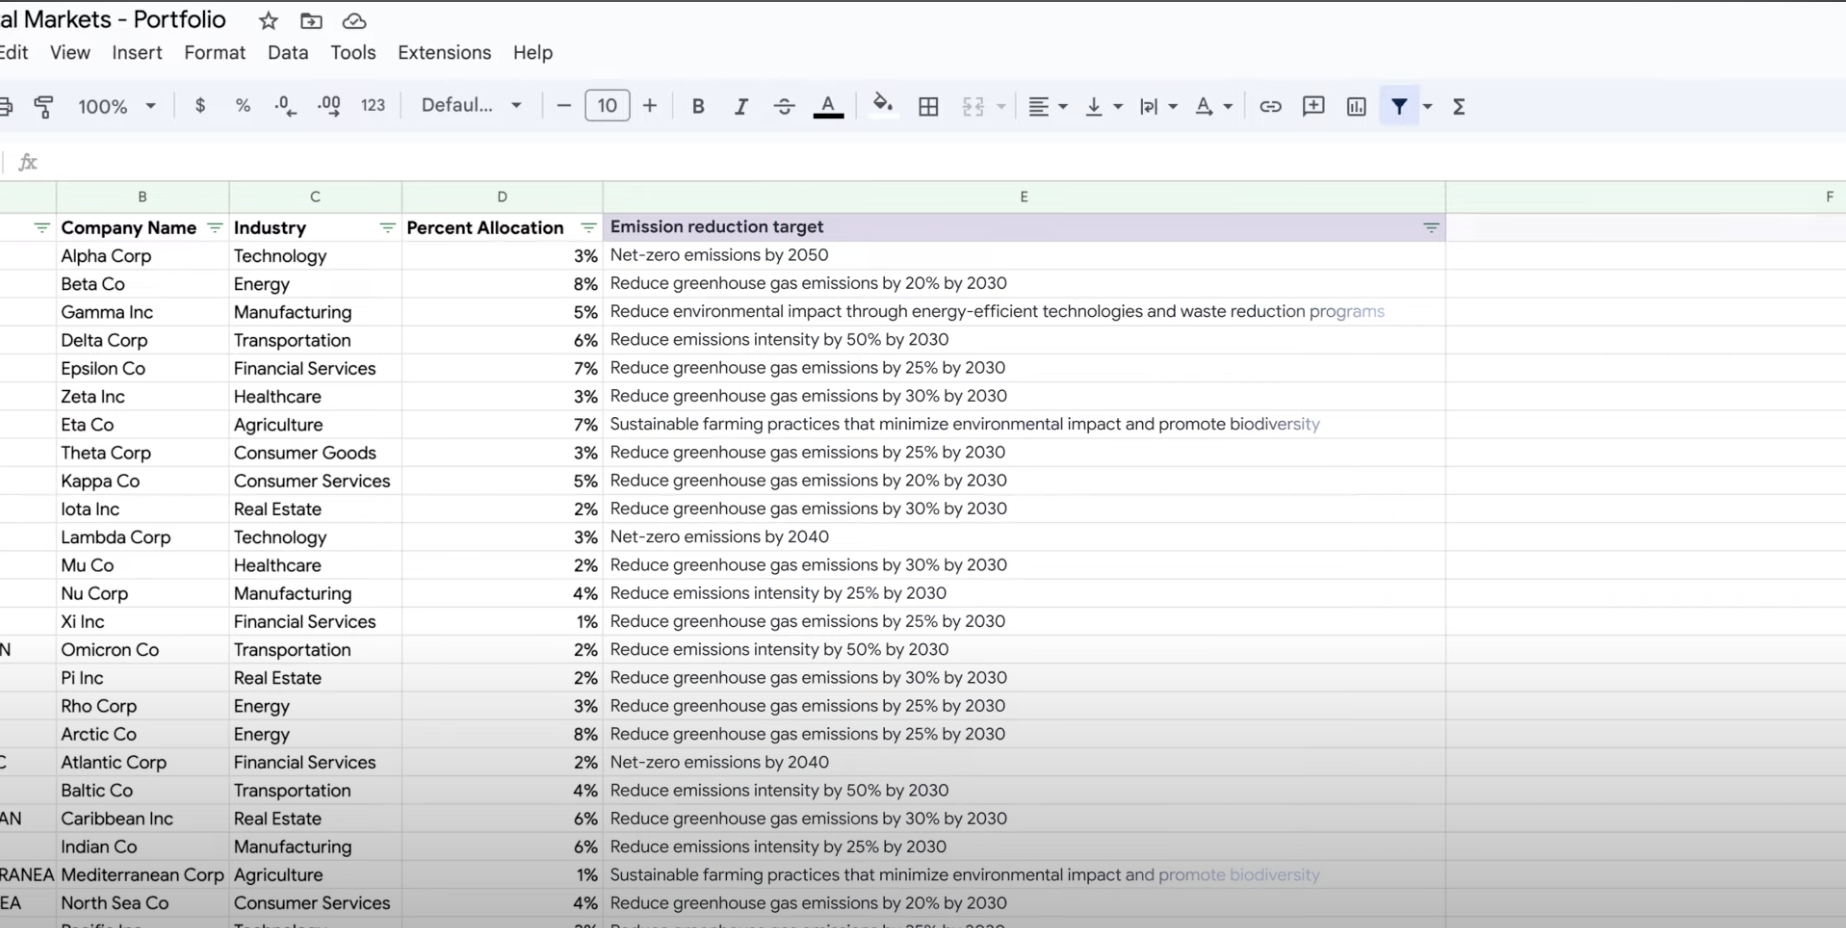
Agent Platform은 Gemini 3을 비롯한 Google의 최신 Gemini 모델에 대한 액세스를 제공합니다. Gemini는 거의 모든 입력을 이해하고 다양한 유형의 정보를 결합하며 거의 모든 출력을 생성할 수 있습니다. 텍스트, 이미지, 동영상 또는 코드를 사용하여 Agent Studio에서 Gemini에 프롬프트를 작성하고 테스트할 수 있습니다. Gemini의 고급 추론과 최신 생성 기능을 사용하여 개발자는 이미지에서 텍스트를 추출하고 이미지 텍스트를 JSON으로 변환하기 위한 샘플 프롬프트를 시도하고, 업로드된 이미지에 대한 답변을 생성하여 차세대 AI 애플리케이션을 빌드할 수 있습니다.
Model Garden의 200개 이상의 생성형 AI 모델 및 도구
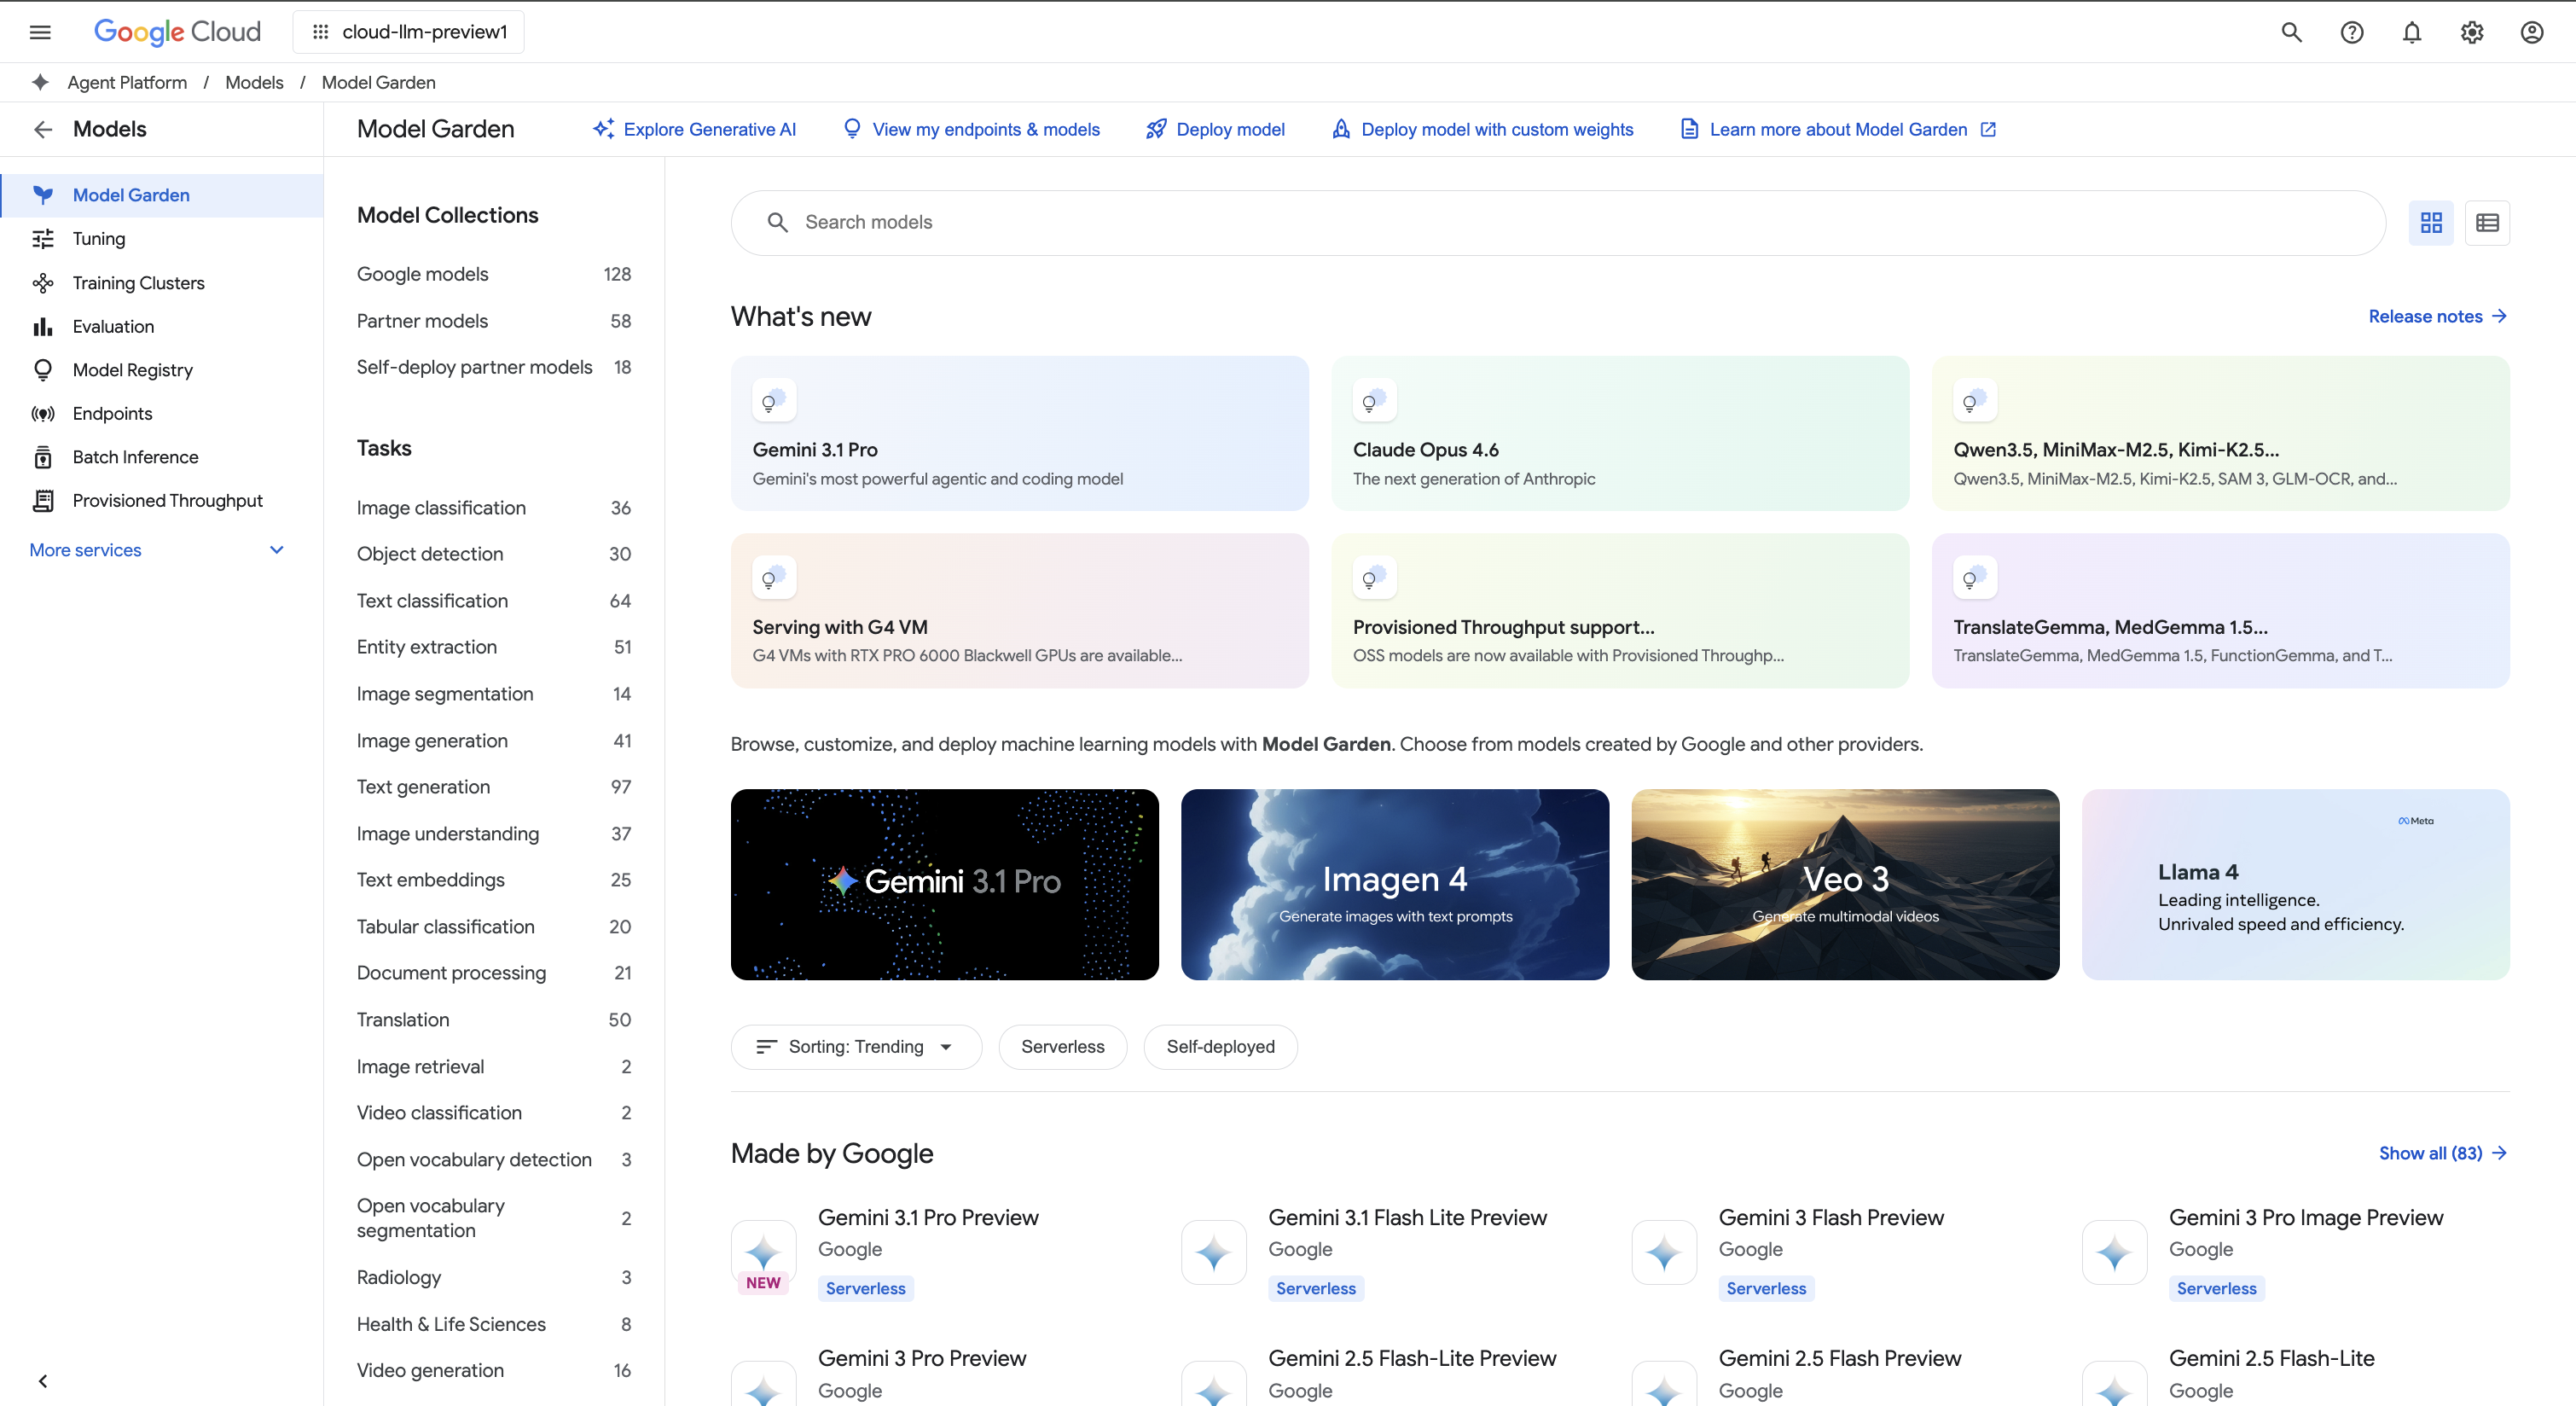
Model Garden에서 퍼스트 파티(Gemini, Imagen, Lyria, Chirp, Veo), 서드 파티(Anthropic의 Claude 모델 제품군), 개방형 모델(Gemma, Llama) 등 다양한 모델 중에서 선택할 수 있습니다. 확장 프로그램을 사용하여 모델이 실시간 정보를 검색하고 작업을 트리거할 수 있게 합니다. 또한 다양한 조정 옵션으로 사용 사례에 맞게 모델을 맞춤설정할 수 있습니다.
Google Cloud의 모델 평가 서비스는 생성형 AI 모델을 객관적이고 데이터 기반으로 평가할 수 있는 엔터프라이즈급 도구를 제공합니다.
개방형 및 통합형 AI Platform
데이터 과학자는 Agent Platform 도구를 사용하여 ML 모델의 학습, 조정, 배포 속도를 높일 수 있습니다.
원하는 Colab Enterprise 또는 Workbench를 포함한 Agent Platform 노트북은 기본적으로 BigQuery와 통합되어 모든 데이터 및 AI 워크로드를 아우르는 단일 표시 경로를 제공합니다.
Agent Platform Training과 Prediction을 사용하면 선택한 오픈소스 프레임워크 및 최적화된 AI 인프라로 학습 시간을 줄이고 모델을 프로덕션에 쉽게 배포할 수 있습니다.
예측 및 생성형 AI를 위한 MLOps
Agent Platform은 데이터 과학자와 ML 엔지니어가 ML 프로젝트를 자동화, 표준화, 관리할 수 있도록 특화된 MLOps 도구를 제공합니다.
모듈식 도구는 팀 간 협업과 전체 개발 수명 주기 전반에서 모델을 개선하는 데 도움이 됩니다. Gen AI Evaluation을 통해 사용 사례에 가장 적합한 모델을 파악하고, Pipelines로 워크플로를 조정하며, Model Registry로 모든 모델을 관리하고, Feature Store를 통해 ML 특성을 서빙, 공유, 재사용하며, 모델의 입력 편향과 드리프트를 모니터링할 수 있습니다.
작동 방식
Agent Platform은 에이전트 빌드, 모델 학습 및 배포를 위한 여러 옵션을 제공합니다.
- Agent Platform을 사용하면 하나의 통합 플랫폼에서 엔터프라이즈급 에이전트를 빌드, 확장, 제어, 최적화할 수 있습니다.
- 생성형 AI를 사용하면 Gemini 3을 포함한 대규모 생성형 AI 모델에 액세스할 수 있으므로 AI 기반 애플리케이션에 사용할 수 있도록 평가, 조정, 배포할 수 있습니다.
- Model Garden을 사용하면 Agent Platform에서 검색, 테스트, 맞춤설정, 배포하고 오픈소스(OSS) 모델 및 애셋을 선택할 수 있습니다.
- 커스텀 학습을 사용하면 선호하는 ML 프레임워크 사용, 자체 학습 코드 작성, 하이퍼파라미터 조정 옵션 선택 등 학습 프로세스를 완벽하게 제어할 수 있습니다.
AI 에이전트 빌드 및 배포
Agent Platform으로 고급 AI 기능 활용
Agent Platform으로 고급 AI 기능 활용
사용자 규모에 맞게 확장되는 플랫폼에서 프로덕션에 즉시 사용 가능한 생성형 AI 에이전트와 애플리케이션을 빌드하세요. Google Cloud의 Agent Platform은 AI 모델과 애플리케이션을 개발하고 배포할 수 있는 안전한 환경을 제공합니다.
개발자에게 Agent Platform은 에이전트 개발 키트(ADK)와 같은 프레임워크를 사용하여 정교한 에이전트를 빌드, 맞춤설정, 미세 조정할 수 있는 고급 플랫폼으로 남아 있습니다.
이 Codelab을 시작하고 지금 바로 첫 번째 AI 애플리케이션을 빌드하세요.
튜토리얼, 빠른 시작, 실습
Agent Platform으로 고급 AI 기능 활용
Agent Platform으로 고급 AI 기능 활용
사용자 규모에 맞게 확장되는 플랫폼에서 프로덕션에 즉시 사용 가능한 생성형 AI 에이전트와 애플리케이션을 빌드하세요. Google Cloud의 Agent Platform은 AI 모델과 애플리케이션을 개발하고 배포할 수 있는 안전한 환경을 제공합니다.
개발자에게 Agent Platform은 에이전트 개발 키트(ADK)와 같은 프레임워크를 사용하여 정교한 에이전트를 빌드, 맞춤설정, 미세 조정할 수 있는 고급 플랫폼으로 남아 있습니다.
이 Codelab을 시작하고 지금 바로 첫 번째 AI 애플리케이션을 빌드하세요.
Gemini 모델로 빌드
Google의 멀티모달 모델 시작하기
Google의 멀티모달 모델 시작하기
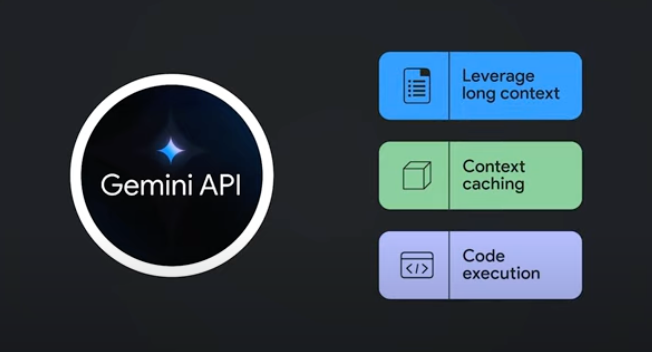
Agent Platform의 Gemini API를 통해 Gemini 모델에 액세스
- Python
- JavaScript
- Java
- Go
- Curl
튜토리얼, 빠른 시작, 실습
Google의 멀티모달 모델 시작하기
Google의 멀티모달 모델 시작하기
코드 샘플
Agent Platform의 Gemini API를 통해 Gemini 모델에 액세스
- Python
- JavaScript
- Java
- Go
- Curl
데이터 추출, 요약, 분류
생성형 AI를 통한 요약, 분류, 추출
생성형 AI를 통한 요약, 분류, 추출
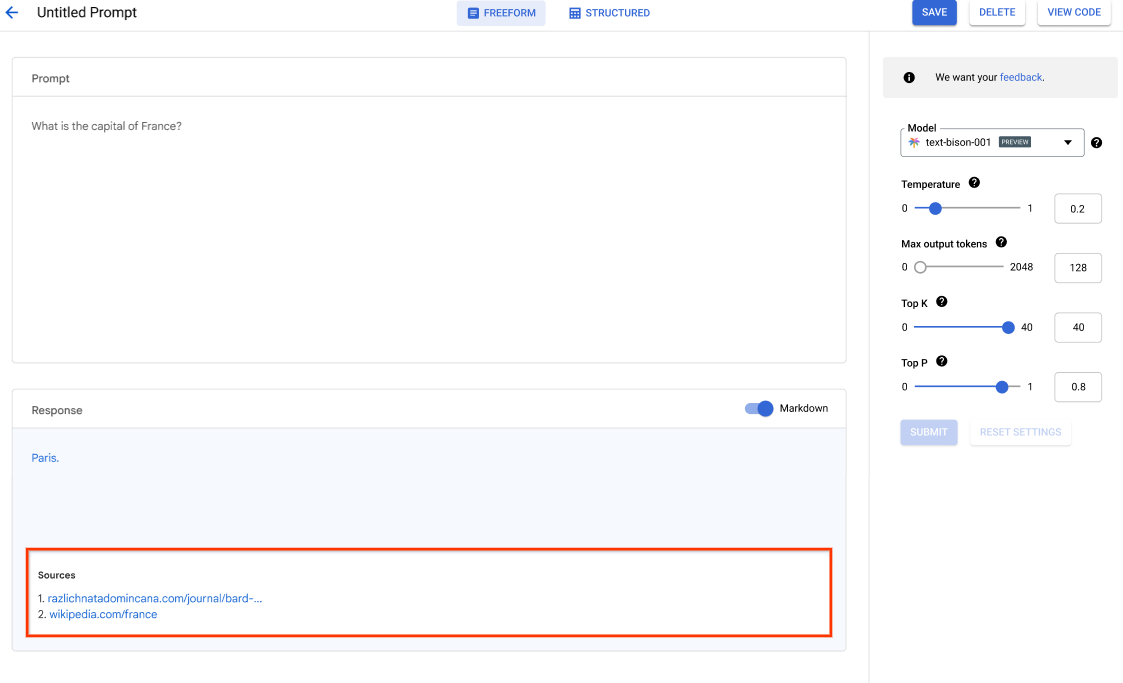
Agent Platform의 생성형 AI 지원으로 작업을 원하는 만큼 처리하기 위한 텍스트 프롬프트를 만드는 방법을 알아봅니다. 가장 일반적인 작업으로는 분류, 요약, 추출이 있습니다. Agent Platform의 Gemini를 사용하면 구조와 형식 측면에서 유연하게 프롬프트를 설계할 수 있습니다.
튜토리얼, 빠른 시작, 실습
생성형 AI를 통한 요약, 분류, 추출
생성형 AI를 통한 요약, 분류, 추출
Agent Platform의 생성형 AI 지원으로 작업을 원하는 만큼 처리하기 위한 텍스트 프롬프트를 만드는 방법을 알아봅니다. 가장 일반적인 작업으로는 분류, 요약, 추출이 있습니다. Agent Platform의 Gemini를 사용하면 구조와 형식 측면에서 유연하게 프롬프트를 설계할 수 있습니다.
프로덕션 사용을 위한 모델 배포
일괄 또는 온라인 예측을 위한 배포
일괄 또는 온라인 예측을 위한 배포
모델을 사용하여 실제 문제를 해결할 준비가 되었다면 모델을 Model Registry에 등록하고 Agent Platform Prediction 서비스를 사용하여 일괄 및 온라인 예측을 수행하세요.
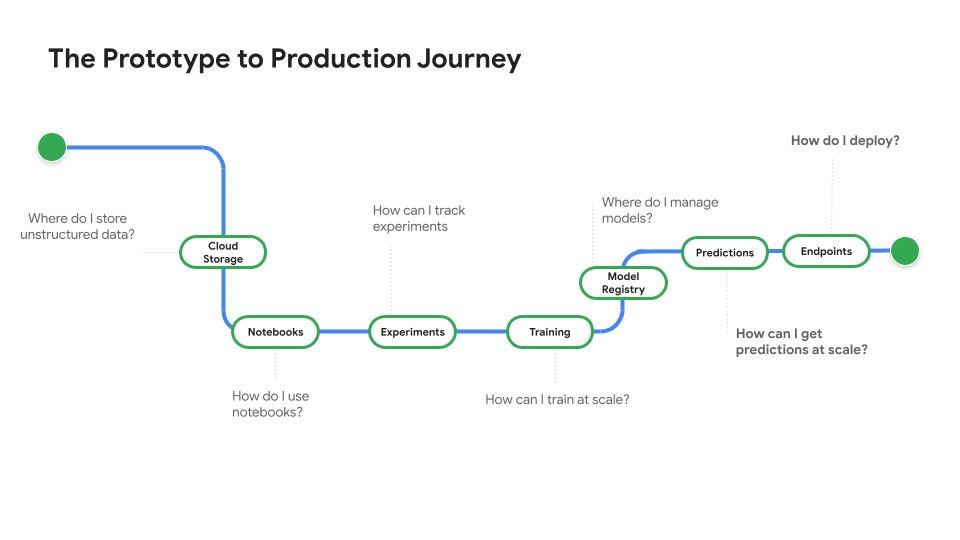
노트북 코드부터 배포된 모델까지 살펴볼 수 있는 동영상 시리즈인 프로토타입부터 프로덕션까지를 시청하세요.
튜토리얼, 빠른 시작, 실습
일괄 또는 온라인 예측을 위한 배포
일괄 또는 온라인 예측을 위한 배포
모델을 사용하여 실제 문제를 해결할 준비가 되었다면 모델을 Model Registry에 등록하고 Agent Platform Prediction 서비스를 사용하여 일괄 및 온라인 예측을 수행하세요.
노트북 코드부터 배포된 모델까지 살펴볼 수 있는 동영상 시리즈인 프로토타입부터 프로덕션까지를 시청하세요.
커스텀 모델 학습
커스텀 모델 학습 개요 및 문서
커스텀 모델 학습 개요 및 문서
Agent Platform의 커스텀 학습 워크플로, 커스텀 학습의 이점, 사용 가능한 다양한 학습 옵션에 대한 개요를 확인하세요. 또한 이 페이지에서는 데이터 준비부터 예측까지 ML 학습 워크플로와 관련된 모든 단계를 자세히 설명합니다.
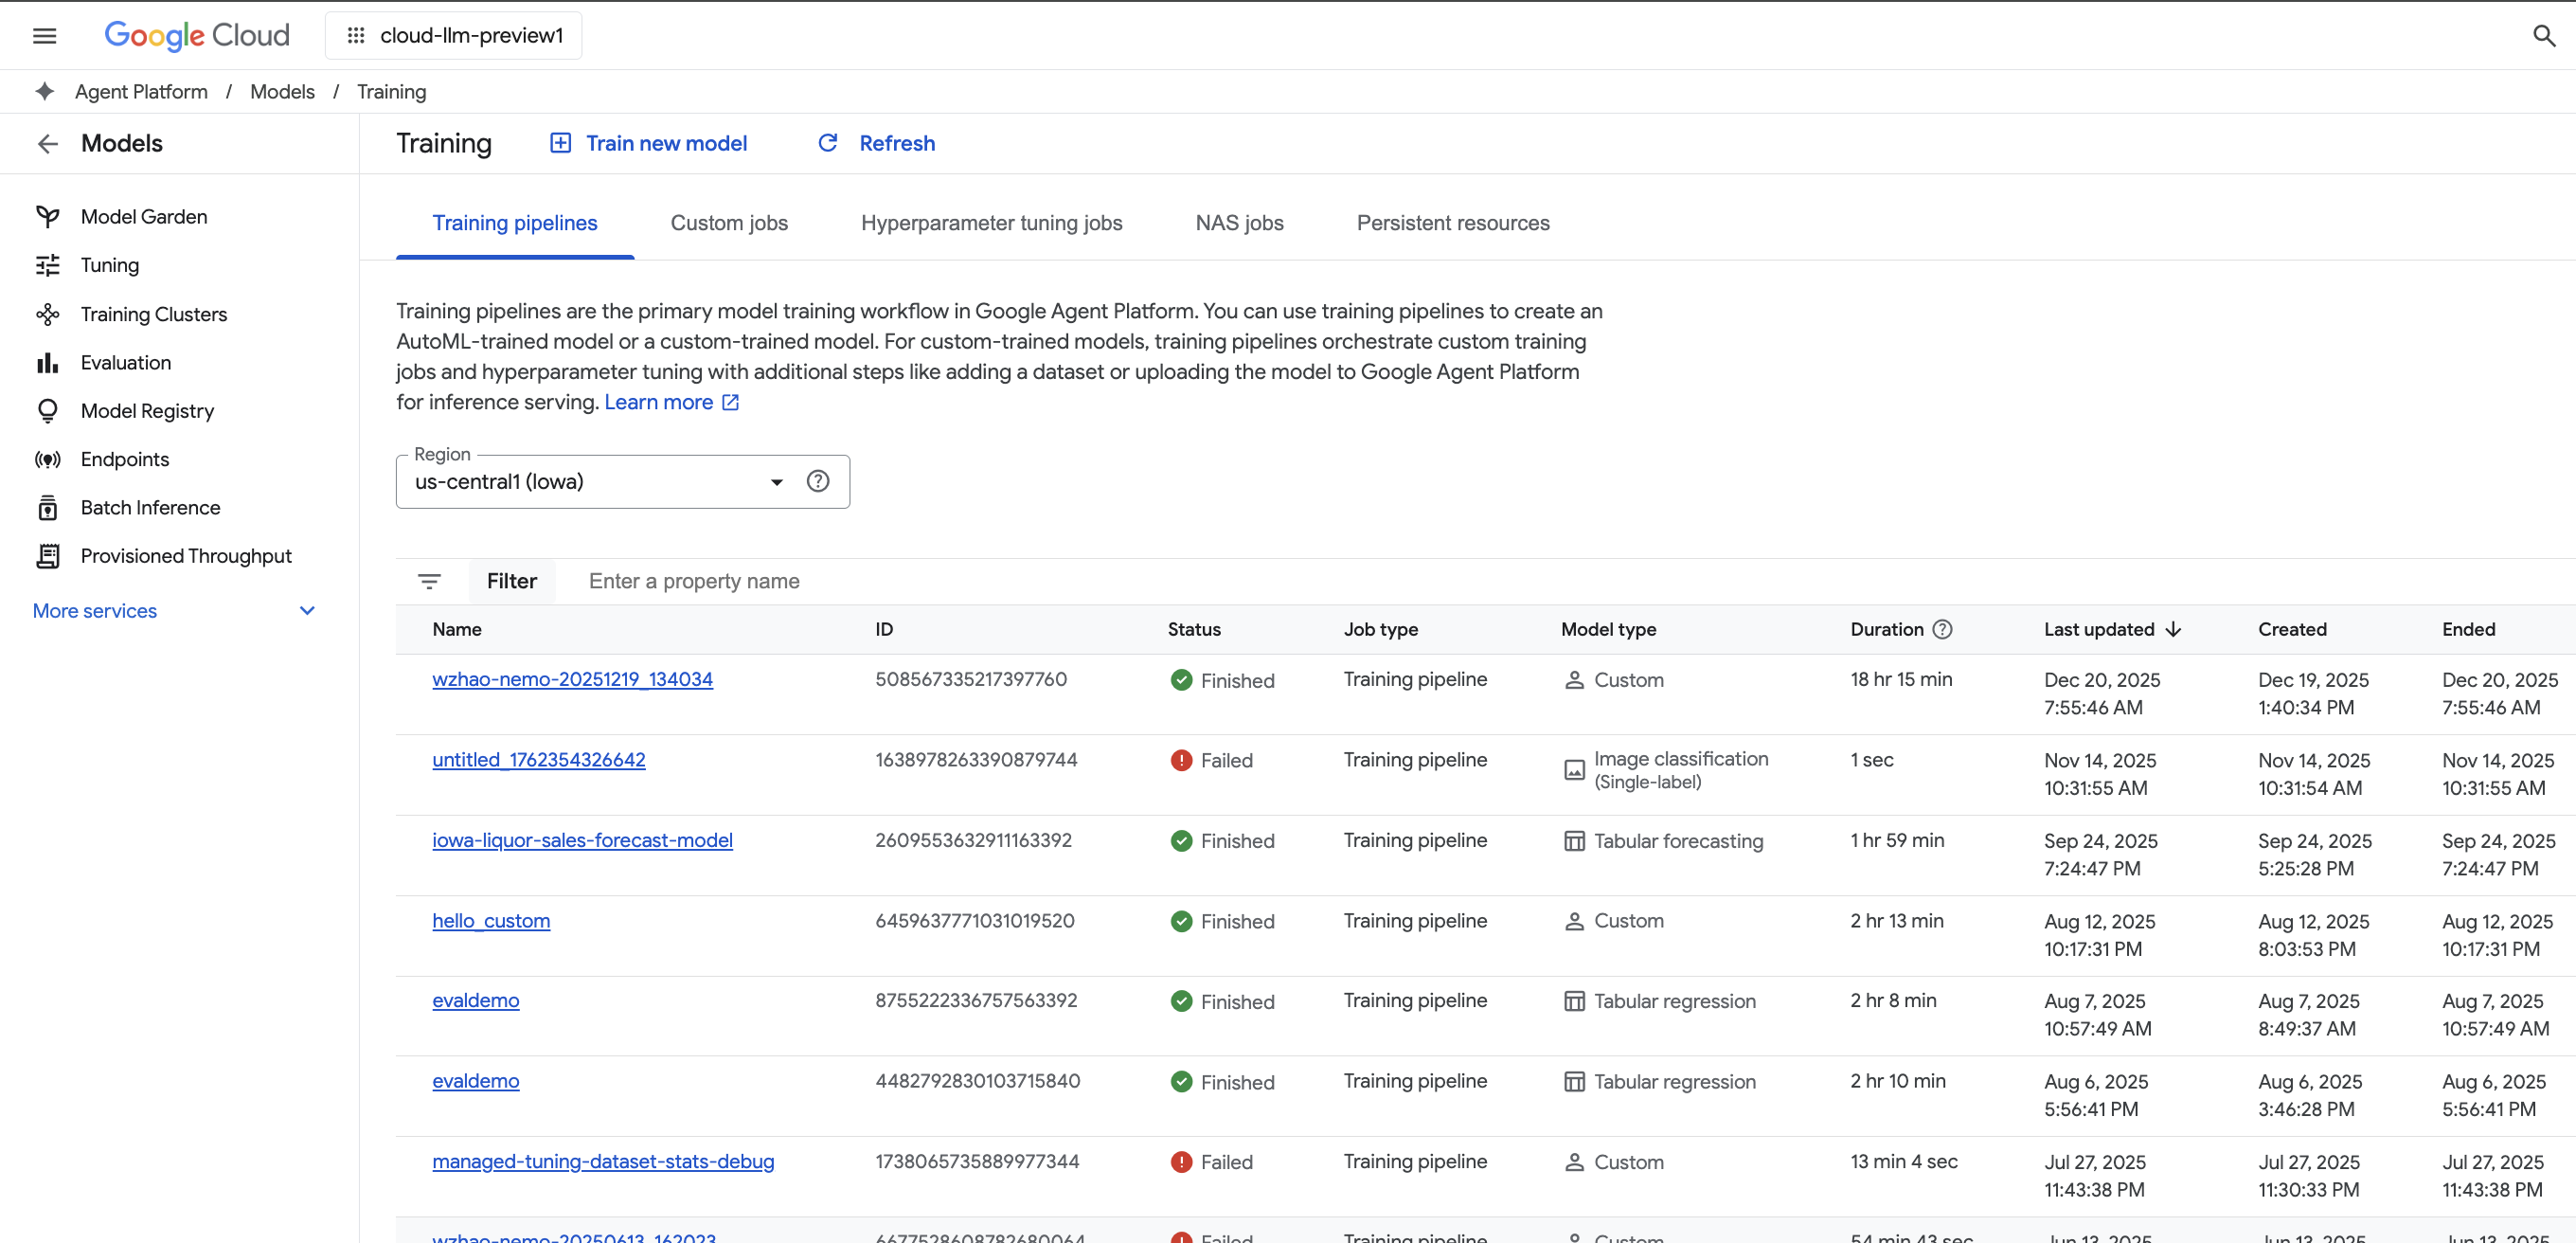
Agent Platform에서 커스텀 모델을 학습시키는 데 필요한 단계에 대한 둘러보기 동영상 보기
튜토리얼, 빠른 시작, 실습
커스텀 모델 학습 개요 및 문서
커스텀 모델 학습 개요 및 문서
Agent Platform의 커스텀 학습 워크플로, 커스텀 학습의 이점, 사용 가능한 다양한 학습 옵션에 대한 개요를 확인하세요. 또한 이 페이지에서는 데이터 준비부터 예측까지 ML 학습 워크플로와 관련된 모든 단계를 자세히 설명합니다.
Agent Platform에서 커스텀 모델을 학습시키는 데 필요한 단계에 대한 둘러보기 동영상 보기
가격 책정
| Agent Platform 가격 책정 방식 | 사용된 Agent Platform 도구, 스토리지, 컴퓨팅, Cloud 리소스에 대해 비용을 지불합니다. 신규 고객에게는 Agent Platform 및 Google Cloud 제품을 사용해 볼 수 있도록 $300의 무료 크레딧이 제공됩니다. | |
|---|---|---|
| 도구 및 사용량 | 설명 | 가격 |
생성형 AI | 이미지 생성을 위한 Imagen 모델 이미지 입력, 문자 입력 또는 커스텀 학습 가격 책정을 기준으로 합니다. | 시작 가격 $0.0001 |
텍스트, 채팅, 코드 생성 입력(프롬프트) 1,000자(영문 기준) 및 출력(응답) 1,000자(영문 기준)를 기준으로 합니다. | 시작 가격 $0.0001 1,000자당(영문 기준) | |
커스텀 학습 모델 | 영업팀에 문의 | |
Agent Platform Notebooks | 컴퓨팅 및 스토리지 리소스 Compute Engine 및 Cloud Storage와 동일한 요금이 적용됩니다. | 제품 참조 |
관리 수수료 위의 리소스 사용량 외에도 사용된 리전, 인스턴스, 노트북, 관리형 노트북을 기준으로 관리 수수료가 적용됩니다. 세부정보 보기 | 세부정보 참조 | |
Agent Platform Pipelines | 실행 및 추가 수수료 실행 요금, 사용된 리소스, 추가 서비스 수수료를 기준으로 합니다. | 시작 가격 $0.03 파이프라인 실행당 |
Agent Platform 벡터 검색 | 서빙 및 빌드 비용 데이터 크기, 실행할 초당 쿼리 수(QPS), 사용하는 노드 수를 기준으로 합니다. 예시 보기 | 예시 참조 |
모든 Agent Platform 기능 및 서비스의 가격 책정 세부정보 보기
Agent Platform 가격 책정 방식
사용된 Agent Platform 도구, 스토리지, 컴퓨팅, Cloud 리소스에 대해 비용을 지불합니다. 신규 고객에게는 Agent Platform 및 Google Cloud 제품을 사용해 볼 수 있도록 $300의 무료 크레딧이 제공됩니다.
텍스트, 채팅, 코드 생성
입력(프롬프트) 1,000자(영문 기준) 및 출력(응답) 1,000자(영문 기준)를 기준으로 합니다.
Starting at
$0.0001
1,000자당(영문 기준)
커스텀 학습 모델
영업팀에 문의
Agent Platform Pipelines
실행 및 추가 수수료
실행 요금, 사용된 리소스, 추가 서비스 수수료를 기준으로 합니다.
Starting at
$0.03
파이프라인 실행당
모든 Agent Platform 기능 및 서비스의 가격 책정 세부정보 보기
비즈니스 사례
생성형 AI의 잠재력 최대 활용

"Google Cloud 생성형 AI 솔루션의 정확성과 Agent Platform의 실용성 덕분에 비즈니스의 중요한 부분에 이 첨단 기술을 구현하고 '즉각 대응'이라는 장기적인 목표를 달성하는 데 필요한 확신을 얻을 수 있었습니다."
압돌 모아베리, GA Telesis CEO


