本页面介绍了如何使用 Cloud Monitoring 查看和绘制有关 Sensitive Data Protection 使用情况的指标数据。
Sensitive Data Protection 会将有关 Sensitive Data Protection 使用情况的详细遥测数据发送到 Monitoring。这有助于监控意外结果、扫描或转换的数据量、作业触发器或作业中的错误以及费用。
在 Monitoring 中查看 Sensitive Data Protection 指标
借助 Cloud Monitoring 中的 Metrics Explorer,您可以查看可用的指标数据,进而深入了解 Sensitive Data Protection 使用情况。Monitoring 支持多种不同的指标,您可将这些指标与过滤器和聚合功能结合使用,从全新角度获得数据洞见。
如需使用 Metrics Explorer 查看受监控资源的指标,请执行以下操作:
-
在 Google Cloud 控制台中,前往 leaderboard Metrics Explorer 页面:
如果您使用搜索栏查找此页面,请选择子标题为监控的结果。
- 在指标元素中,展开选择指标菜单,然后选择资源类型和指标类型。例如,如需绘制虚拟机的 CPU 利用率图表,请执行以下操作:
- (可选)如需减少显示的菜单选项,请在过滤条件栏中输入部分指标名称。在此示例中,请输入
utilization。 - 在活跃资源菜单中,选择虚拟机实例。
- 在活跃指标类别菜单中,选择实例。
- 在活跃指标菜单中,选择 CPU 利用率,然后点击应用。
- (可选)如需减少显示的菜单选项,请在过滤条件栏中输入部分指标名称。在此示例中,请输入
如需过滤显示的时序,请使用过滤条件元素。
如需组合时序,请使用聚合元素上的菜单。例如,如需根据虚拟机所在的可用区显示虚拟机的 CPU 利用率,请将第一个菜单设置为平均值并将第二个菜单设置为可用区。
当聚合元素的第一个菜单设置为未聚合时,系统会显示所有时序。聚合元素的默认设置由您选择的指标类型决定。
如需在 Metrics Explorer 中查看 Sensitive Data Protection 特定指标,请使用 dlp.googleapis.com 进行搜索以优化搜索结果。
要在 Metrics Explorer 中查看 API 指标,请选择已使用的 API 作为资源类型,然后使用过滤器和聚合选项来优化数据。
找到所需指标后,您可以使用 Cloud Monitoring 创建自定义信息中心和提醒,以帮助您继续监控和维护稳健的应用。
绘制指标图表
您可以使用高级聚合来汇总指标,然后绘制图表。使用以下设置:
- 校准器:SUM
- 校准时间段:1440
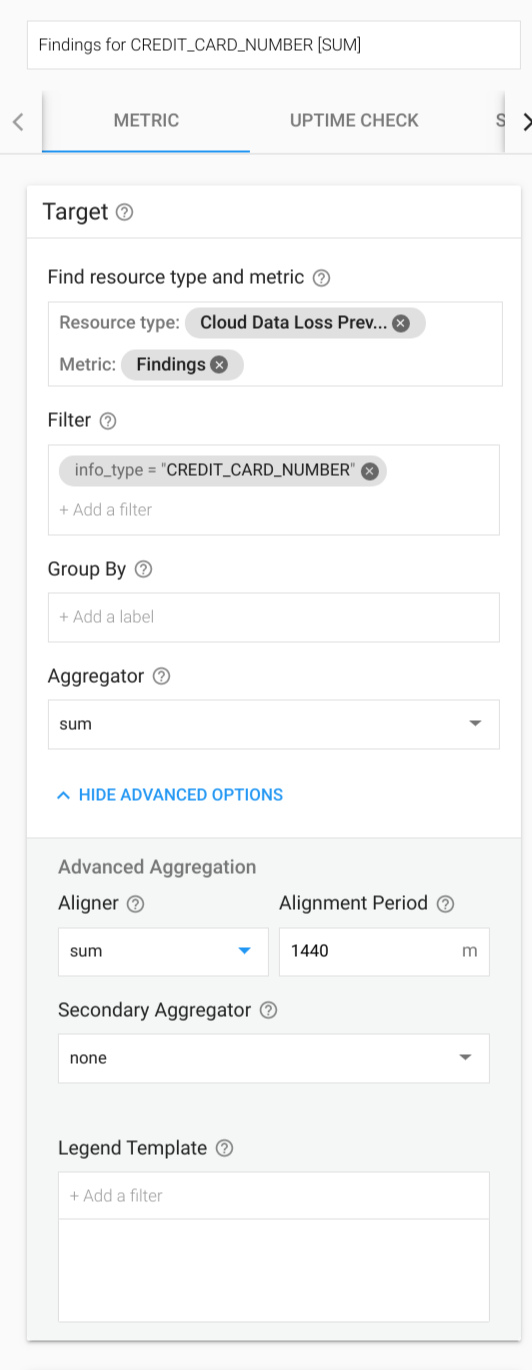
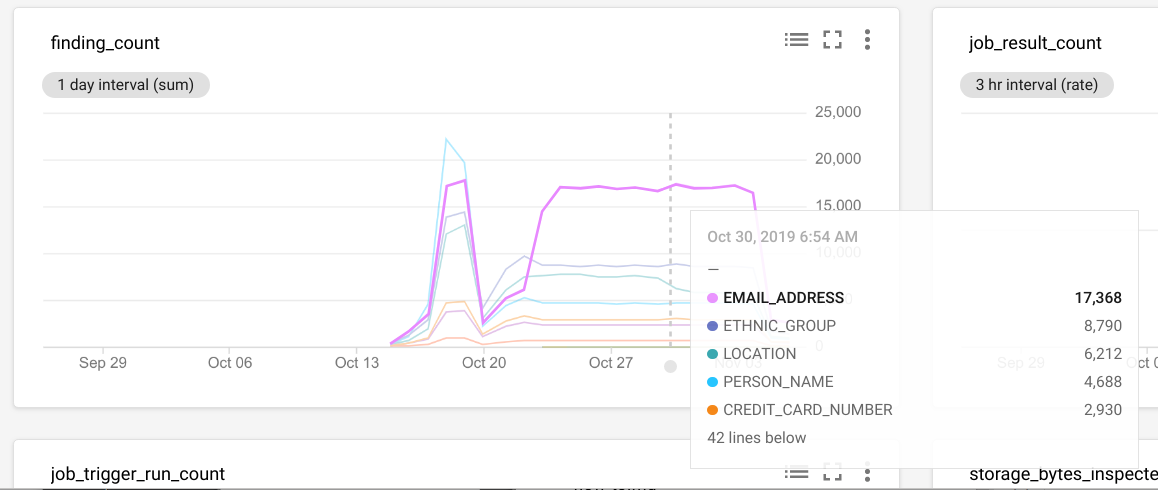
系统会显示一个图表,其中显示了每天的结果。
Cloud Monitoring 支持为所有指标设置提醒。利用 Sensitive Data Protection 指标,您可以针对以下用例发出提醒消息:
- 监控
content_bytes_inspected_count或content_bytes_transformed_count,在支出超过一天预算时发出提醒消息。 - 在特定 infoType 的总结果数或结果数超过阈值时发出提醒消息。例如,如果给定项目不应存在 PII,但
CREDIT_CARD_NUMBER结果超过 0,您可以对此设置提醒。
可用指标
以下指标类型名称的前缀必须为 dlp.googleapis.com/。表中的条目已省略该前缀。
| 指标类型 显示名 |
|
|---|---|
| 种类、类型、单位 发布阶段 |
说明 标签 |
finding_count结果数量 |
|
DELTA、INT64、By
|
每秒的结果数量。仅针对包含操作 PublishToStackdriver 的作业进行填充。
|
content_bytes_inspected_count检查的内容字节数 |
|
DELTA、INT64、By
|
内容方法中每秒检查的字节数。 |
content_bytes_transformed_count转换的内容字节数 |
|
DELTA、INT64、By
|
内容方法中每秒转换的字节数。 |
storage_bytes_inspected_count检查的存储空间字节数 |
|
DELTA、INT64、By
|
Sensitive Data Protection 作业中检查的字节数。 |
storage_bytes_transformed_count转换的存储空间字节数 |
|
DELTA、INT64、By
|
Sensitive Data Protection 作业中转换的字节数。 |
job_result_count作业结果 |
|
DELTA、INT64、1
|
敏感数据保护作业的结果。如果作业成功,则为 true,否则为 false。 |
job_trigger_run_count作业触发器运行次数 |
|
DELTA、INT64、1
|
作业触发器运行的结果。 |