Flow Analyzer 會分析以記錄格式儲存的 VPC 流程記錄檔資料。記錄包含做為每個記錄核心欄位的幾個基礎欄位,以及用來提供更多資訊的中繼資料欄位。用於監控流量流量的記錄記錄包含三個主要元件:
- 資源資訊
- 指標類型
- 時間序列
資源資訊
記錄檔包含下列資源資料:
指標類型
記錄檔包含下列指標類型的資料:
- 傳送的位元組:包含酬載量大小的資訊,但不包含標頭。由於某些封包只包含標頭,不含任何酬載,因此這項指標值可能為零。
- 已傳送的封包:表示從來源傳送至目的地的封包數。
原始時間序列資料
單一時間序列的原始指標資料量可能非常龐大,而且通常會有許多時間序列與指標類型相關聯。如要分析整組資料的共通點、趨勢或異常值,就必須對組合中的時間序列進行一些處理。否則,系統需要考量的資料太多。
為了介紹本頁範例的取樣和匯總作業,我們會使用少量假設時間序列。舉例來說,下圖顯示幾分鐘的每秒位元組數指標類型原始資料:
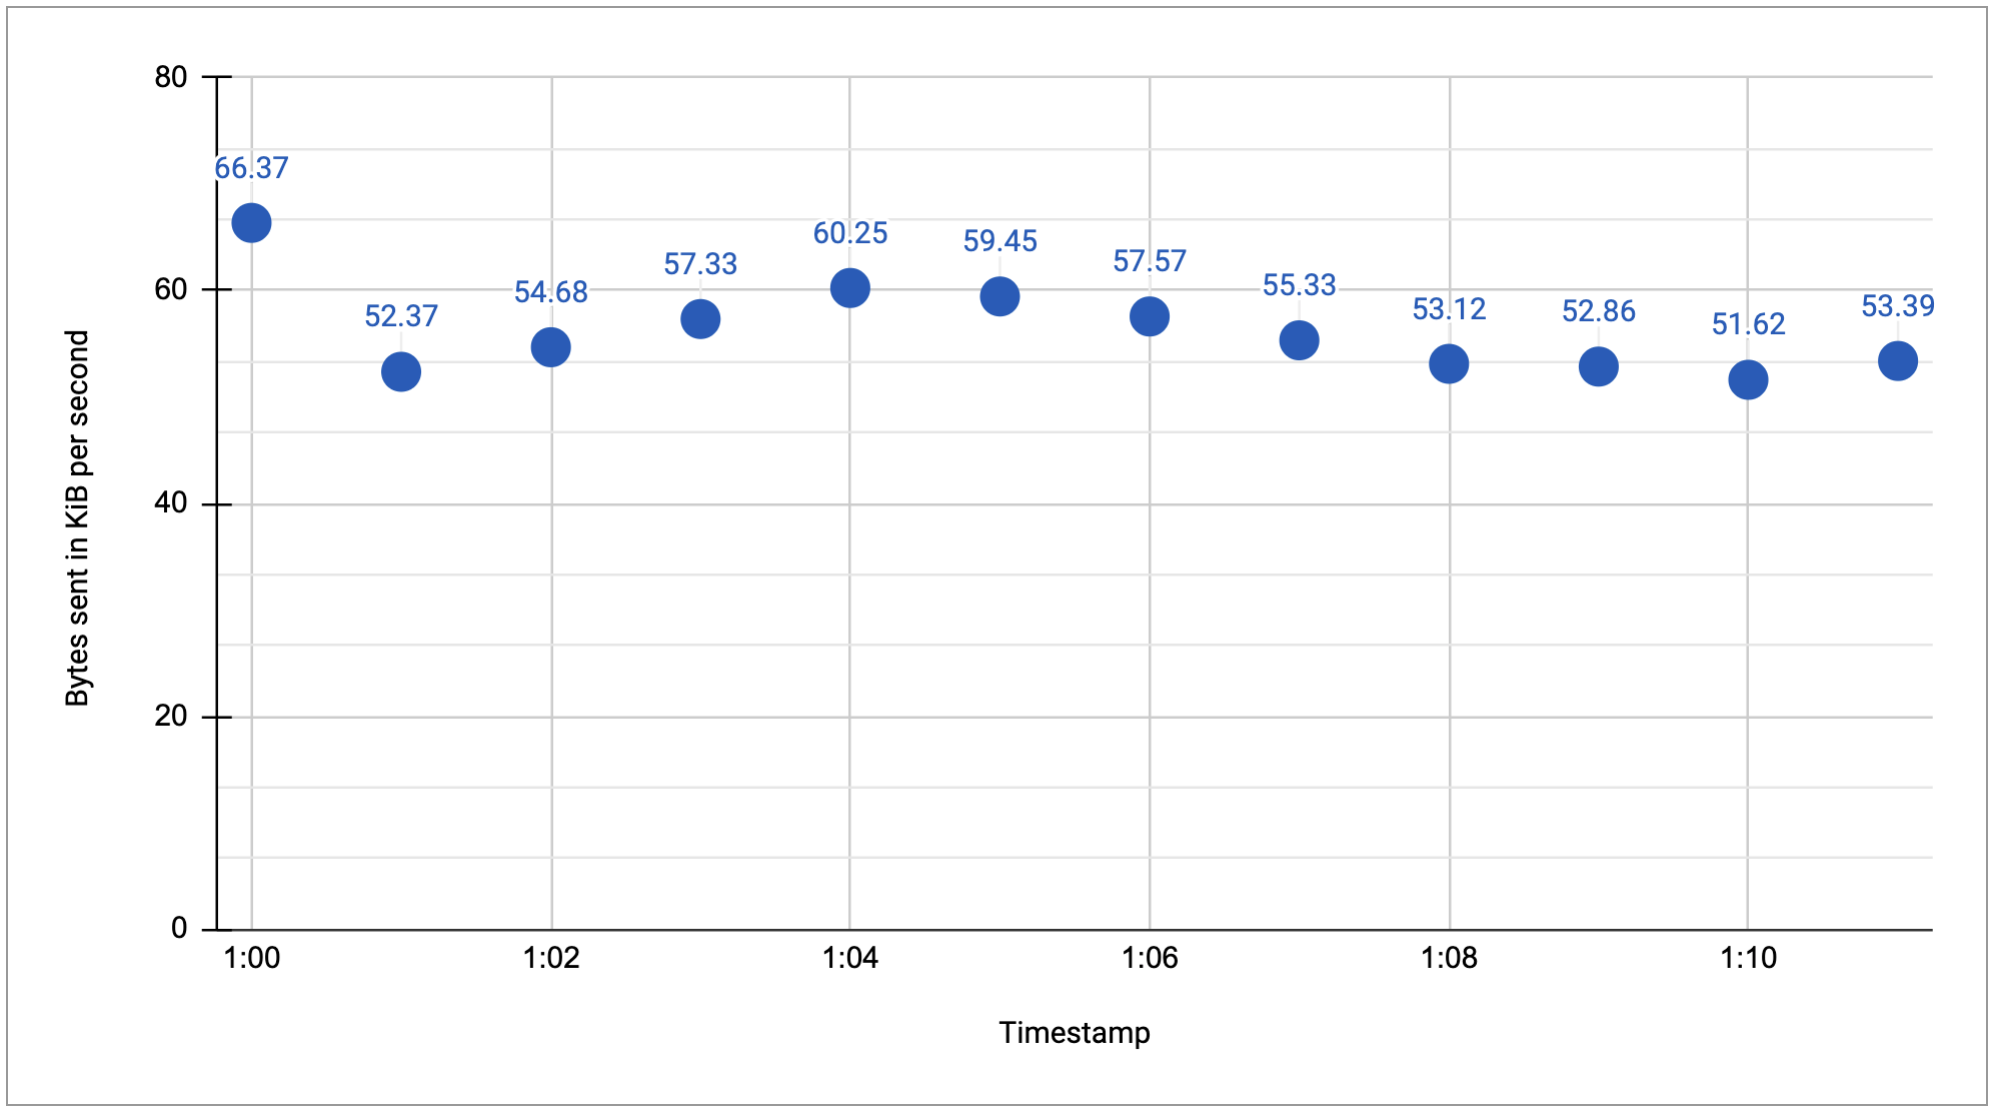
原始時間序列資料必須經過處理才能進行分析,而分析通常會涉及取樣資料並匯總部分資料。本頁面將說明兩種主要的粗糙資料精修技巧:
- 取樣:移除部分資料。Google Cloud 會執行取樣,並使用記錄記錄中的必要資料,執行查詢中指定的作業。
- 匯總:將多個資料合併成較小的資料集,並依您指定的維度進行合併。
取樣和匯總是強大的工具,可協助您找出有趣的模式,並突顯資料中的趨勢或異常值等。
瞭解校正週期
彙整時間序列資料的第一步是對齊。對齊會建立新的時間序列,其中原始資料會按時間規則化,以便與其他對齊的時間序列結合。對齊功能會產生時間序列,其中的資料間隔固定。
對齊作業包含兩個步驟:
- 將時間序列劃分為固定時間間隔,也稱為資料分桶。這段時間稱為校正期間。
- 為校正週期內的資料點計算單一指標值。您可以選擇單一點的計算方式,例如加總所有值、計算平均值或使用最大值。
下圖說明如何使用對齊期間,將起始時間和結束時間內的資料分割成值區。
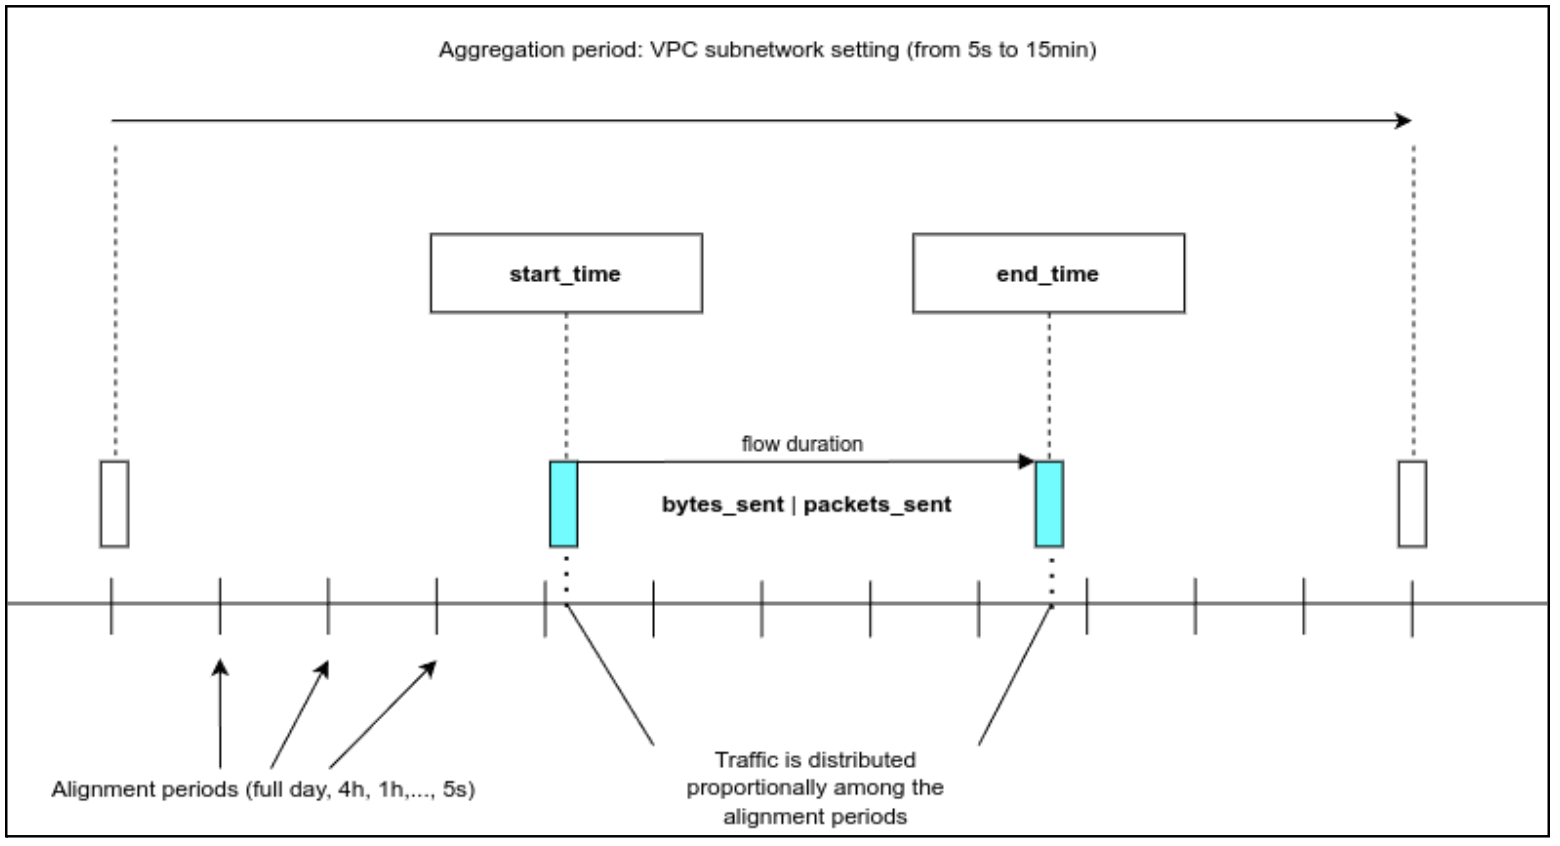
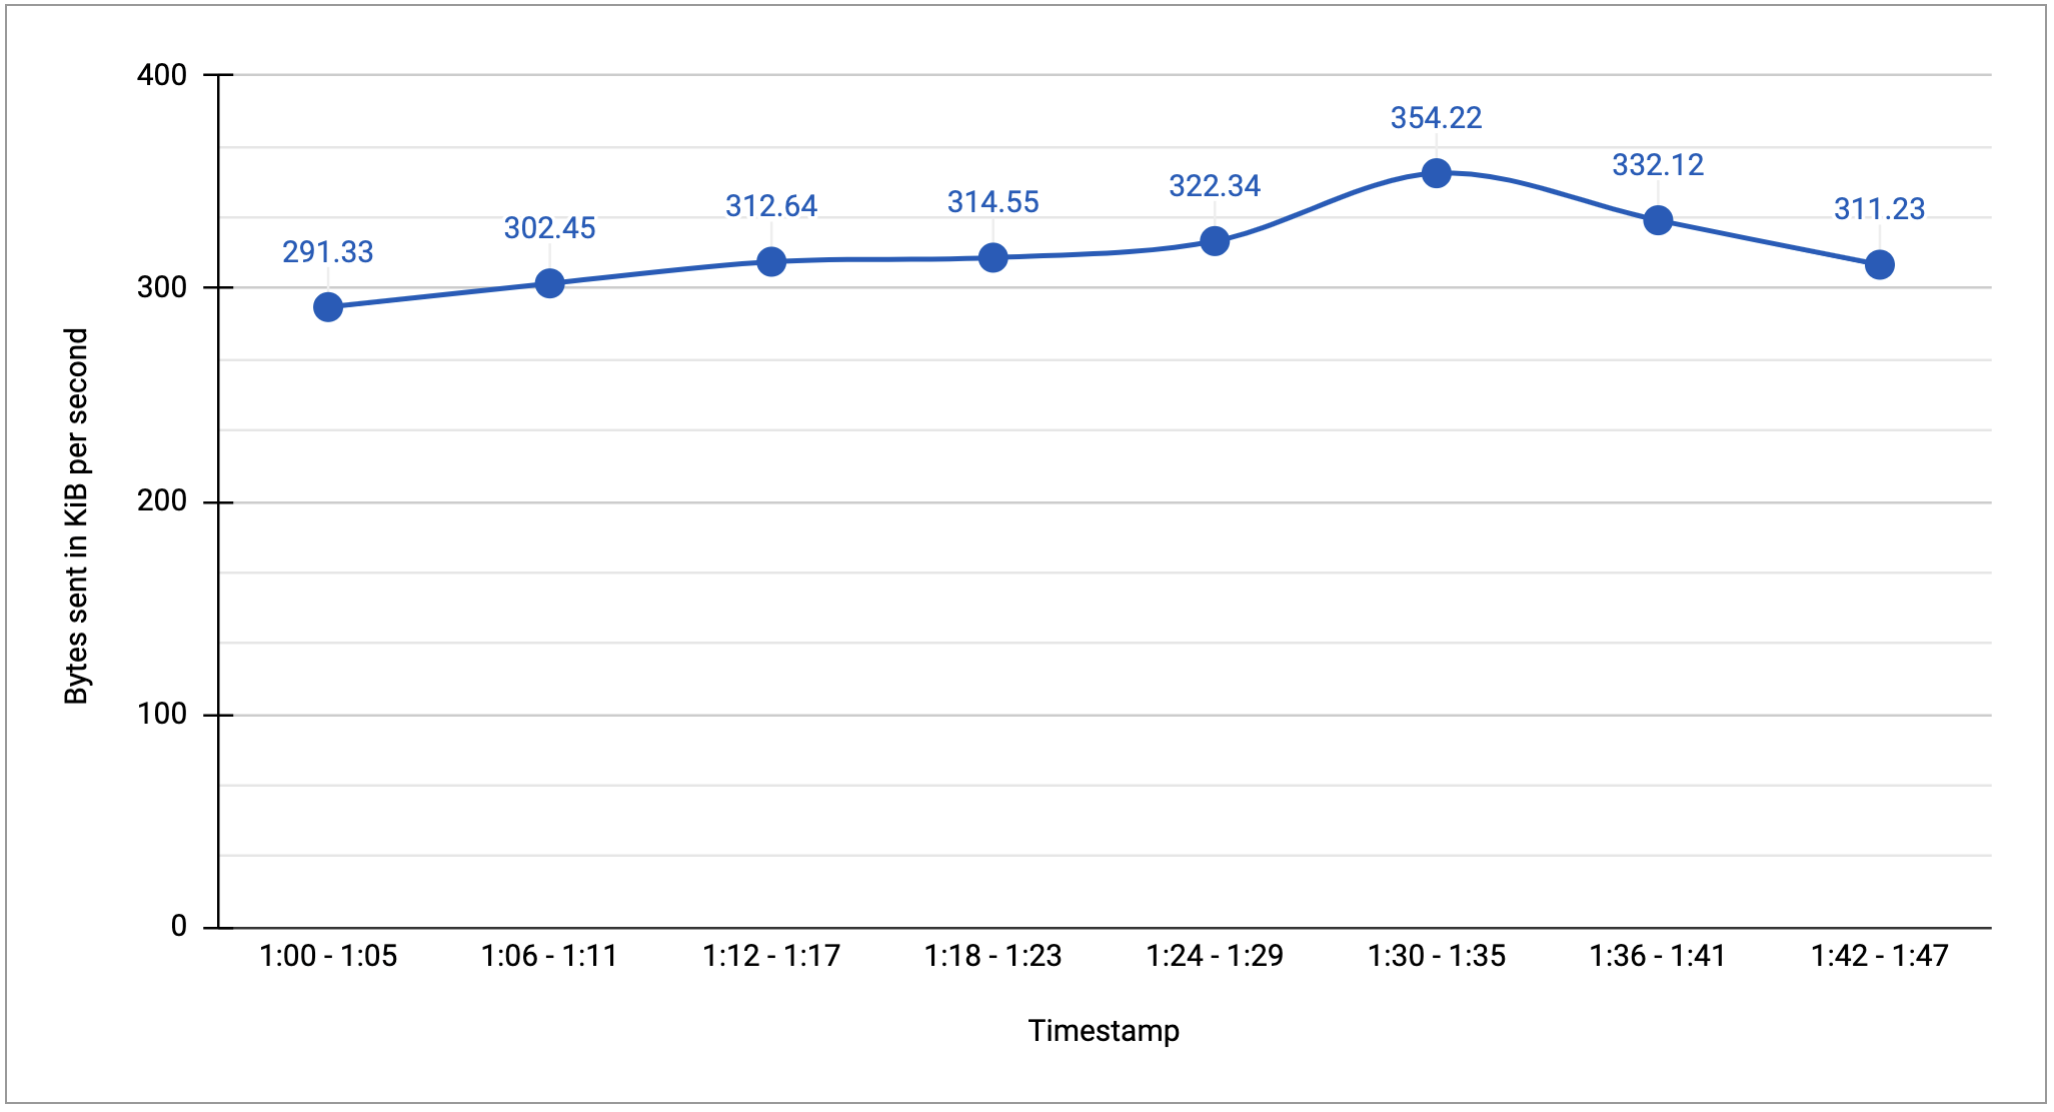
下圖顯示使用五分鐘對齊期間的結果,並執行以下步驟:
- 建立五分鐘時間間隔的對齊期間。
- 使用原始資料中指標值的總和來計算單一指標值。
精細程度
如果您知道在幾分鐘內發生了某些事件,且想進一步瞭解,建議您使用一分鐘的時間做為對齊時間。
如果您想瞭解較長時間範圍內的趨勢,建議使用較長的對齊期間。大對齊期間通常不適合用於查看短期異常情況,例如流量短暫激增。舉例來說,如果您使用多週的校正週期,系統仍可偵測該週期內是否有異常狀況,但校正後的資料可能太過概略,無法提供太多幫助。
對於較長的時間長度,較短的對齊時間並無幫助。舉例來說,如果您選取 30 天期間的 1 分鐘對齊,Flow Analyzer 會產生超過 43,000 個資料點。由於 43,000 個資料點是 4K 螢幕像素的 10 倍,因此您無法查看所有詳細資料,且部分選項會在長時間期間停用。
對齊選項
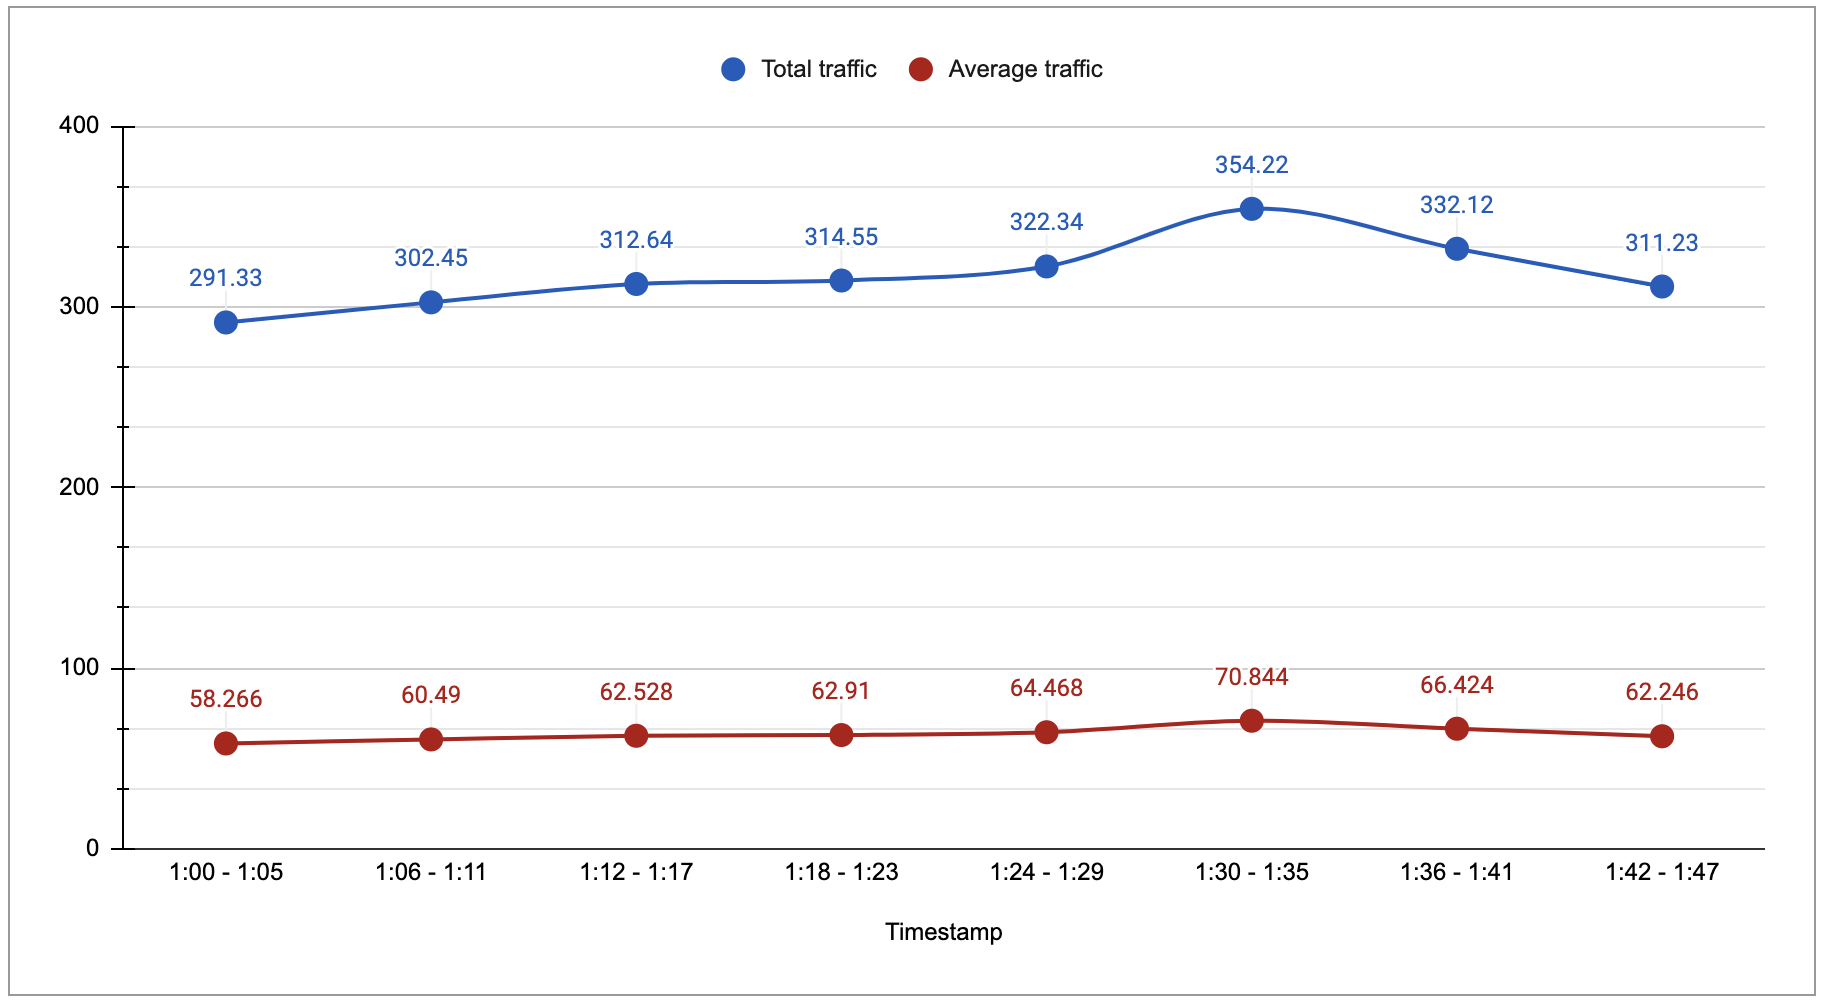
對齊選項包括加總值、找出值的最大值、最小值或平均值、找出所選百分位數值、計算值等。您可以使用 Flow Analyzer 將各種指標匯總資料做為對齊選項。
如果您選取「傳送的位元組數」做為指標類型,並選取「來源和目的地」做為流量匯總,則可使用下列選項。
- 總流量
- 平均流量傳輸速率
- 流量傳輸速率中位數
- 第 95 個百分位數的流量傳輸速率
- 流量傳輸速率上限
如果您選取「封包傳送量」做為指標類型,並選取「來源和目的地」做為流量匯總,則可使用下列選項。
- 匯總封包數
- 平均封包傳送速率
- 封包傳送速率中位數
- 第 95 個百分位數的封包傳輸速率
- 封包傳送速率上限
下圖顯示使用兩個對齊選項 (總流量和平均流量率) 的結果。
使用校正週期
您可以使用「對齊期間」選項,將流量匯入所選時間長度的時間間隔。您可以進一步放大圖表,並視需要查看具體詳細資料。