本文適用於執行 Google Distributed Cloud 的應用程式擁有者。本文說明如何查看使用 GDC 虛擬機器執行階段的虛擬機器 (VM) 控制台記錄。您可以使用 VM 控制台記錄檔,排解及診斷叢集內的問題。
事前準備
如要完成這份文件,您必須存取下列資源:
- 在其中一個叢集中執行的 VM。如有需要,請在 Google Distributed Cloud 中建立 VM。
virtctl用戶端工具已安裝為kubectl的外掛程式。視需要安裝 virtctl 用戶端工具。
連線至 VM
如要確保有記錄可供查看,請連線至 VM 並產生一些記錄活動。
如要從控制台存取 VM,請使用
kubectl:kubectl virt console VM_NAME將
VM_NAME替換為要連線的 VM 名稱。系統顯示提示時,請輸入建立 VM 時指定的使用者憑證。
執行指令來檢查更新,例如 Debian 型 VM 的
apt-get或 Red Hat 型 VM 的yum check-update。以 Debian 為基礎的
apt-get update以 Red Hat 為基礎的
yum check-update成功產生一些控制台記錄活動後,請結束 VM 工作階段和控制台:
Ctrl + ]
查看 VM 控制台記錄
您可以在 Google Cloud 控制台中查看 VM 控制台記錄。VM 序列埠控制台記錄會串流至 Cloud Logging,並可在記錄檔探索工具中查看。使用 VM Runtime on GDC 執行的 VM 在控制台記錄中會歸類為容器。
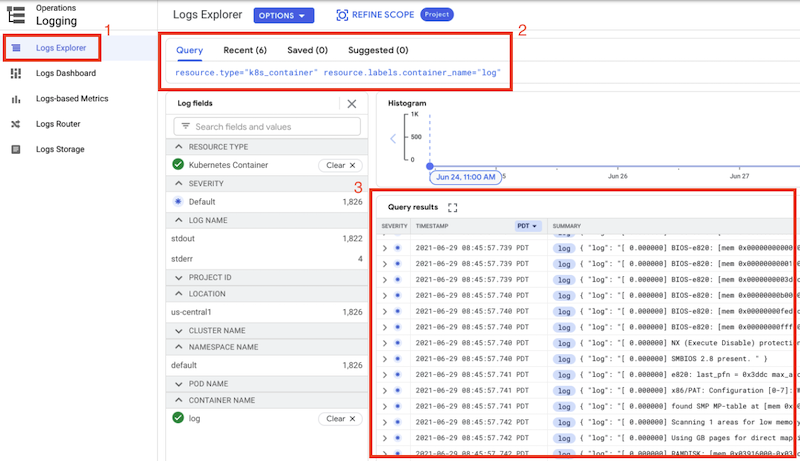
前往 Google Cloud 控制台的「Logging」選單,然後點選「Logs Explorer」頁面。
在「Query」(查詢) 欄位中,輸入下列基本查詢:
resource.type="k8s_container" resource.labels.container_name="log"「查詢結果」視窗會顯示 VM 的控制台記錄輸出內容,如下列範例螢幕截圖所示:
如要進一步將查詢結果篩選至特定 VM,請在查詢中加入叢集名稱和 VM 名稱:
resource.type="k8s_container"
resource.labels.container_name="log"
resource.labels.cluster_name="CLUSTER_NAME"
labels.k8s-pod/kubevirt/vm="VM_NAME"
更改下列內容:
CLUSTER_NAME:包含 VM 的叢集名稱。VM_NAME:VM 名稱。
後續步驟
- 如要進一步瞭解如何篩選控制台記錄,請參閱「在記錄檔探索工具中建構查詢」。