This page describes how to use Cloud Monitoring to view and graph metrics data about your Sensitive Data Protection usage.
Sensitive Data Protection sends detailed telemetry about your Sensitive Data Protection usage to Monitoring. This can be useful to monitor for unexpected findings, amount of data scanned or transformed, errors in job triggers or jobs, and expenses.
View Sensitive Data Protection metrics in Monitoring
Using Metrics Explorer in Cloud Monitoring, you can dig into available metrics data to give you insight into your Sensitive Data Protection usage. Monitoring supports a wide variety of metrics, which you can combine with filters and aggregations for new and insightful views.
To view the metrics for a monitored resource by using the Metrics Explorer, do the following:
-
In the Google Cloud console, go to the leaderboard Metrics explorer page:
If you use the search bar to find this page, then select the result whose subheading is Monitoring.
- In the Metric element, expand the Select a metric menu, and then
select a resource type and metric type. For example, to chart the CPU utilization of a
virtual machine, do the following:
- (Optional) To reduce the menu's options, enter part of the metric name in the
Filter bar. For this example, enter
utilization. - In the Active resources menu, select VM instance.
- In the Active metric categories menu, select Instance.
- In the Active metrics menu, select CPU utilization and then click Apply.
- (Optional) To reduce the menu's options, enter part of the metric name in the
Filter bar. For this example, enter
To filter which time series are displayed, use the Filter element.
To combine time series, use the menus on the Aggregation element. For example, to display the CPU utilization for your VMs, based on their zone, set the first menu to Mean and the second menu to zone.
All time series are displayed when the first menu of the Aggregation element is set to Unaggregated. The default settings for the Aggregation element are determined by the metric type you selected.
To see Sensitive Data Protection-specific metrics in Metrics Explorer, search with
dlp.googleapis.com to refine your search results.
To see API metrics in Metrics Explorer, select Consumed API as the resource type, and then use the filter and aggregation options to refine your data.
After you've found the metrics you want, you can use Monitoring to create custom dashboards and alerts that will help you continue to monitor and maintain a robust application.
Graph the metrics
You can graph metrics by aggregating them using Advanced Aggregation. Use the following settings:
- Aligner: SUM
- Alignment Period: 1440
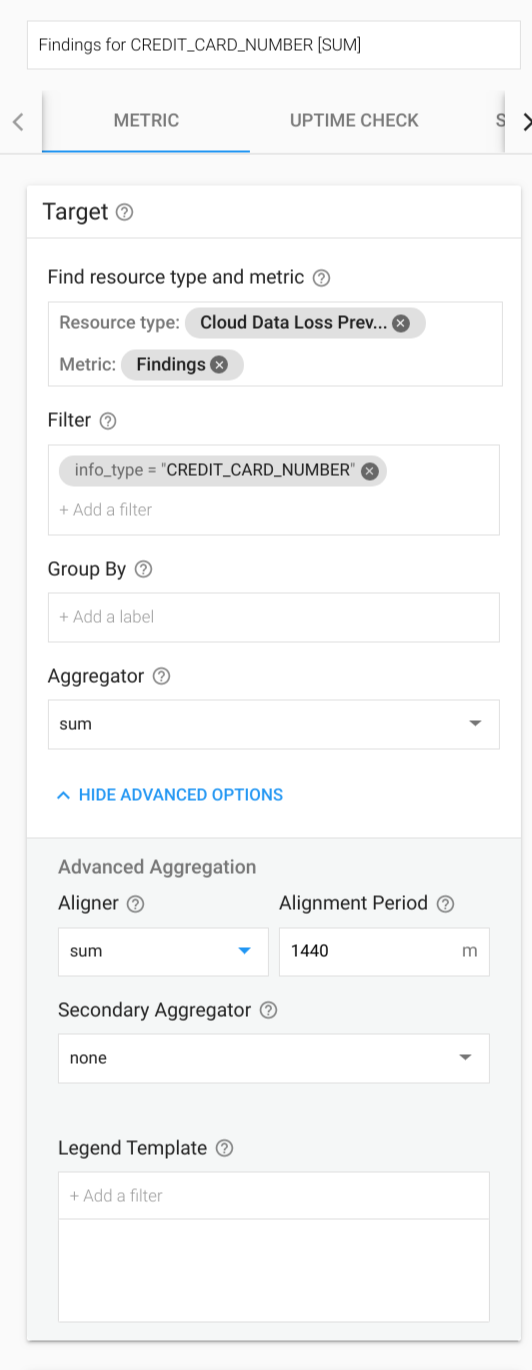
You get a chart showing the results per day.
Cloud Monitoring supports alerting on all metrics. Using the Sensitive Data Protection metrics, you can alert on use cases that include:
- Monitor
content_bytes_inspected_countorcontent_bytes_transformed_countto alert when spend has exceeded budget for a day. - Alert when the number of total findings or findings for a specific
infoType exceed a threshold. For example, you can build an alert if
CREDIT_CARD_NUMBERfindings exceed 0 in a given project where no PII should exist.
Available metrics
The following metric type names must be prefixed with
dlp.googleapis.com/. That prefix has been omitted from the entries in the
table.
| Metric type Display name |
|
|---|---|
| Kind, Type, Unit Launch stage |
Description Labels |
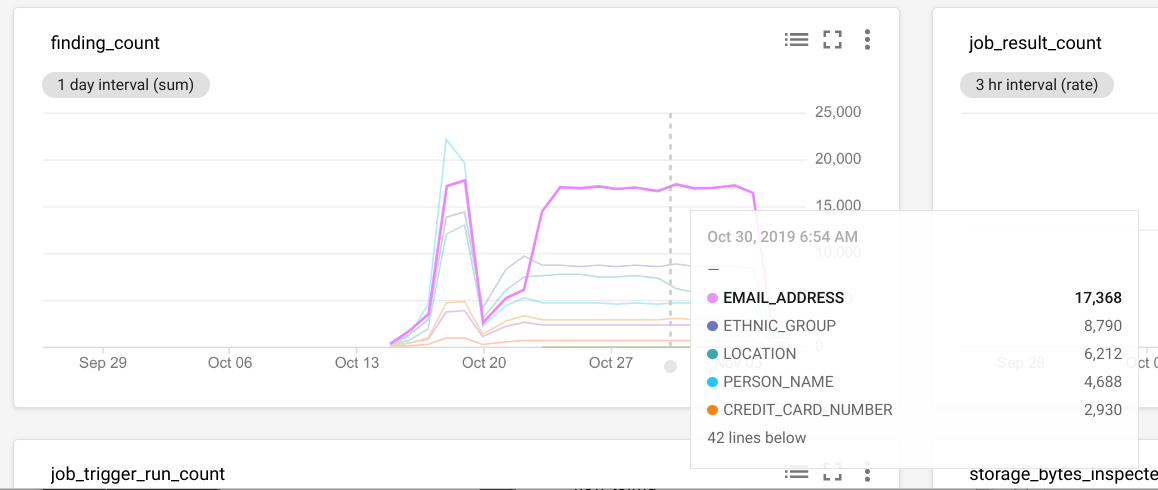
finding_countNumber of findings |
|
DELTA, INT64, By
|
Number of findings per second. Only populated for jobs where the
action PublishToStackdriver is included.
|
content_bytes_inspected_countContent bytes inspected |
|
DELTA, INT64, By
|
Number of bytes inspected in content methods per second. |
content_bytes_transformed_countContent bytes transformed |
|
DELTA, INT64, By
|
Number of bytes transformed in content methods per second. |
storage_bytes_inspected_countStorage bytes inspected |
|
DELTA, INT64, By
|
Number of bytes inspected in Sensitive Data Protection jobs. |
storage_bytes_transformed_countStorage bytes transformed |
|
DELTA, INT64, By
|
Number of bytes transformed in Sensitive Data Protection jobs. |
job_result_countJob results |
|
DELTA, INT64, 1
|
Results of Sensitive Data Protection jobs. True if the job was success and false otherwise. |
job_trigger_run_countJob trigger runs |
|
DELTA, INT64, 1
|
Results of job trigger runs. |