Database Migration Service は、データ移行プロセスの健全性と進行状況を表す移行ジョブ指標を収集して表示します。このページでは、移行ジョブの指標に関連する次の領域について説明します。
移行ジョブの詳細ページで使用可能な指標では、Database Migration Service の移行ジョブの詳細ページで直接確認できるオブザーバビリティ情報を説明します。
Cloud Monitoring で利用可能な指標では、Cloud SQL for SQL Server の移行先インスタンスから表示される指標など、移行ジョブのパフォーマンスに関連するすべての指標について説明します。
移行ジョブの詳細ページで利用できる指標
移行ジョブの詳細ページには、移行ジョブの現在の状態と進行状況を把握するのに役立ついくつかの図が表示されます。移行ジョブに含まれるデータベースごとに、これらの図の情報にフィルタを適用できます。
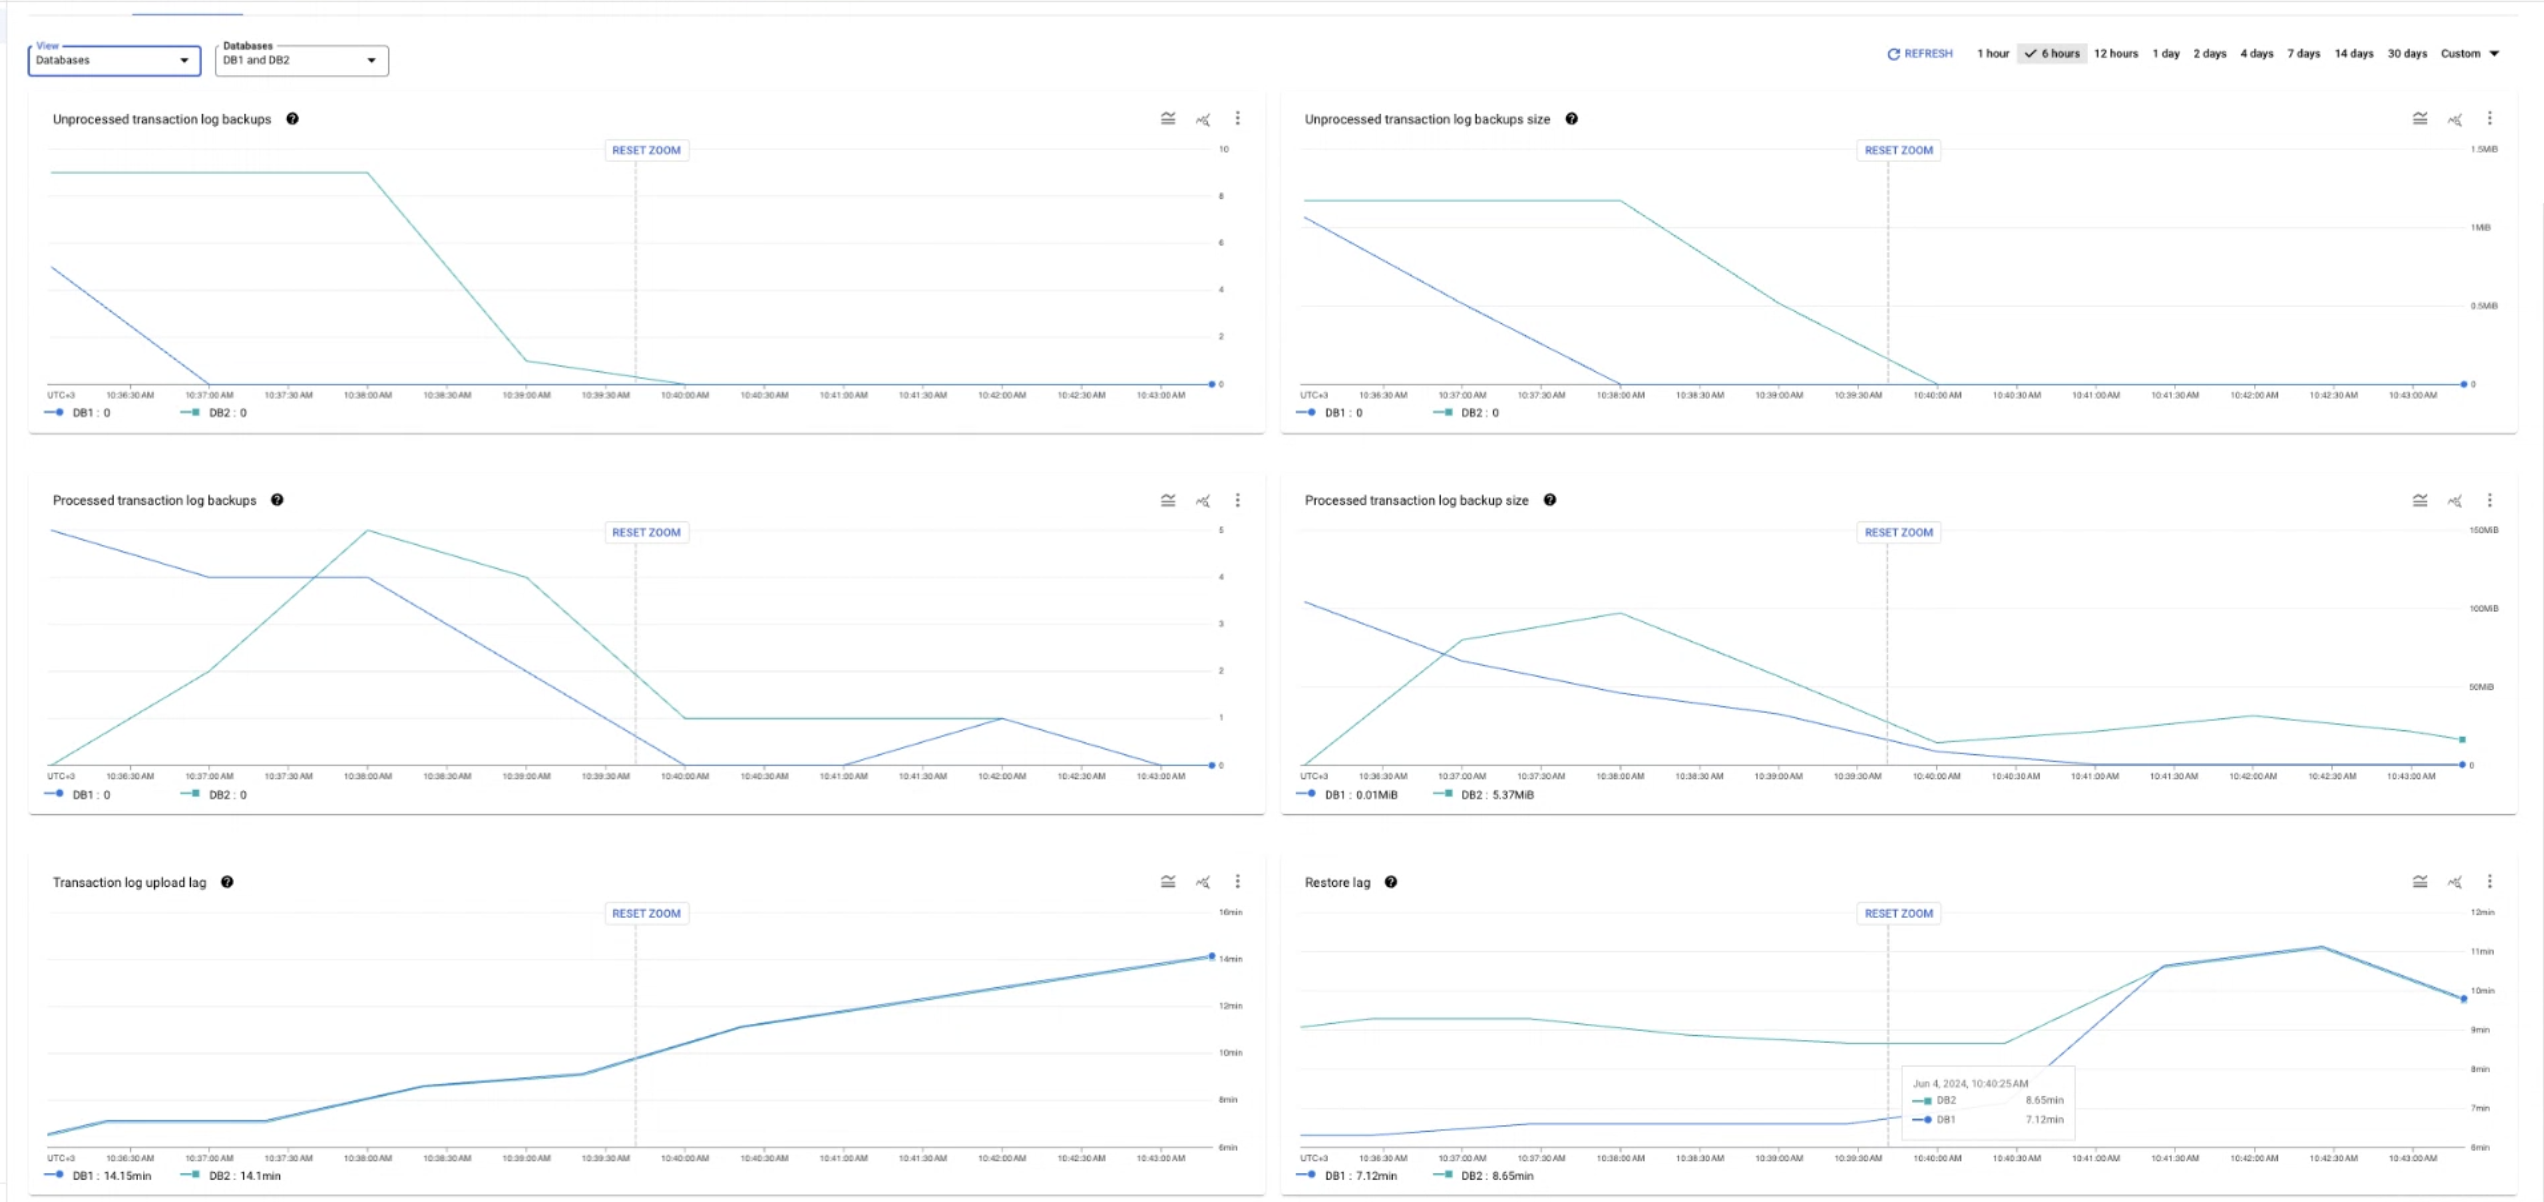
各図とそれに関連する指標について詳しくは、以下のセクションを開いてご確認ください。
復元ラグ
[復元ラグ] ダイアグラムでは、
migration_job/max_replica_sec_lag 指標を使用して、バックアップ ファイルのエポック(ファイル名から取得)と、そのファイルが Cloud SQL の移行先インスタンスで完全に復元された時点との時差を表します。この指標は、移行ジョブに使用するすべてのタイプのバックアップ ファイルとトランザクション ログ ファイル(完全バックアップ、差分バックアップ、トランザクション ログ ファイル)をモニタリングします。この情報を使用して、平均データ レプリケーション速度を推定したり、継続的データ レプリケーションに関する潜在的な問題のトラブルシューティングを行ったりできます。
この指標は、移行ジョブに含まれる各データベースで使用できます。また、移行ジョブに含まれるすべてのデータベースの復元ラグが表示される集計ビューでも使用できます。
トランザクション ログ バックアップのアップロードのラグ
[トランザクション ログ バックアップのアップロード ラグ] ダイアグラムでは、
migration_job/sqlserver/transaction_log_upload_sec_lag 指標を使用して、現在から Cloud Storage にアップロードした最後のトランザクション ログ ファイルのタイムスタンプまでの経過時間(秒単位)が表示されます。この指標を使用すると、トランザクション ログファイルの自動アップロードに関する潜在的な問題をモニタリングできます。時間差が大きい場合は、トランザクション ログファイルが Cloud Storage バケットにアップロードされていないことを示している可能性があります。
この指標は、移行ジョブに含まれる各データベースで使用できます。また、移行ジョブに含まれるすべてのデータベースで最も遅延が大きいデータベースを示す集計ビューでも使用できます。
処理済みのトランザクション ログ バックアップ
[処理されたトランザクション ログ バックアップ] ダイアグラムでは、
migration_job/sqlserver/processed_file_count 指標を使用して、Database Migration Service が処理して Cloud SQL にインポートしたトランザクション ログ バックアップ ファイルの数を表します。この情報はトランザクション ログが完全に処理された後に更新されるため、図に表示される線は、徐々に減少するのではなく、大きくジャンプして移動します。
この指標をモニタリングして、増分読み込みフェーズの進行状況を追跡できます。値が 0 より大きい場合、移行ジョブは初期読み込みフェーズを完了し、増分読み込みフェーズに移行しています。
この指標は、移行ジョブに含まれる各データベースで使用できます。また、集計ビューでは、移行ジョブに含まれるすべてのデータベースの概要が表示されます。
処理済みのトランザクション ログ バックアップのサイズ
[処理されたトランザクション ログ バックアップのサイズ] ダイアグラムでは、
migration_job/sqlserver/processed_file_bytes_count 指標を使用して、Database Migration Service が Cloud SQL の移行先インスタンスにレプリケートしたトランザクション ログ データの量(バイト単位)を示します。この情報はトランザクション ログが完全に処理された後に更新されるため、図に表示される線は、徐々に減少するのではなく、大きくジャンプして移動します。
この指標は、移行ジョブに含まれる各データベースで使用できます。また、集計ビューでは、移行ジョブに含まれるすべてのデータベースの概要が表示されます。
未処理のトランザクション ログ バックアップ
[未処理のトランザクション ログ バックアップ] ダイアグラムでは、
migration_job/sqlserver/unprocessed_files 指標を使用して、Database Migration Service が移行元の Cloud Storage バケットで検出したが、まだ Cloud SQL の移行先インスタンスに複製されていないトランザクション ログ バックアップ ファイルの数を表します。この情報はトランザクション ログが完全に処理された後に更新されるため、図に表示される線は、徐々に減少するのではなく、大きくジャンプして移動します。
この指標は、移行ジョブを確定させるタイミングを判断する際に確認できます。 移行ジョブを昇格するタイミングとしては、[未処理のトランザクション ログ バックアップ] の値がゼロになり、Cloud Storage にアップロードするトランザクション ログ ファイルがなくなったときが適しています。
この指標は、移行ジョブに含まれる各データベースで使用できます。また、集計ビューでは、移行ジョブに含まれるすべてのデータベースの概要が表示されます。
未処理のトランザクション ログ バックアップのサイズ
[未処理のトランザクション ログ バックアップのサイズ] ダイアグラムでは、
migration_job/sqlserver/unprocessed_file_bytes 指標を使用して、Database Migration Service が移行元の Cloud Storage バケットで検出したが、まだ Cloud SQL の移行先インスタンスに複製されていないデータの量(バイト単位)を示します。この情報はトランザクション ログが完全に処理された後に更新されるため、図に表示される線は、徐々に減少するのではなく、大きなジャンプで移動します。
この指標は、移行ジョブを確定させるタイミングを判断する際に確認できます。 移行ジョブを昇格するタイミングとしては、未処理のトランザクション ログ バックアップのサイズの値がゼロになり、Cloud Storage にアップロードするトランザクション ログ ファイルがなくなったときが適しています。
この指標は、移行ジョブに含まれる各データベースで使用できます。また、集計ビューでは、移行ジョブに含まれるすべてのデータベースの概要が表示されます。
移行先ストレージの総使用量
[移行先のストレージの合計使用量] 図は、Cloud SQL の
database/disk/bytes_used 指標を使用して、移行先の Cloud SQL インスタンス内のすべてのデータベースに保存されているデータの量(バイト単位)を示します。この情報を使用して、移行ジョブの進行状況を見積もることができます。
この指標は、集計ビューでのみ使用できます。データベースごとのディスク使用量の合計をフィルタリングすることはできません。
レプリケーションの遅延
[レプリケーション遅延] 図は、Cloud SQL の
per_database/postgresql/external_sync/replication_byte_lag 指標を使用して、ソースでオペレーションが実行されたときと宛先インスタンスに適用されたときの差(バイト単位)を示しています。
この情報を使用して、移行元インスタンスと移行先インスタンス間でデータの整合性を確保できます。
この指標は、移行ジョブに含まれる各データベースで使用できます。また、集計ビューでは、移行ジョブに含まれるすべてのデータベースの概要が表示されます。
移行ジョブの詳細ページで指標を表示する
移行ジョブの詳細ページで指標図を表示する手順は次のとおりです。
- Google Cloud コンソールで、[移行ジョブ] ページに移動します。
- [ジョブ] タブで、移行ジョブの表示名をクリックします。
移行ジョブの詳細ページが開きます。
- [Databases] セクションでは、移行ジョブに含まれる各データベースの復元ラグと未処理のトランザクション ログのバックアップ サイズの数字データを確認できます。
- [モニタリング] タブをクリックして、指標の図を表示します。
- [表示] メニューを使用して、移行ジョブに含まれるすべてのデータベースの集計データを表示したり、特定のデータベースの情報をフィルタしたりできます。
- 各図を Cloud Monitoring で直接表示することもできます。 [その他のグラフ オプション> Metrics Explorer で表示] をクリックします。
Cloud Monitoring で使用可能な指標
次の表に、SQL Server 移行の Metrics Explorer でグラフを作成する際に使用できる移行ジョブ指標を示します。 完全な指標の Database Migration Service 指標リファレンスには、他にもいくつかの指標がリストされていますが、SQL Server の移行では使用できません。
Cloud SQL cloudsql/database/disk/bytes_used 指標を使用して、移行元データベースの合計サイズと比較し、移行ジョブの進行状況を推定することもできます。
| 指標タイプリリース ステージ 表示名 |
|
|---|---|
| 種類、タイプ、単位 モニタリング対象リソース |
説明 ラベル |
migration_
ベータ版
移行ジョブデータの最大ラグバイト数。 |
|
GAUGE、INT64、By
datamigration.googleapis.com/MigrationJob |
現在のレプリケーション ラグ。移行ジョブのすべてのデータで集計されます。60 秒ごとにサンプリングされます。サンプリング後、データは最長 180 秒間表示されません。database: データベース名。 |
migration_
ベータ版
移行ジョブデータの最大遅延(秒単位) |
|
GAUGE、INT64、s
datamigration.googleapis.com/MigrationJob |
現在のレプリケーション ラグ。移行ジョブのすべてのデータで集計されます。60 秒ごとにサンプリングされます。サンプリング後、データは最長 180 秒間表示されません。database: データベース名。 |
migration_
ベータ版
処理されたファイルのバイト数 |
|
DELTA、INT64、By
datamigration.googleapis.com/MigrationJob |
宛先にアップロードされたバイト数。60 秒ごとにサンプリングされます。サンプリング後、データは最長 180 秒間表示されません。database: データベース名。 |
migration_
ベータ版
処理されたファイル数 |
|
DELTA、INT64、1
datamigration.googleapis.com/MigrationJob |
宛先にアップロードされたファイルの数。60 秒ごとにサンプリングされます。サンプリング後、データは最長 180 秒間表示されません。database: データベース名。 |
migration_
ベータ版
トランザクション ログのアップロード秒単位のラグ |
|
GAUGE、INT64、s
datamigration.googleapis.com/MigrationJob |
前回アップロードされたトランザクション ログからのラグ(秒単位)。60 秒ごとにサンプリングされます。サンプリング後、データは最長 180 秒間表示されません。database: データベース名。 |
migration_
ベータ版
未処理のファイル バイト |
|
GAUGE、INT64、By
datamigration.googleapis.com/MigrationJob |
Cloud SQL へのアップロードを待機している未処理のファイルバイト数。60 秒ごとにサンプリングされます。サンプリング後、データは最長 180 秒間表示されません。database: データベース名。 |
migration_
ベータ版
未処理のファイル |
|
GAUGE、INT64、1
datamigration.googleapis.com/MigrationJob |
Cloud SQL へのアップロードを待機している未処理のファイル。60 秒ごとにサンプリングされます。サンプリング後、データは最長 180 秒間表示されません。database: データベース名。 |