Database Migration Service recoge y muestra métricas de las tareas de migración que representan el estado y el progreso del proceso de migración de datos. En esta página se describen las siguientes áreas asociadas a las métricas de los trabajos de migración:
En Métricas disponibles en la página de detalles de la tarea de migración se describe la información de observabilidad que puedes ver directamente en Database Migration Service en la página de detalles de la tarea de migración.
En Métricas disponibles en Cloud Monitoring se describen todas las métricas relacionadas con el rendimiento de los trabajos de migración, incluidas las métricas procedentes del clúster de destino de PostgreSQL.
Métricas disponibles en la página de detalles de la tarea de migración
En la página de detalles de la tarea de migración se muestran varios diagramas que pueden ayudarte a entender el estado actual y el progreso de la tarea de migración. Algunos diagramas proporcionan información a nivel de base de datos, mientras que otros se centran en los datos a nivel de tabla.
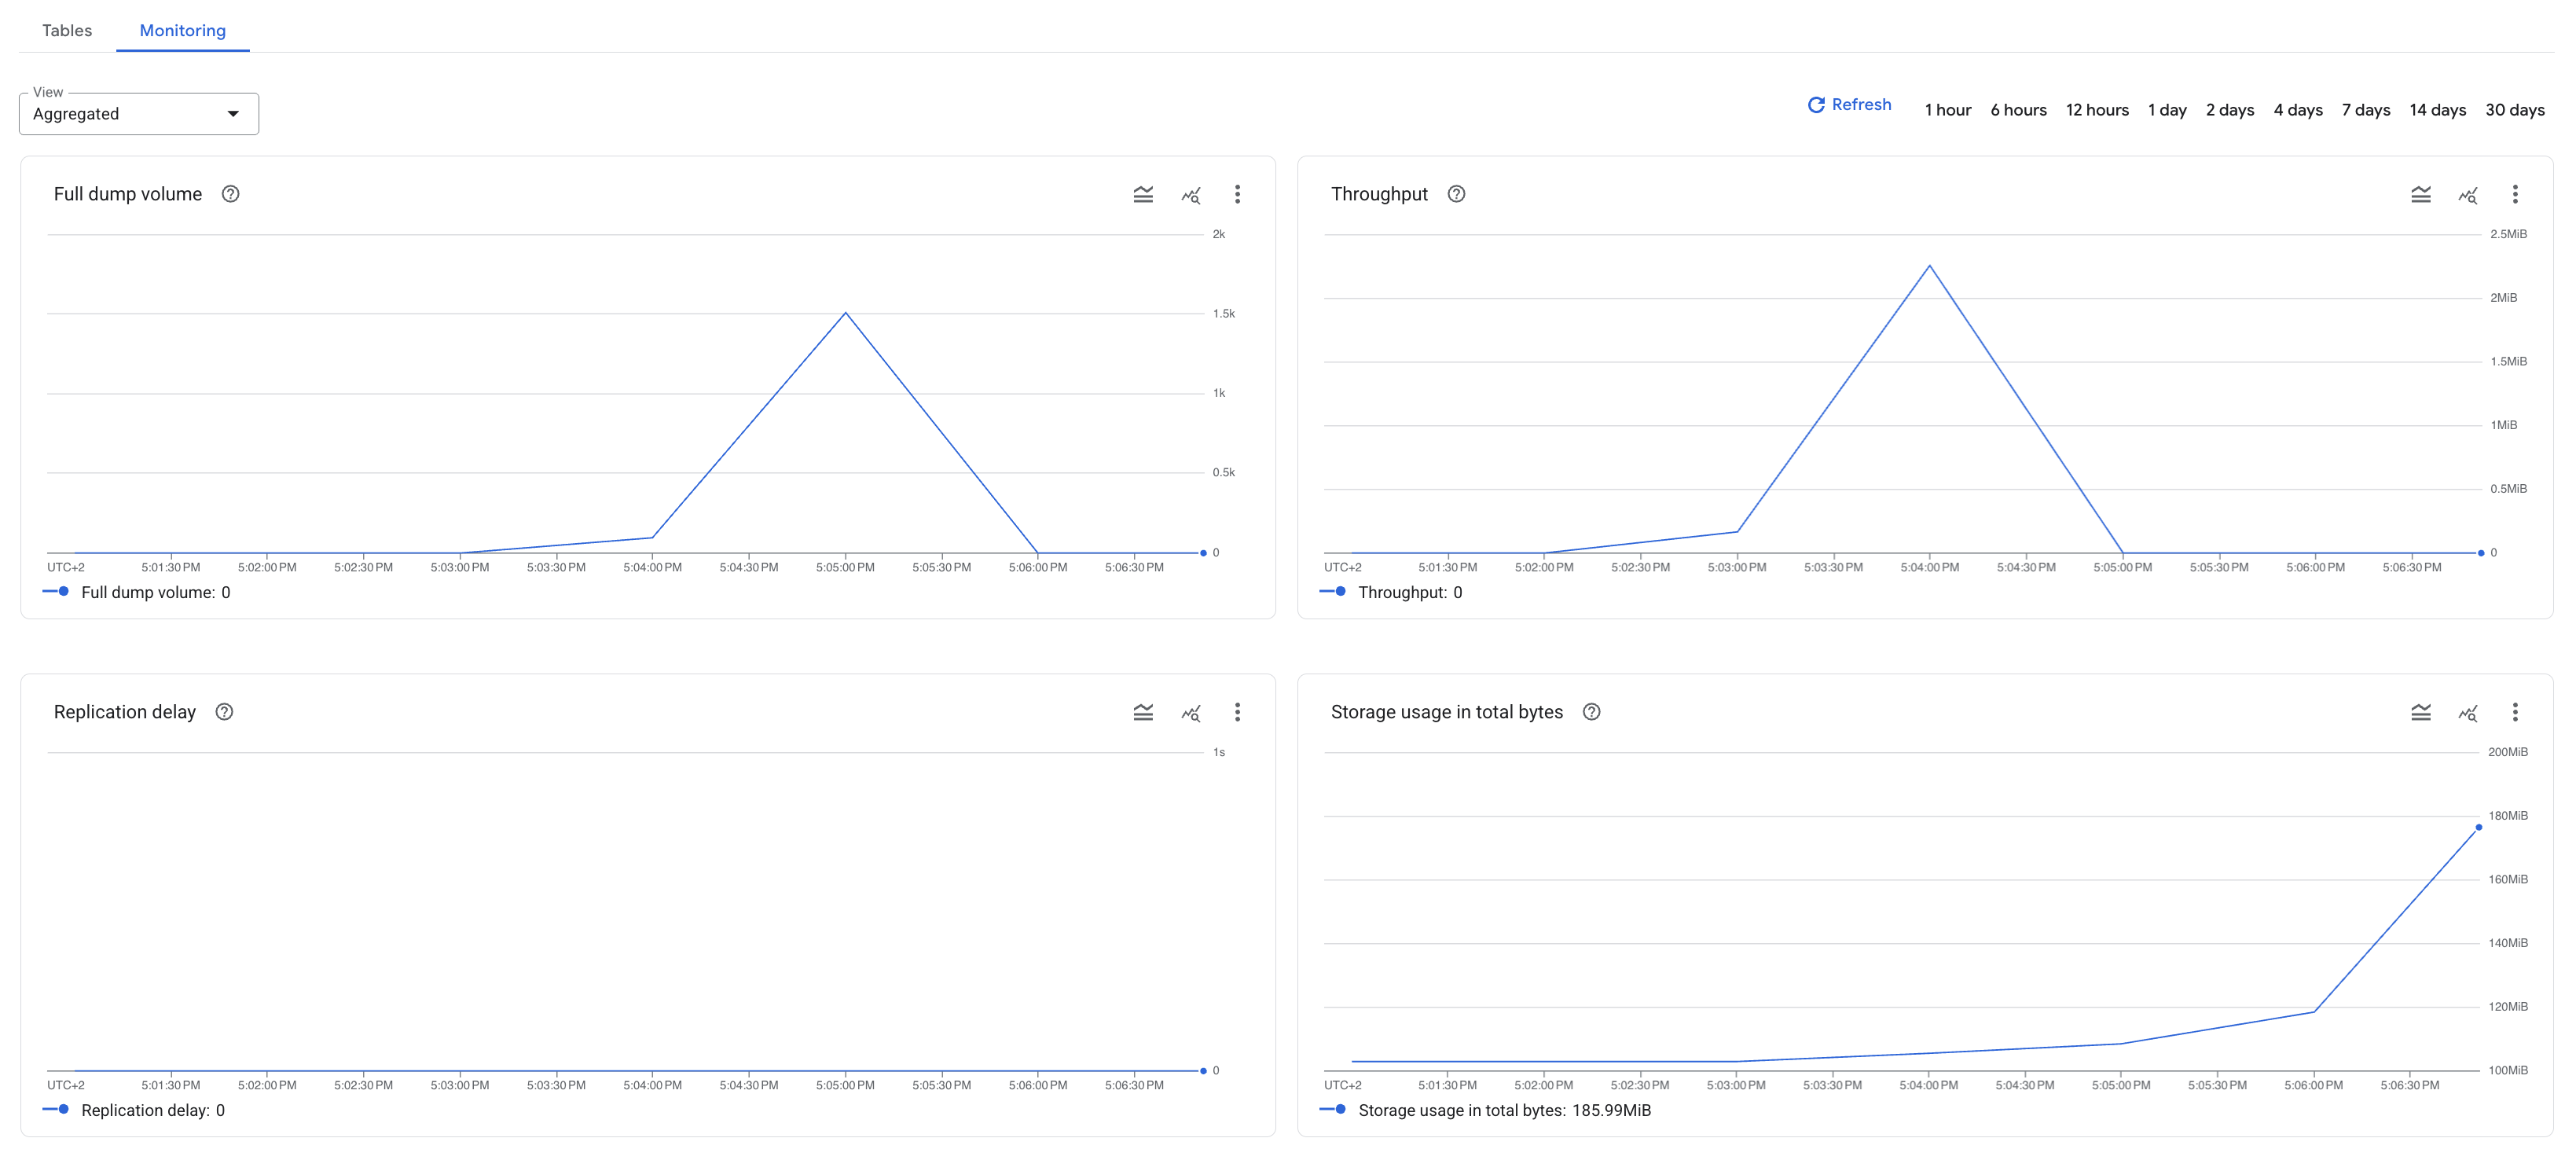
Despliegue las siguientes secciones para obtener más información sobre cada diagrama y su métrica asociada.
Rendimiento
El diagrama Rendimiento usa la métrica
migration_job/write_bytes_count para representar la cantidad de datos (en bytes) que Database Migration Service ha escrito en tu base de datos de destino. Esta métrica se muestrea cada 60 segundos. Puedes usarlo para observar la velocidad de escritura de tu migración.
Esta métrica está disponible en la vista agregada, así como por separado para cada tabla incluida en su tarea de migración.
Volumen de volcado completo
El diagrama Volumen de volcado completo muestra el progreso de la fase de volcado completo expresado como el porcentaje del total de datos de volcado completo migrados. Esta métrica está disponible en la vista agregada, así como por separado para cada tabla incluida en su tarea de migración.
- El diagrama de vista agregada usa la métrica
migration_job/fulldump_progress_percentage. - Los diagramas a nivel de tabla usan la métrica
migration_job/fulldump_progress_percentage_per_object.
Uso de almacenamiento en bytes totales.
En el diagrama Uso del almacenamiento en bytes se usa la métrica
cluster/storage/usage de AlloyDB para PostgreSQL para mostrar la cantidad de datos (en bytes) almacenados en la base de datos migrada de tu instancia de destino de AlloyDB para PostgreSQL. Puede usar esta información para estimar el progreso de su trabajo de migración.
Retraso de replicación
En el diagrama Retraso de la replicación se usa la métrica
migration_job/max_replica_sec_lag para representar la diferencia de tiempo entre el momento en que Database Migration Service empieza a leer la información de captura de datos de cambios (CDC) de tu origen y el momento en que esa información se replica por completo en tu destino.
Puedes usar esta información para estimar cuándo
promocionar la tarea de migración
(te recomendamos que inicies el proceso de cambio cuando el retraso de la replicación sea el más bajo).
Ver métricas en la página de detalles de la tarea de migración
Para ver los diagramas de métricas en la página de detalles de la tarea de migración, sigue estos pasos:
- En la Google Cloud consola, ve a la página Tareas de migración.
- En la pestaña Tareas, haz clic en el nombre visible de la tarea de migración.
Se abrirá la página de detalles de la tarea de migración.
-
En la sección Monitorización, usa el menú Ver para ajustar los diagramas que quieras mostrar:
- Para ver las métricas agregadas de todo el trabajo de migración, haga clic en Ver > Agregado.
- Para ver las métricas a nivel de tabla, haga clic en Ver > Tablas y, a continuación, seleccione las tablas que quiera.
Métricas disponibles en Cloud Monitoring
En la siguiente tabla se describen todas las métricas de trabajos de migración que puede usar para crear gráficos en el Explorador de métricas para migraciones heterogéneas de Oracle. En la referencia completa de métricas de Database Migration Service se enumeran varias métricas adicionales, pero no están disponibles para las migraciones heterogéneas de Oracle.
También puedes usar la métrica
AlloyDB para PostgreSQL alloydb/cluster/storage/usage
y compararla con el tamaño total de tus bases de datos de origen para estimar el progreso del trabajo de migración.
| Tipo de métrica Fase de lanzamiento Nombre visible |
|
|---|---|
| Tipo, unidad Recursos monitorizados |
Descripción Etiquetas |
migration_job/fulldump_progress_percentage
BETA
(project)
Porcentaje de progreso de volcado completo |
|
GAUGE, DOUBLE, %
datamigration.googleapis.com/MigrationJob |
Porcentaje de progreso del volcado completo inicial de la tarea de migración. Se muestrea cada 60 segundos. Después del muestreo, los datos no podrán verse durante un máximo de 180 segundos. |
migration_job/fulldump_progress_percentage_per_object
BETA
(project)
Porcentaje de progreso de volcado completo por objeto |
|
GAUGE, DOUBLE, %
datamigration.googleapis.com/MigrationJob |
Porcentaje de progreso del volcado completo inicial de una sola tabla en una tarea de migración. Se muestrea cada 60 segundos. Después del muestreo, los datos no podrán verse durante un máximo de 180 segundos. |
migration_
BETA
Recuento de bytes de escritura |
|
DELTA, INT64, By
datamigration.googleapis.com/MigrationJob |
Número de bytes escritos en el destino. Se muestrea cada 60 segundos. Después del muestreo, los datos no podrán verse durante un máximo de 180 segundos.
database: nombre de la base de datos.
|
migration_
BETA
Número máximo de bytes de latencia de los datos de la tarea de migración. |
|
GAUGE, INT64, By
datamigration.googleapis.com/MigrationJob |
Latencia de replicación actual, agregada en todos los datos de la tarea de migración. Se muestrea cada 60 segundos. Después del muestreo, los datos no podrán verse durante un máximo de 180 segundos.
database: nombre de la base de datos.
|
migration_
BETA
Retraso máximo en segundos de los datos de la tarea de migración |
|
GAUGE, INT64, s
datamigration.googleapis.com/MigrationJob |
Latencia de replicación actual, agregada en todos los datos de la tarea de migración. Se muestrea cada 60 segundos. Después del muestreo, los datos no podrán verse durante un máximo de 180 segundos.
database: nombre de la base de datos.
|
migration_job/unsupported_events_count
BETA
(proyecto)
Número de eventos no admitidos |
|
DELTA, INT64, By
datamigration.googleapis.com/MigrationJob |
Número de eventos no admitidos por migración y por tabla. Se muestrea cada 60 segundos. Después del muestreo, los datos no podrán verse durante un máximo de 180 segundos. |