Después de crear un trabajo de aplicación de parches, puedes usar Cloud Monitoring a fin de configurar alertas para supervisar el proceso de aplicación de parches.
Cuando se crea un trabajo de aplicación de parches, VM Manager publica el estado de la VM agregada en la API de Cloud Monitoring. Este estado se publica cada minuto después de que se inicia el trabajo de aplicación de parches. La publicación del estado se detiene 15 minutos después de que se completa el trabajo de aplicación de parches.
Para supervisar tus trabajos de aplicación de parches con alertas, completa los siguientes pasos:
- Inicia un trabajo de aplicación de parches. Consulta Crea trabajos de aplicación de parches.
- Configura métricas en Cloud Monitoring para el trabajo de aplicación de parches.
- Crea alertas de parches.
Antes de empezar
-
Si aún no lo hiciste, configura la autenticación.
La autenticación verifica tu identidad para acceder a los Google Cloud servicios y las APIs. Para ejecutar código o muestras desde un entorno de desarrollo local, puedes autenticarte en Compute Engine seleccionando una de las siguientes opciones:
Select the tab for how you plan to use the samples on this page:
Console
When you use the Google Cloud console to access Google Cloud services and APIs, you don't need to set up authentication.
gcloud
-
Instala Google Cloud CLI. Después de la instalación, inicializa Google Cloud CLI ejecutando el siguiente comando:
gcloud initSi usas un proveedor de identidad externo (IdP), primero debes acceder a gcloud CLI con tu identidad federada.
- Set a default region and zone.
REST
Para usar las muestras de la API de REST en esta página en un entorno de desarrollo local, debes usar las credenciales que proporciones a gcloud CLI.
Instala Google Cloud CLI. Después de la instalación, inicializa Google Cloud CLI ejecutando el siguiente comando:
gcloud initSi usas un proveedor de identidad externo (IdP), primero debes acceder a gcloud CLI con tu identidad federada.
Para obtener más información, consulta Autentícate para usar REST en la documentación de autenticación de Google Cloud .
Configura métricas
En esta sección, configurarás las métricas de seguimiento para tu trabajo de aplicación de parches con el Explorador de métricas. Para obtener información más detallada sobre cómo usar el Explorador de métricas, consulta Elige métricas cuando usas el Explorador de métricas.
Puedes usar Cloud Monitoring para realizar un seguimiento de los recursos en varios proyectos. Si deseas ver las métricas de los trabajos de aplicación de parches que se encuentran en proyectos diferentes, agrega los proyectos al mismo lugar de trabajo de supervisión. A fin de obtener más información, consulta Visualiza métricas para varios proyectos.
En la consola de Google Cloud , ve a la página Cloud Monitoring > Explorador de métricas.
En la sección Seleccionar una métrica, selecciona Trabajo de aplicación de parches.
Selecciona la lista de categorías de métricas activas Parche y, luego, selecciona Estado de parches de las instancias de VM.
Haz clic en Aplicar.
Revisa las métricas.
Opcional. Crea un gráfico. Para obtener más información, consulta Crea un gráfico con el Explorador de métricas.
Crea alertas de parches
En Cloud Monitoring, puedes configurar una política de alertas que proporcione notificaciones sobre el estado del parche para que puedas resolver los problemas que se presenten de manera oportuna. Para obtener más información sobre las alertas, consulta Introducción a las alertas.
Estados de parches de las instancias de VM
A fin de crear la alerta para los trabajos de aplicación de parches, usa el estado del parche de la instancia de VM como la condición del filtro de la alerta. Los siguientes estados de parches de las instancias de VM están disponibles:
ACKED: el agente de configuración del SO recibió la notificación del parche, pero aún no comenzó a aplicar parchesAPPLYING_PATCHES: el agente de configuración del SO está aplicando los parches a la VMDOWNLOADING_PATCHES: el agente de configuración del SO está descargando los parches en la VMFAILED: el trabajo de aplicación de parches fallóINACTIVE: la VM no se está ejecutandoNO_AGENT_DETECTED: el servicio de parche no puede comunicarse con el agente de configuración del SO en la VM. Asegúrate de que tus VM estén conectadas de forma correcta. Para obtener más información, consulta Configura VM Manager.NOTIFIED: se notifica al agente de configuración del SO en la VM, pero no se inició el trabajo de aplicación de parchesPATCH_STATE_UNSPECIFIED: se desconoce el estado del trabajo de aplicación de parchesPENDING: la VM aún no recibió una tarea de aplicación de parches. Esto sucede porque el trabajo de aplicación de parches se inició recientemente o la VM está esperando un lanzamiento gradual.REBOOTING: la VM se está reiniciandoRUNNING_PRE_PATCH_STEP: el agente de configuración del SO ejecuta pasos previos a la aplicación de parchesRUNNING_POST_PATCH_STEP: el agente de configuración del SO ejecuta pasos posteriores a la aplicación del parcheSTARTED: el trabajo de aplicación de parche se inició en la VMSUCCEEDED: se completó correctamente el trabajo de aplicación de parcheSUCCEEDED_REBOOT_REQUIRED: el trabajo de aplicación de parche se completó de forma correcta, pero es necesario reiniciar la VMTIMED_OUT: se agotó el tiempo de espera del proceso de aplicación de parches
Ejemplo de alerta de parche
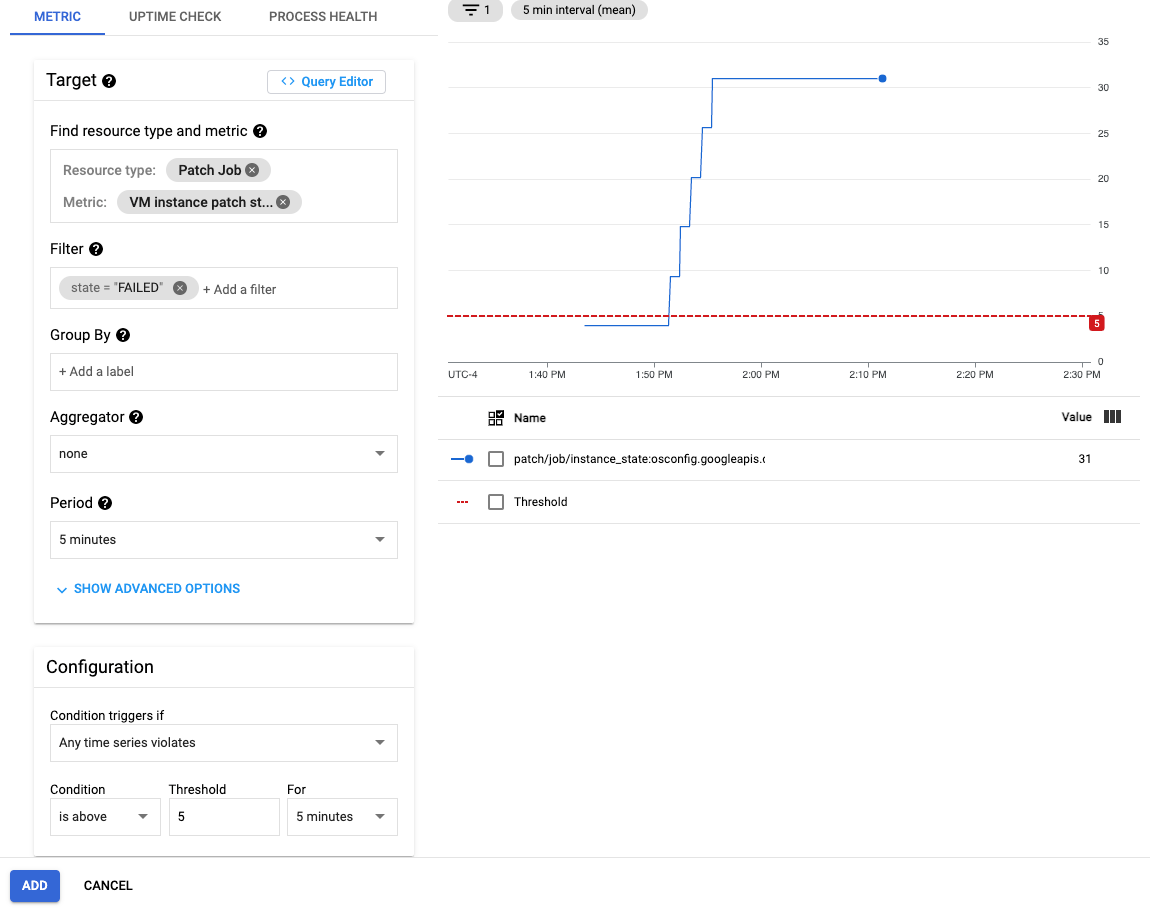
En el siguiente ejemplo, se crea una alerta de parche que te notifica si hay más de cinco VM con errores en un trabajo de aplicación de parches reciente.
Puedes crear alertas con la consola de Google Cloud o la API de Cloud Monitoring. En el siguiente ejemplo, se usa la consola de Google Cloud . Para obtener información detallada sobre cómo crear una alerta con la consola de Google Cloud , consulta Crea una política de alertas.
En la consola de Google Cloud , ve a la página Monitoring.
En el panel de navegación de Monitoring, haz clic en Alertas.
Haz clic en Crear política.
Haga clic en Add Condition.
- En el menú desplegable Tipo de recurso, elige Trabajo de aplicación de parche.
- En el menú desplegable Métrica, elige Estado de parches de las instancias de VM.
- En el campo Filtro, especifica
state=FAILED. - En la sección Configuración, establece
Any time series violate = 5.. - Haz clic en Agregar.
Haz clic en Siguiente para pasar a la sección de notificaciones.
- Configura los canales de notificación.
Haz clic en Siguiente para pasar a la sección de notificaciones.
- Configura un nombre de política de alertas
- Proporciona instrucciones para corregir el problema
Haz clic en Guardar.
Próximos pasos
- Obtén más información sobre los parches.
- Administra los trabajos de parche.
- Programa trabajos de aplicación de parche.
Salvo que se indique lo contrario, el contenido de esta página está sujeto a la licencia Atribución 4.0 de Creative Commons, y los ejemplos de código están sujetos a la licencia Apache 2.0. Para obtener más información, consulta las políticas del sitio de Google Developers. Java es una marca registrada de Oracle o sus afiliados.
Última actualización: 2025-10-19 (UTC)
-