使用圖表儲存格
本指南說明如何使用視覺化儲存格,在 Colab Enterprise 筆記本中將資料視覺化。
視覺化儲存格可根據筆記本中 DataFrame 的資料,生成可編輯的互動式視覺化內容。您可以設定視覺化儲存格,探索資料並發掘洞察資料。視覺化儲存格設定選項包括:
- 指定要在圖表中使用的欄位。
- 選取圖表類型,例如散布圖或長條圖。
- 指定資料的匯總方式。
- 變更圖表的顏色、標籤和標題。
限制
規劃專案時,請注意下列限制:
- 重新執行視覺化儲存格會重設現有的視覺化設定。
- 使用 pandas DataFrame 時,「後續步驟」下方的「視覺化」選項不一定會顯示。
- Gemini in Colab Enterprise 無法與視覺化儲存格互動。也就是說,Gemini 無法讀取或建議變更視覺化儲存格,也可能無法說明或協助修正視覺化儲存格產生的錯誤。
事前準備
- Sign in to your Google Cloud account. If you're new to Google Cloud, create an account to evaluate how our products perform in real-world scenarios. New customers also get $300 in free credits to run, test, and deploy workloads.
-
In the Google Cloud console, on the project selector page, select or create a Google Cloud project.
Roles required to select or create a project
- Select a project: Selecting a project doesn't require a specific IAM role—you can select any project that you've been granted a role on.
-
Create a project: To create a project, you need the Project Creator
(
roles/resourcemanager.projectCreator), which contains theresourcemanager.projects.createpermission. Learn how to grant roles.
-
Verify that billing is enabled for your Google Cloud project.
-
Enable the BigQuery, Compute Engine, Dataform, and Vertex AI APIs.
Roles required to enable APIs
To enable APIs, you need the Service Usage Admin IAM role (
roles/serviceusage.serviceUsageAdmin), which contains theserviceusage.services.enablepermission. Learn how to grant roles. -
BigQuery 使用者 (
roles/bigquery.user) -
Colab Enterprise 使用者 (
roles/aiplatform.colabEnterpriseUser) -
前往 Google Cloud 控制台的 Colab Enterprise「我的筆記本」頁面。
-
在「Region」(區域) 選單中,選取包含筆記本的區域。
-
按一下要開啟的筆記本。如果尚未建立筆記本,請建立筆記本。
-
在工具列中,如要新增 SQL 儲存格,請按一下「插入程式碼儲存格選項」選單,然後選取「新增 SQL 儲存格」。
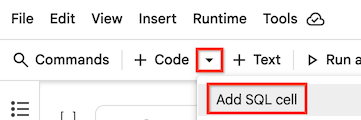
系統隨即會在筆記本中新增 SQL 儲存格。
-
在 SQL 儲存格中輸入 SQL 查詢。舉例來說,如要查詢 BigQuery 企鵝公開資料集的資料,可以輸入下列內容:
SELECT * FROM `bigquery-public-data.ml_datasets.penguins`;
-
將指標懸停在 SQL 儲存格上,然後按一下「執行儲存格」按鈕。
-
使用下列其中一種方法,將視覺化儲存格新增至筆記本:
-
在工具列中,如要新增圖表儲存格,請按一下「插入程式碼儲存格選項」選單,然後選取「新增圖表儲存格」。

-
將指標放在筆記本中的兩個儲存格之間,指出要新增圖表儲存格的位置,然後按一下「圖表」按鈕。

系統會在筆記本中新增圖表儲存格。
-
-
在視覺化儲存格中,如要選取要視覺化的 DataFrame,請按一下「Choose a dataframe」(選擇 DataFrame) 選單,然後選取「df」。
-
將指標懸停在視覺化儲存格上,然後按一下「執行儲存格」按鈕。
Colab Enterprise 會產生預設的視覺化效果。 如要變更視覺化效果,請參閱下一節。
-
如果產生的 DataFrame 下方有「後續步驟」部分,請按一下「使用 DATAFRAME_NAME 視覺化」按鈕。
系統隨即會在筆記本中新增圖表儲存格。系統會自動將前一個儲存格的 DataFrame 設為這個視覺化儲存格的資料來源。
-
將指標懸停在視覺化儲存格上,然後按一下「執行儲存格」按鈕。
Colab Enterprise 會產生預設的視覺化效果。 如要變更視覺化效果,請參閱下一節。
-
在視覺化儲存格中,按一下「資料」按鈕,即可查看視覺化圖表使用的基礎資料。
-
按一下「圖表」按鈕,即可切換回「圖表」模式並查看視覺化資料。
-
如要顯示或隱藏設定,請按一下「切換設定」按鈕。
-
在設定面板中,如要選取其他圖表類型,請按一下「圖表類型」選單,然後選取所需圖表類型。部分圖表類型只會使用可用 DataFrame 中的部分欄位。
-
在「設定」分頁中,選取不同維度和指標,即可變更用於視覺化呈現的欄位。一般來說,維度是資料中的類別欄位,指標則是數值。
-
如要變更指標的匯總設定,請按一下指標名稱左側的匯總設定,然後選取其他匯總設定。
-
如要變更排序依據的指標,請按一下「排序」指標,然後選取其他指標。您也可以變更匯總方式,以及是否要遞減或遞增排序值。
-
在「樣式」分頁中,您可以變更視覺化效果的文字和外觀,包括:
- 要顯示還是隱藏標題和標籤
- 標題文字
- 軸標籤文字
- 文字的字型、大小和顏色
- 視覺化指標的顏色
-
在資料格頂端按一下「新增篩選條件」。
-
選取要篩選資料的欄位。
-
如要完成篩選器對話方塊,請根據要篩選的資料類型執行下列其中一項操作:
- 如果是維度或類別資料,請選取要納入視覺化效果的類別。
- 如果是指標或數值資料,請調整滑桿,設定要在視覺化效果中納入的最低和最高值。
-
按一下「套用」。
進一步瞭解 BigQuery DataFrames。
在 Colab Enterprise 筆記本中使用 SQL 儲存格。
使用 Gemini 說明及修正錯誤。
必要的角色
如要取得建立 Colab Enterprise 筆記本、在執行階段執行筆記本程式碼,以及在筆記本中使用 BigQuery 資料所需的權限,請要求管理員將專案的下列 IAM 角色授予您:
如要進一步瞭解如何授予角色,請參閱「管理專案、資料夾和機構的存取權」。
建立 DataFrame
如要使用視覺化儲存格,您必須將資料儲存在筆記本的 DataFrame 中。如要建立 DataFrame,您可以在 SQL 儲存格中執行 SQL 查詢。如要進一步瞭解 SQL 儲存格,請參閱「使用 SQL 儲存格」。
如要執行 SQL 查詢並建立 DataFrame,請按照下列步驟操作:
查詢輸出內容會自動儲存到名為 df 的 DataFrame 中。
建立視覺化內容
如要從筆記本中的 DataFrame 建立視覺化效果,可以新增視覺化儲存格,然後設定該儲存格使用特定 DataFrame。或者,如果產生的 DataFrame 下方顯示「後續步驟」部分,您可以按一下「使用 DATAFRAME_NAME 視覺化」按鈕。
新增圖表儲存格
使用 DataFrame 製作圖表
設定視覺化
視覺化儲存格會產生預設的視覺化圖表,您可以使用儲存格的側邊面板進行設定。設定選項會因您使用的資料和視覺化圖表類型而異。
如要查看視覺化儲存格的設定,請執行下列操作:
篩選資料圖表中的資料
您可以根據欄位值篩選視覺化圖表中的資料。 如要篩選資料,請按照下列步驟操作: