Deploy a Kubernetes app by using remote development
This page shows you how to get started quickly with Cloud Code for VS Code using a remote development environment in Cloud Shell.
In this quickstart, you'll skip setup and clone a project into your remote development workspace with the click of a button, create a cluster, run a Kubernetes app on this cluster, debug your running code, view logs from your live application, and connect a terminal to your running container.
Before you begin
To set up supporting resources and access Cloud Shell, the remote development environment on Google Cloud that you use in this quickstart, inside VS Code, complete the following steps:
- Sign in to your Google Cloud account. If you're new to Google Cloud, create an account to evaluate how our products perform in real-world scenarios. New customers also get $300 in free credits to run, test, and deploy workloads.
-
In the Google Cloud console, on the project selector page, select or create a Google Cloud project.
Roles required to select or create a project
- Select a project: Selecting a project doesn't require a specific IAM role—you can select any project that you've been granted a role on.
-
Create a project: To create a project, you need the Project Creator
(
roles/resourcemanager.projectCreator), which contains theresourcemanager.projects.createpermission. Learn how to grant roles.
-
Verify that billing is enabled for your Google Cloud project.
-
In the Google Cloud console, on the project selector page, select or create a Google Cloud project.
Roles required to select or create a project
- Select a project: Selecting a project doesn't require a specific IAM role—you can select any project that you've been granted a role on.
-
Create a project: To create a project, you need the Project Creator
(
roles/resourcemanager.projectCreator), which contains theresourcemanager.projects.createpermission. Learn how to grant roles.
-
Verify that billing is enabled for your Google Cloud project.
- Install Visual Studio Code on your machine, if you haven't already.
- Install the Remote - SSH Visual Studio Code extension.
- Install Git. Git is required for copying samples to your machine.
- Install the Cloud Code plugin if you haven't already.
Launching Cloud Code
When you open Visual Studio Code connected to a remote development environment in Cloud Shell, the environment has all the tools you need to develop Kubernetes applications.
To start work in your remote development workplace, choose your preferred language for the cloned project and then click the Open with Cloud Code button:
Node.js
Java
Python
Go
VS Code launches and clones a project into your remote development workspace.
If you don't already have the prerequisites set up, you're prompted to install them.
Create a GKE cluster
To create a Standard Google Kubernetes Engine (GKE) cluster, follow these steps:
Click
Cloud Code and expand the Kubernetes section.
Click add Add a Cluster to the KubeConfig and then click Google Kubernetes Engine in the Quick pick menu.
When prompted to enable
container.googleapis.com, select Yes.Click + Create a New GKE Cluster.
Choose Standard as the cluster type.
Click Open to permit Cloud Code to open the Google Cloud console.
In Google Cloud console, use the project you created, set the zone to
us-central1-a, and set the cluster name tomy-first-cluster.Click Create. Cluster creation takes a few minutes.
After the cluster is created, in the Quick pick menu, click refresh Refresh.
After the name of your new cluster appears in the list, click the cluster name. Your new cluster is added to the configuration and configured to be the active context.
Run and view your app
Now that you're all set up, you can run your application and view it live. Cloud Code watches your file system for changes so that you can edit and rerun your app in near real time.
To run your application, follow these steps:
In the Cloud Code status bar, click the active project name.

In the Quick Pick menu that appears, select Run on Kubernetes.
Confirm whether to use the current cluster context or switch to a different one.
If prompted, choose an image registry to push the images to. If you're creating a new image registry using
gcr.io/PROJECT_ID, ensure that the image registry is in the same project as your cluster.An output window appears where you can track the progress of your running application. You'll also see a live stream of the logs from the running pods in the terminal output.
After your application is running on Kubernetes, the output window displays an IP address. To use this linked IP address to access your application, press
Ctrl/Cmdand click the address.
Troubleshooting tips
If you're using a pre-existing cluster, to set your cluster as active and get cluster credentials, follow these steps:
Click
Cloud Code and expand the Kubernetes section.
Right-click your cluster name and then click Set as Active Cluster.
Debug your app
To debug your application, follow these steps:
In the Cloud Code status bar, click the active project name.

In the Quick Pick menu that appears, select Debug on Kubernetes.
If prompted, authenticate your credentials to run and debug an application locally.
If prompted, confirm whether to use the current cluster context or switch to a preferred one.
Cloud Code uses the
cloudcode.kubernetesconfigurations in your.vscode/launch.jsonfile to run your application and attach a debugger session to it.Cloud Code builds your containers, pushes them to the registry, applies Kubernetes configurations to the cluster, and returns the IP address that you can use to browse your live application.
Before your debugger session is attached, you're prompted to confirm or enter the directory in the remote container where the program to debug is found or press ESC to skip debugging the container.
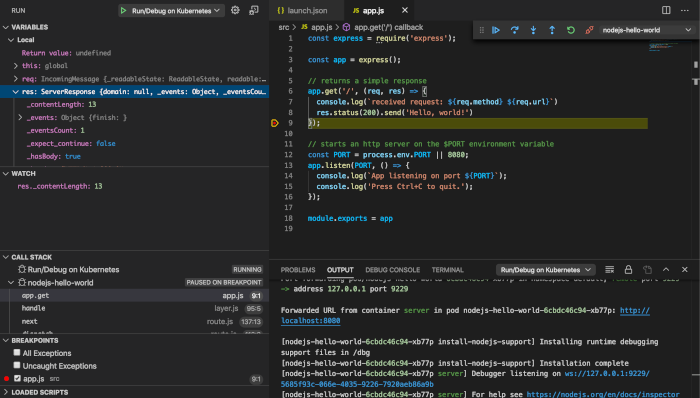
To add a breakpoint to line #9, open
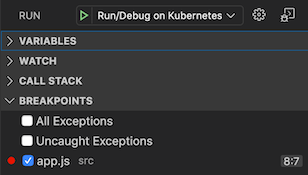
src/app.jsand then click in the editor margin.Red filled circles signify active breakpoints, while gray hollow circles signify disabled breakpoints. For finer breakpoint control, you can use the Breakpoints section in VS Code's Debug view.

When you send a new request to your application, the debugger pauses at the first active breakpoint.
In the following sample, under Local in the Variables section, note that the value of
res._contentLength;forHello, world!is 13.
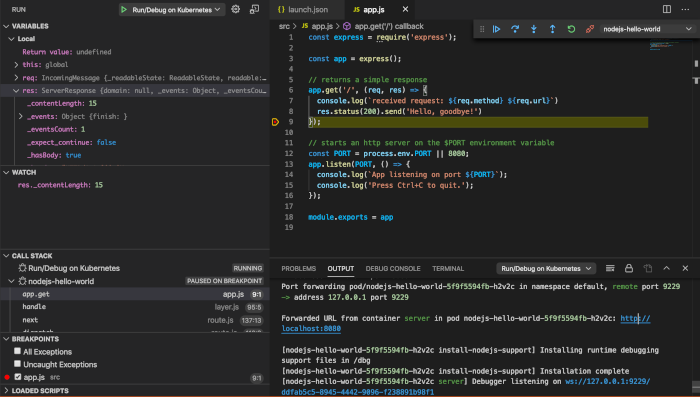
Edit the string being sent inline #8 to
Hello, goodbye!and then restart the Debug on Kubernetes action.After the app is rebuilt and redeployed, note the updated value of
res._contentLength.
After your debugging session starts, the Development sessions pane displays the structured logging view. As a task begins, the task appears with a spinning semi-circle progress_activity.
If a task succeeds, a check mark check_circle appears next to the step.
To see details of a step, click the step in the Development session pane. The Output pane displays the step in the logging output.
Open a terminal in your container
To open a terminal in your container, follow these instructions:
Click
Cloud Code and expand the Kubernetes section.
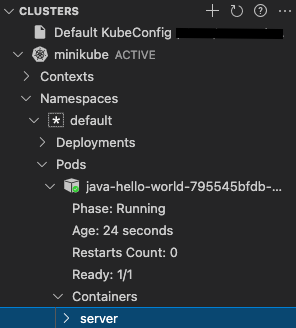
Expand the following sections:
- Your preferred cluster's section
- The Namespaces section and then your preferred namespace's section
- The Pods section and then your preferred pod's section
The Containers section

Right-click the container in which you'd like to open a terminal and then click Get Terminal.
This launches a terminal. You now have access to a shell inside the running container.
Clean up
After you stop your application, all Kubernetes resources deployed during the run are deleted automatically.
To avoid incurring charges to your account for other resources used in this quickstart, be sure to delete the project or delete the cluster you created if you want to reuse the project.
To delete the cluster:
- Click
Cloud Code and then expand the Kubernetes explorer.
- Hold the pointer over your cluster name and then click open_in_new Open in Google Cloud console.
- Click Delete and then click Delete.
To delete your project (and associated resources, including any clusters):
- In the Google Cloud console, go to the Manage resources page.
- In the project list, select the project that you want to delete, and then click Delete.
- In the dialog, type the project ID, and then click Shut down to delete the project.
What's next
- Consider importing an existing application into VS Code and getting set up with Cloud Code.
- Tackle more advanced Google Cloud and Kubernetes configuration with Cloud Code's YAML editing support.
- Discover the language-specific debugging support that Cloud Code provides.
- Speed up your development with file sync and hot reloading.
- Create and configure a GKE cluster
- Configure private clusters
- Customize your Cloud Code experience by configuring relevant settings.
