VS Code용 Cloud Code를 사용하면 skaffold debug를 활용하여 Cloud Run에 배포된 애플리케이션을 쉽게 디버깅할 수 있습니다. Skaffold 디버깅에 대한 자세한 내용은 Skaffold를 사용하여 디버깅을 참조하세요.
포트 전달 설정 또는 언어별 디버그 인수 삽입과 같은 수동 설정을 완료할 필요가 없습니다. 디버깅을 위해서는 skaffold.yaml 구성 파일과 cloudcode.cloudrun 유형의 launch.json 파일이 포함된 Cloud Code에 사용 가능한 Cloud Run 애플리케이션이 필요합니다.
Cloud Run 서비스 디버깅
서비스를 디버그하려면 다음 단계를 따르세요.
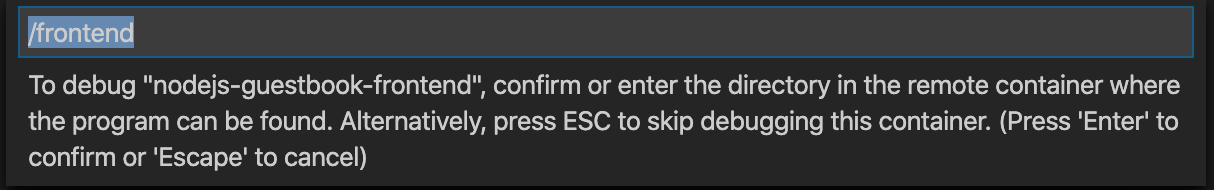
서비스를 실행하고 디버거 세션을 연결하려면 명령어 팔레트를 연 다음(Ctrl/Cmd+Shift+P 키를 누르거나 뷰 > 명령어 팔레트 클릭) Cloud Run 에뮬레이터에서 디버그 명령어를 실행합니다.
Cloud Run 에뮬레이터의 실행/디버그 대화상자에서 구성의 사양을 설정합니다.
Docker 또는 Buildpacks를 빌더로 선택한 다음Dockerfile 또는 Buildpack을 지정합니다.
(선택사항) Dockerfile 대상 또는 빌드 인수를 지정하려면 고급 빌드 설정 표시를 클릭한 후 대상 또는 인수를 지정합니다.
(선택사항) 커스텀 서비스 이름, 컨테이너 이미지 URL, 컨테이너 포트, 사용할 서비스 ID, 전용 CPU 수 또는 각 컨테이너 인스턴스에 할당할 메모리 양을 지정하려면 고급 서비스 설정 표시를 클릭한 다음 값을 지정합니다.
(선택사항) 환경 변수를 지정하려면 고급 서비스 설정 표시를 클릭하고 환경 변수를 클릭한 다음 값을 지정합니다.
(선택사항) Cloud SQL 연결을 지정하려면 연결을 클릭한 후 연결을 한 줄에 하나씩 지정합니다.
(선택사항) VS Code가 코드 변경사항을 저장한 후 디버깅 세션을 다시 설정하도록 하려면 자동으로 변경사항 빌드 및 변경사항 재실행 체크박스를 선택합니다.
[[["이해하기 쉬움","easyToUnderstand","thumb-up"],["문제가 해결됨","solvedMyProblem","thumb-up"],["기타","otherUp","thumb-up"]],[["이해하기 어려움","hardToUnderstand","thumb-down"],["잘못된 정보 또는 샘플 코드","incorrectInformationOrSampleCode","thumb-down"],["필요한 정보/샘플이 없음","missingTheInformationSamplesINeed","thumb-down"],["번역 문제","translationIssue","thumb-down"],["기타","otherDown","thumb-down"]],["최종 업데이트: 2025-02-11(UTC)"],[[["\u003cp\u003eCloud Code for VS Code simplifies debugging applications deployed to Cloud Run using \u003ccode\u003eskaffold debug\u003c/code\u003e, eliminating the need for manual setup like port forwarding.\u003c/p\u003e\n"],["\u003cp\u003eDebugging requires a Cloud Code-ready Cloud Run application with \u003ccode\u003eskaffold.yaml\u003c/code\u003e and a \u003ccode\u003elaunch.json\u003c/code\u003e file of type \u003ccode\u003ecloudcode.cloudrun\u003c/code\u003e, which you can further customize.\u003c/p\u003e\n"],["\u003cp\u003eThe debugging process can be initiated via the VS Code command palette using the \u003cstrong\u003eDebug on Cloud Run Emulator\u003c/strong\u003e command, offering various configuration options like builder type, service settings, and environment variables.\u003c/p\u003e\n"],["\u003cp\u003eCloud Code automatically handles language-specific debugger configurations for Node.js, Python, Go, Java, and .NET, ensuring seamless debugging experiences.\u003c/p\u003e\n"],["\u003cp\u003eTroubleshooting container-building issues, such as the \u003ccode\u003eBUILD_DOCKER_UNKNOWN\u003c/code\u003e error, can often be resolved by restarting Docker or managing disk space using tools like Docker's Disk Usage extension.\u003c/p\u003e\n"]]],[],null,["# Debug a Cloud Run service in Cloud Code for VS Code\n\nCloud Code for VS Code lets you easily debug an application deployed to\nCloud Run by leveraging\n[`skaffold debug`](https://skaffold.dev/docs/workflows/debug). For detailed\ninformation about Skaffold debugging, see\n[Debugging with Skaffold](https://skaffold.dev/docs/workflows/debug/).\n\nYou don't need to complete manual setup like setting up port forwarding or\ninjecting language-specific debug arguments. Debugging requires a\nCloud Code-ready Cloud Run application\nthat includes a `skaffold.yaml` configuration file and a `launch.json` file of\ntype `cloudcode.cloudrun`.\n\nDebug your Cloud Run service\n----------------------------\n\nTo debug your service, follow these steps:\n\n1. To run your service and attach a debugger session to it, open the\n command palette (press `Ctrl`/`Cmd`+`Shift`+`P` or click **View** \\\u003e\n **Command Palette** )\n and then run the **Debug on Cloud Run Emulator** command.\n\n2. In the Run/Debug on Cloud Run Emulator dialog, set the\n specifications for your configuration:\n\n - Choose Docker or Buildpacks as your builder and then specify your Dockerfile or Buildpack.\n - (Optional) To specify a Dockerfile target or build arguments, click **Show Advanced Build Settings** and then specify the target or arguments.\n - (Optional) To specify a custom service name, container image URL, container port, identity for the service to use, number of dedicated CPUs, or amount of memory to allocate to each container instance, click **Show Advanced Service Settings** and then specify the values.\n - (Optional) To specify any [environment variables](/code/docs/vscode/develop-service#optional_customizing_your_configuration), click **Show Advanced Service Settings** , click **Environment Variables**, and then specify the values.\n - (Optional) To specify Cloud SQL connections, click **Connections** and then specify one connection per line.\n - (Optional) To have VS Code reestablish a debugging session after you save a change to your code, check the **Automatically re-build and re-run on changes** checkbox.\n\n If you want to further customize how your service is run, you can edit\n [your `launch.json` file](/code/docs/vscode/develop-service#customizing_an_existing_launchjson_configuration)\n directly.\n3. To begin debugging your service, click **Debug**.\n\n4. If prompted, [authenticate your credentials to run and debug an\n application locally](/code/docs/vscode/install#authenticate_credentials_for_debugging_applications_locally).\n\n5. For each debuggable container in your service, confirm or enter the directory\n in the remote container where the program you'd like to debug is found.\n\n Alternatively, you can press `ESC` to skip debugging a container.\n\n Cloud Code attaches a debug session for each debuggable\n container in the service.\n\n\n By default, when you save a change to your application,\n Cloud Code redeploys your application and sets up a new debug\n session. You can toggle this feature with the `watch` flag in your project's\n launch configuration.\n\n6. To add a breakpoint, click in the editor margin of the file you're debugging.\n\n Red filled circles signify active breakpoints and gray hollow circles\n signify disabled breakpoints.\n\n For finer breakpoint control, you can use the Breakpoints section in VS\n Code's Debug view.\n\n When you send a new request to your service, it pauses at the line you\n specified.\n7. After your session completes, right-click to use the following commands:\n\n - **View Logs:** Open the application logs of a specific deployment with the Cloud Code Logs Explorer\n - **Open URL:** Open the application service URL of a specific service in a web browser\n8. If you've turned off watch mode in your launch configuration and you want to\n make changes to your application and rebuild and redeploy the application,\n click the Cloud Code status bar and then click\n **Turn on watch mode**.\n\n9. If you want to inspect variables and stack info, use the\n [Debug Sidebar](https://code.visualstudio.com/Docs/editor/debugging).\n To interact with the debugging session, use the\n [Debug Console](https://code.visualstudio.com/Docs/editor/debugging#_debug-console-repl)\n in the bottom pane debugger.\n\n10. To stop your deployment, click the **Stop** button in the action bar for your\n current deployment.\n\n### Troubleshoot container-building issues\n\nIf you're getting the `BUILD_DOCKER_UNKNOWN` error code, this indicates a\nproblem with Docker. To resolve this issue, perform one or more of the following\ntasks:\n\n- Restart Docker and try building the container again.\n\n- If you're still getting the same error after restarting, Docker could be\n running out of disk space. To learn more about cleaning up unused objects in\n Docker, see [Prune unused Docker objects](https://docs.docker.com/config/pruning/#prune-unused-docker-objects).\n\n- Try Docker's [Disk Usage](https://hub.docker.com/extensions/docker/disk-usage-extension)\n extension to help reclaim space.\n\nConfiguration details\n---------------------\n\nCloud Code handles the following language-specific configuration\ndetails: \n\n### Node.js\n\nRewriting the entrypoint to invoke:\n\n`node --inspect=localhost:9229`\n\n### Python\n\nInstalling the `ptvsd` module using an Init Container and rewriting the\nentrypoint to invoke:\n\n`python -m ptvsd --host localhost --port 5678`\n\n### Go\n\nInstalling the\n[`dlv` debugger](https://github.com/go-delve/delve/blob/master/Documentation/usage/dlv.md)\nusing an Init Container and rewriting the entrypoint such that the launched\ndebug session runs with a debug server only (in headless mode), continues the\ndebugged process on start, accepts multiple client connections, and listens at\n`localhost:56268`:\n\n`dlv exec --headless --continue --accept-multiclient --listen=localhost:56268 --api-version=2, \u003capp\u003e --`\n\n### Java\n\nAdding an environment `JAVA_TOOLS_OPTIONS` with the appropriate Java Debug\nWire Protocol (JDWP) configuration such that the JDWP debugging agent listens\nfor a socket connection on port 5005 and allows the VM to begin executing\nbefore the debugger is attached:\n\n`jdwp=transport=dt_socket,server=y,suspend=n,address=5005,quiet=y`\n\n### .NET\n\n.NET Core applications are configured to be deployed along with `vsdbg` for VS\nCode.\n\nIf you encounter problems with the automatic configuration, see\n[Detailed debugger configuration and setup](https://skaffold.dev/docs/workflows/debug/#detailed-debugger-configuration-and-setup)\nfor help troubleshooting.\n\nGet Support\n-----------\n\nTo send feedback, report issues on [GitHub](https://github.com/GoogleCloudPlatform/cloud-code-vscode/issues), or ask a question on [Stack Overflow](https://stackoverflow.com/questions/ask?tags=cloud-code-vscode)."]]