BigQuery Admin reference guide: Monitoring

Jignesh Mehta
Customer Engineer, Data Analytics
Vrishali Shah
Strategic Cloud Engineer, Data Analytics
Last week, we shared information on BigQuery APIs and how to use them, along with another blog on workload management best practices. This blog focuses on effectively monitoring BigQuery usage and related metrics to operationalize workload management we discussed so far.
Monitoring Options for BigQuery Resource
BigQuery Monitoring Best Practices
Visualization Options For Decision Making
Tips on Key Monitoring Metrics
Monitoring options for BigQuery
Analyzing and monitoring BigQuery usage is critical for businesses for overall cost optimization and performance reporting. BigQuery provides its native admin panel with overview metrics for monitoring. BigQuery is also well integrated with existing GCP services like Cloud Logging to provide detailed logs of individual events and Cloud Monitoring dashboards for analytics, reporting and alerting on BigQuery usage and events.
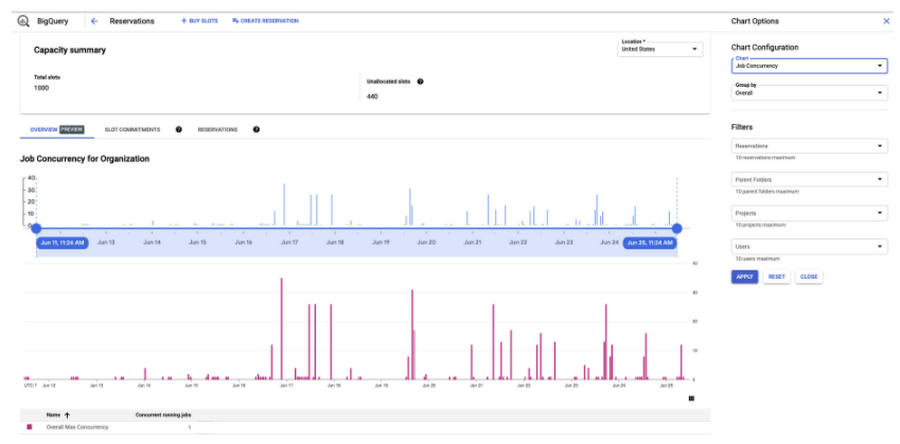
BigQuery Admin Panel
BigQuery natively provides an admin panel with overview metrics. This feature is currently in preview and only available for flat-rate customers within the Admin Project. This option is useful for organization administrators to analyze and monitor slot usage and overall performance at the organization, folder and project levels. Admin panel provides real time data for historical analysis and is recommended for capacity planning at the organization level. However, it only provides metrics for query jobs. Also, the history is only available for up to 14 days.

Cloud Monitoring
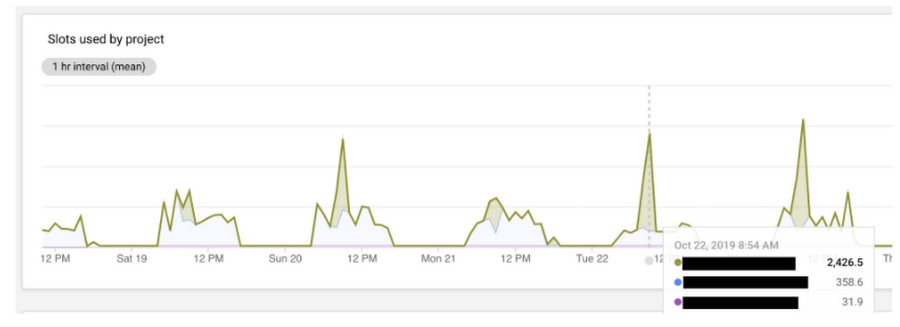
Users can create custom monitoring dashboards for their projects using Cloud Monitoring. This provides high-level monitoring metrics, and options for alerting on key metrics and automated report exports. There is a subset of metrics that are particularly relevant to BigQuery including slots allocated, total slots available, slots available by job, etc. Cloud Monitoring also has a limit of 375 projects that can be monitored per workspace (as of August 2021). This limit can be increased upon request. Finally, there is limited information about reservations in this view and no side by side information about the current reservations and assignments.

Audit logs
Google Cloud Audit logs provide information regarding admin activities, system changes, data access and data updates to comply with security and compliance needs. The BigQuery data activities logs, provide the following key metrics:
query - The BigQuery SQL executed
startTime - Time when the job started
endTime - Time when the job ended
totalProcessedBytes - Total bytes processed for a job
totalBilledBytes - Processed bytes, adjusted by the job's CPU usage
totalSlotMs - The total slot time consumed by the query job
referencedFields - The columns of the underlying table that were accessed


Users can set up an aggregated logs sink at organization, folder or project level to get all the BigQuery related logs:
Other Filters:
Logs from Data Transfer Service
protoPayload.serviceName=bigquerydatatransfer.googleapis.com
Logs from BigQuery Reservations API
protoPayload.serviceName=bigqueryreservation.googleapis.com
INFORMATION_SCHEMA VIEWS
BigQuery provides a set of INFORMATION_SCHEMA views secured for different roles to quickly get access to BigQuery jobs stats and related metadata. These views (also known as system tables) are partitioned and clustered for faster extraction of metadata and are updated in real-time. With the right set of permission and access level a user can monitor/review jobs information at user, project, folder and organization level. These views allow users to:
Create customized dashboards by connecting to any BI tool
Quickly aggregate data across many dimensions such as user, project, reservation, etc.
Drill down into jobs to analyze total cost and time spent per stage
See holistic view of the entire organization
For example, the following query provides information about the top 2 jobs in the project with details on job id, user and bytes processed by each job.


Data Studio
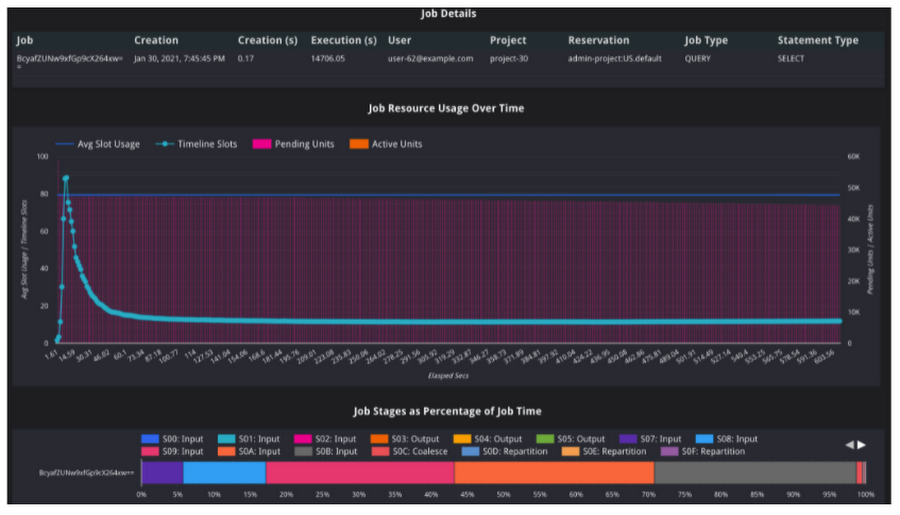
Leverage these easy to set up public Data Studio dashboards for monitoring slot and reservation usages, query troubleshooting, load slot estimations, error reporting, etc. Check out this blog for more details on performance troubleshooting using Data Studio.

Looker
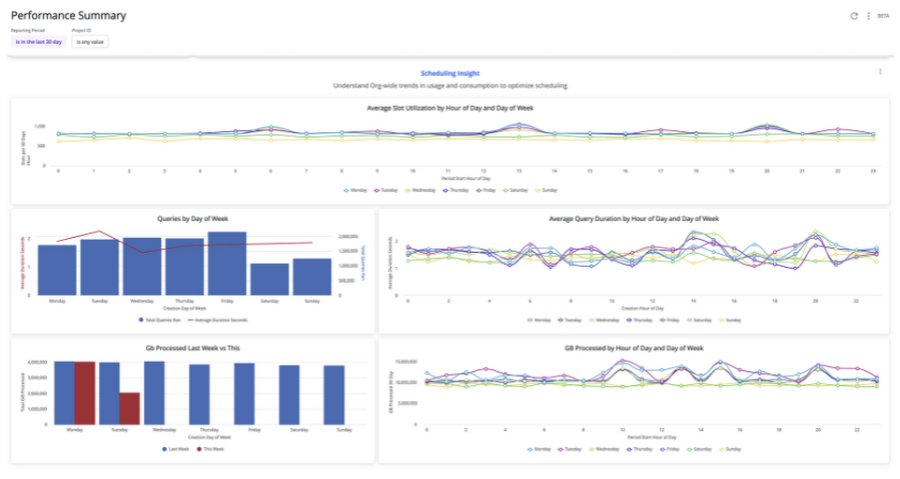
Looker marketplace provides BigQuery Performance Monitoring Block for monitoring BigQuery usage. Check out this blog for more details on performance monitoring using Looker.

Monitoring best practices
Key metrics to monitor
Typical questions administrator or workload owners would like to understand are:
What is my slots utilization for a given project?
How much data scan and processing takes place during a given day or an hour?
How many users are running jobs concurrently?
How is performance and throughout changing over the time?
How can I appropriately perform cost analysis for showback and chargeback?
One of the most demanding analyses is to understand how many slots are good for a given workload i.e. do we need more or less slots as workload patterns change?
Below is a list of key metrics and trends to observe for better decision making on BigQuery resources:
Monitor slot usage and performance trends (week over week, month over month). Correlate trends with any workload pattern changes, for example:
Are more users being onboarded within the same slot allocation?
Are new workloads being enabled with the same slot allocation?
You may want to allocate more slots if you see:
Concurrency - consistently increasing
Throughput - consistently decreasing
Slot Utilization - consistently increasing or keeping beyond 90%
If slot utilization has spikes, are they on a regular frequency?
In this case, you may want to leverage flex slots for predictable spikes
Can some non-critical workloads be time shifted?
For a given set of jobs with the same priority, e.g. for a specific group of queries or users:
Avg. Wait Time - consistently increasing
Avg. query run-time - consistently increasing
Concurrency and throughput
Concurrency is the number of queries that can run in parallel with the desired level of performance, for a set of fixed resources. In contrast, throughput is the number of completed queries for a given time duration and a fixed set of resources.
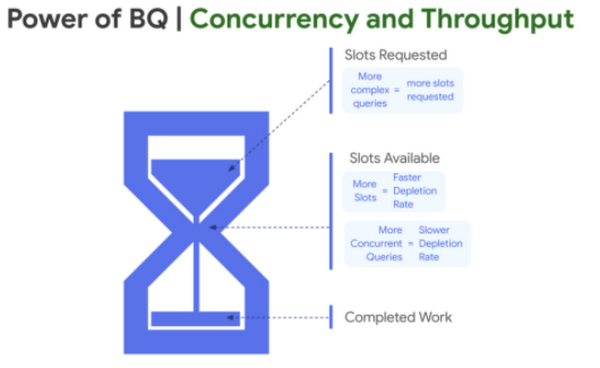

In the blog BigQuery workload management best practices, we discussed in detail on how BigQuery leverages dynamic slot allocation at each step of the query processing. The chart above reflects the slot replenishment process with respect to concurrency and throughput. More complex queries may require more number of slots, hence fewer available slots for other queries. If there is a requirement for a certain level of concurrency and minimum run-time, increased slot capacity may be required. In contrast, simple and smaller queries gives you faster replenishment of slots, hence high throughput to start with for a given workload. Learn more about BiqQuery’s fair scheduling and query processing in detail.
Slot utilization rate
Slot utilization rate is a ratio of slots used over total available slots capacity for a given period of time. This provides a window of opportunities for workload optimization. So, you may want to dig into the utilization rate of available slots over a period. If you see that on an average a low percentage of available slots are being used during a certain hour, then you may add more scheduled jobs within that hour to further utilize your available capacity. On the other hand, high utilization rate means that either you should move some scheduled workloads to different hours or purchase more slots.
For example:
Given a 500 slot reservation (capacity), the following query can be used to find total_slot_ms over a period of time:
Lets say, we have the following results from the query above:
- sum(total_slot_ms) for a given second is 453,708 ms
- sum(total_slot_ms) for a given hour is 1,350,964,880 ms
- sum(total_slot_ms) for a given day is 27,110,589,760 ms
Therefore, slot utilization rate can be calculated using the following formula:
- Slot Utilization = sum(total_slot_ms) / slot capacity available in ms
- By second: 453,708 / (500 * 1000) = 0.9074 => 90.74%
- By hour: 1,350,964,880/(500 * 1000 * 60 * 60) = 0.7505 => 75.05%
- By day: 27,110,589,760 / (500 * 1000 * 60 * 60 * 24) = 0.6276 => 62.76%
Another common metric used to understand slot usage patterns is to look at the average slot time consumed over a period for a specific job or workloads tied to a specific reservation.
Average slot usage over a period: Highly relevant for workload with consistent usage
Metric:
SUM(total_slot_ms) / {time duration in milliseconds} => custom duration
Daily Average Usage: SUM(total_slot_ms) / (1000 * 60 * 60 * 24) => for a given day
Example Query:
- Average slot usage for an individual job: Job level statistics
Average slot utilization over a specific time period is useful to monitor trends, help understand how slot usage patterns are changing or if there is a notable change in a workload. You can find more details about trends in the ‘Take Action’ section below. Average slot usage for an individual job is useful to understand query-run time estimates, to identify outlier queries and to estimate slots capacity during capacity planning.
Chargeback
As more users and projects are onboarded with BigQuery, it is important for administrators to not only monitor and alert on resource utilization, but also help users and groups to efficiently manage cost+performance. Many organizations require that individual project owners be responsible for resource management and optimization. Hence, it is important to provide reporting at a project-level that summarizes costs and resources for the decision makers.
Below is an example of a reference architecture that enables comprehensive reporting, leveraging audit logs, INFORMATION_SCHEMA and billing data. The architecture highlights persona based reporting for admin and individual users or groups by leveraging authorized view based access to datasets within a monitoring project.
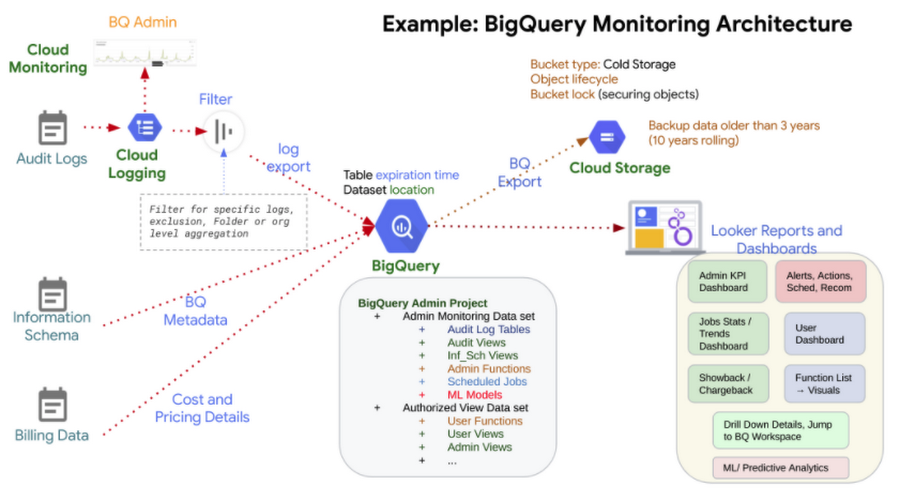

Export audit log data to BigQuery with specific resources you need (in this example for the BigQuery). You can also export aggregated data at organization level.
The INFORMATION_SCHEMA provides BigQuery metadata and job execution details for the last six months. You may want to persist relevant information for your reporting into a BigQuery dataset.
Export billing data to BigQuery for cost analysis and spend optimization.
With BigQuery, leverage security settings such as authorized views to provide separation of data access by project or by persona for admins vs. users.
Analysis and reporting dashboards built with visual tools such as Looker represent the data from BigQuery dataset(s) created for monitoring. In the chart above, examples of dashboards include:
Key KPIs for admins such as usage trend or spend trends
Data governance and access reports
Showback/Chargeback by projects
Job level statistics
User dashboards with relevant metrics such as query stats, data access stats and job performance
Billing monitoring
To operationalize showback or chargeback reporting, cost metrics are important to monitor and include in your reporting application. BigQuery billing is associated at project level as an accounting entity. Google Cloud billing reports help you understand trends and protect your resource costs and help answer questions such as:
What is my BigQuery project cost this month?
What is the cost trend for a resource with a specific label?
What is my forecasted future cost based on historical trends for a BigQuery project?
You can refer to these examples to get started with billing reports and understand what metrics to monitor. Additionally, you can export billing and audit metrics to BigQuery dataset for comprehensive analysis with resource monitoring.
As a best practice, monitoring trends is important to optimize spend on cloud resources. This article provides a visualization option with Looker to monitor trends. You can take advantage of readily available Looker block to deploy spend analytics and block for audit data visualization for your projects and, today!
When to use
The following tables provide guidance on using the right tool for monitoring based on the feature requirements and use cases.
Following features can be considered in choosing the mechanism to use for BigQuery monitoring:
- Integration with BigQuery INFORMATION_SCHMA - Leverage the data from information schema for monitoring
- Integration with other data sources - Join this data with other sources like business metadata, budgets stored in google sheets, etc.
- Monitoring at Org Level - Monitor all the organization’s projects together
- Data/Filter based Alerts - Alert on specific filters or data selection in the dashboard. For example, send alerts for a chart filtered by a specific project or reservation.
- User based Alerts - Alert for specific user
- On-demand Report Exports - Export the report as PDF, CSV, etc.
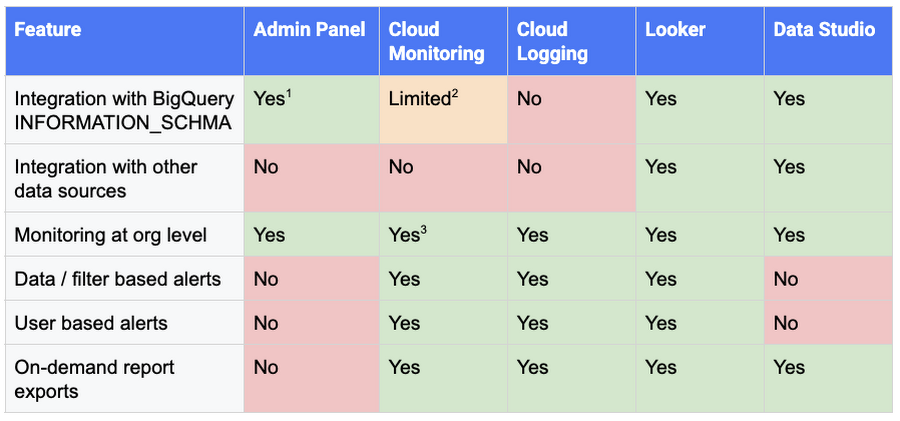

1 BigQuery Admin Panel uses INFORMATION SCHEMA under the hood.
2 Cloud monitoring provides only limited integration as it surfaces only high-level metrics.
3 You can monitor up to 375 projects at a time in a single Cloud Monitoring workspace.
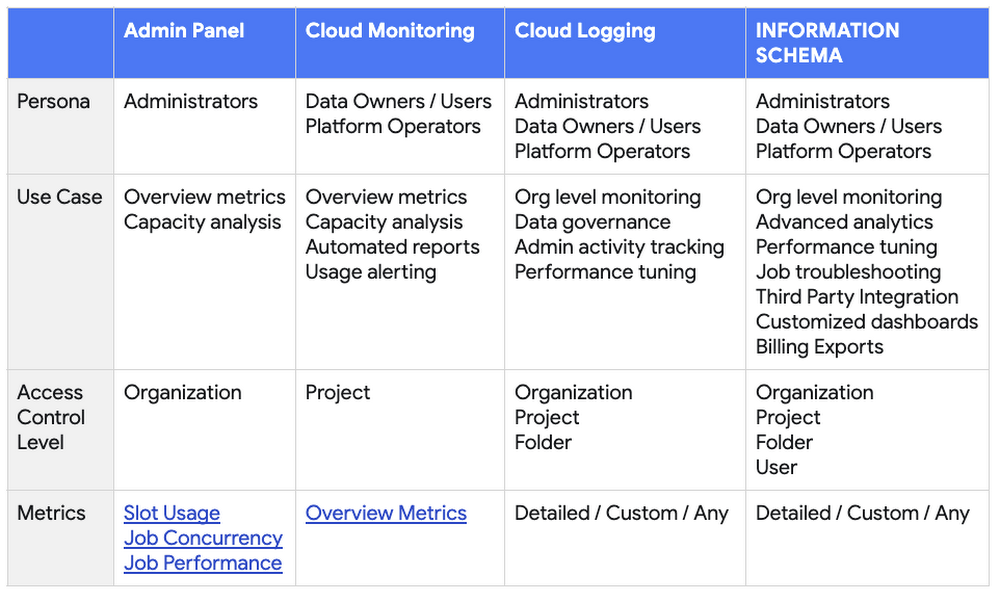
BigQuery monitoring is important across different use cases and personas in the organization.
Personas
Administrators - Primarily concerned with secure operations and health of the GCP fleet of resources. For example, SREs
Platform Operators - Often run the platform that serves internal customers. For example, Data Platform Leads
Data Owners / Users - Develop and operate applications, and manage a system that generates source data. This persona is mostly concerned with their specific workloads. For example, Developers
The following table provides guidance on the right tool to use for your specific requirements:

Take action
To get started quickly with monitoring on BigQuery, you can leverage publicly available data studio dashboard and related github resources. Looker also provides BigQuery Performance Monitoring Block for monitoring BigQuery usage. To quickly deploy billing monitoring with GCP, see reference blog and related github resources.
The key to successful monitoring is to enable proactive alerts. For example, setting up alerts when the reservation slot utilization rate crosses a predetermined threshold. Also, it’s important to enable the individual users and teams in the organization to monitor their workloads using a self-service analytics framework or dashboard. This allows the users to monitor trends for forecasting resource needs and troubleshoot overall performance.
Below are additional examples of monitoring dashboards and metrics:
Organization Admin Reporting (proactive monitoring)
Alert based on thresholds like 90% slot utilization rate
Regular reviews of consuming projects
Monitor for seasonal peaks
Review jobs metadata from information schema for large queries using total_bytes_processed and total_slot_ms metrics
Develop data slice and dice strategies in the dashboard for appropriate chargeback
Leverage audit logs for data governance and access reporting
Specific Data Owner Reporting (self-service capabilities)
Monitor for large queries executed in the last X hours
Troubleshoot job performance using concurrency, slots used and time spent per job stage, etc.
Develop error reports and alert on critical job failures
Understand and leverage INFORMATION_SCHEMA for real-time reports and alerts. Review more examples on job stats and technical deep-dive INFORMATION_SCHEMA explained with this blog.

