BigQuery Admin reference guide: Query processing

Leigha Jarett
Developer Advocate, Looker at Google Cloud
Seth Hollyman
Developer Relations Engineer, BigQuery
BigQuery is capable of some truly impressive feats, be it scanning billions of rows based on a regular expression, joining large tables, or completing complex ETL tasks with just a SQL query. One advantage of BigQuery (and SQL in general), is it’s declarative nature. Your SQL indicates your requirements, but the system is responsible for figuring out how to satisfy that request.
However, this approach also has its flaws - namely the problem of understanding intent. SQL represents a conversation between the author and the recipient (BigQuery, in this case). And factors such as fluency and translation can drastically affect how faithfully an author can encode their intent, and how effectively BigQuery can convert the query into a response.
In this week’s BigQuery Admin Reference Guide post, we’ll be providing a more in depth view of query processing. Our hope is that this information will help developers integrating with BigQuery, practitioners looking to optimize queries, and administrators seeking guidance to understand how reservations and slots impact query performance.
A refresher on architecture
Before we go into an overview of query processing. Let’s revisit BigQuery’s architecture. Last week, we spoke about BigQuery’s native storage on the left hand side. Today, we’ll be focusing on Dremel, BigQuery’s query engine. Note that today we’re talking about BigQuery’s standard execution engine, however BI Engine represents another query execution engine available for fast, in-memory analysis.
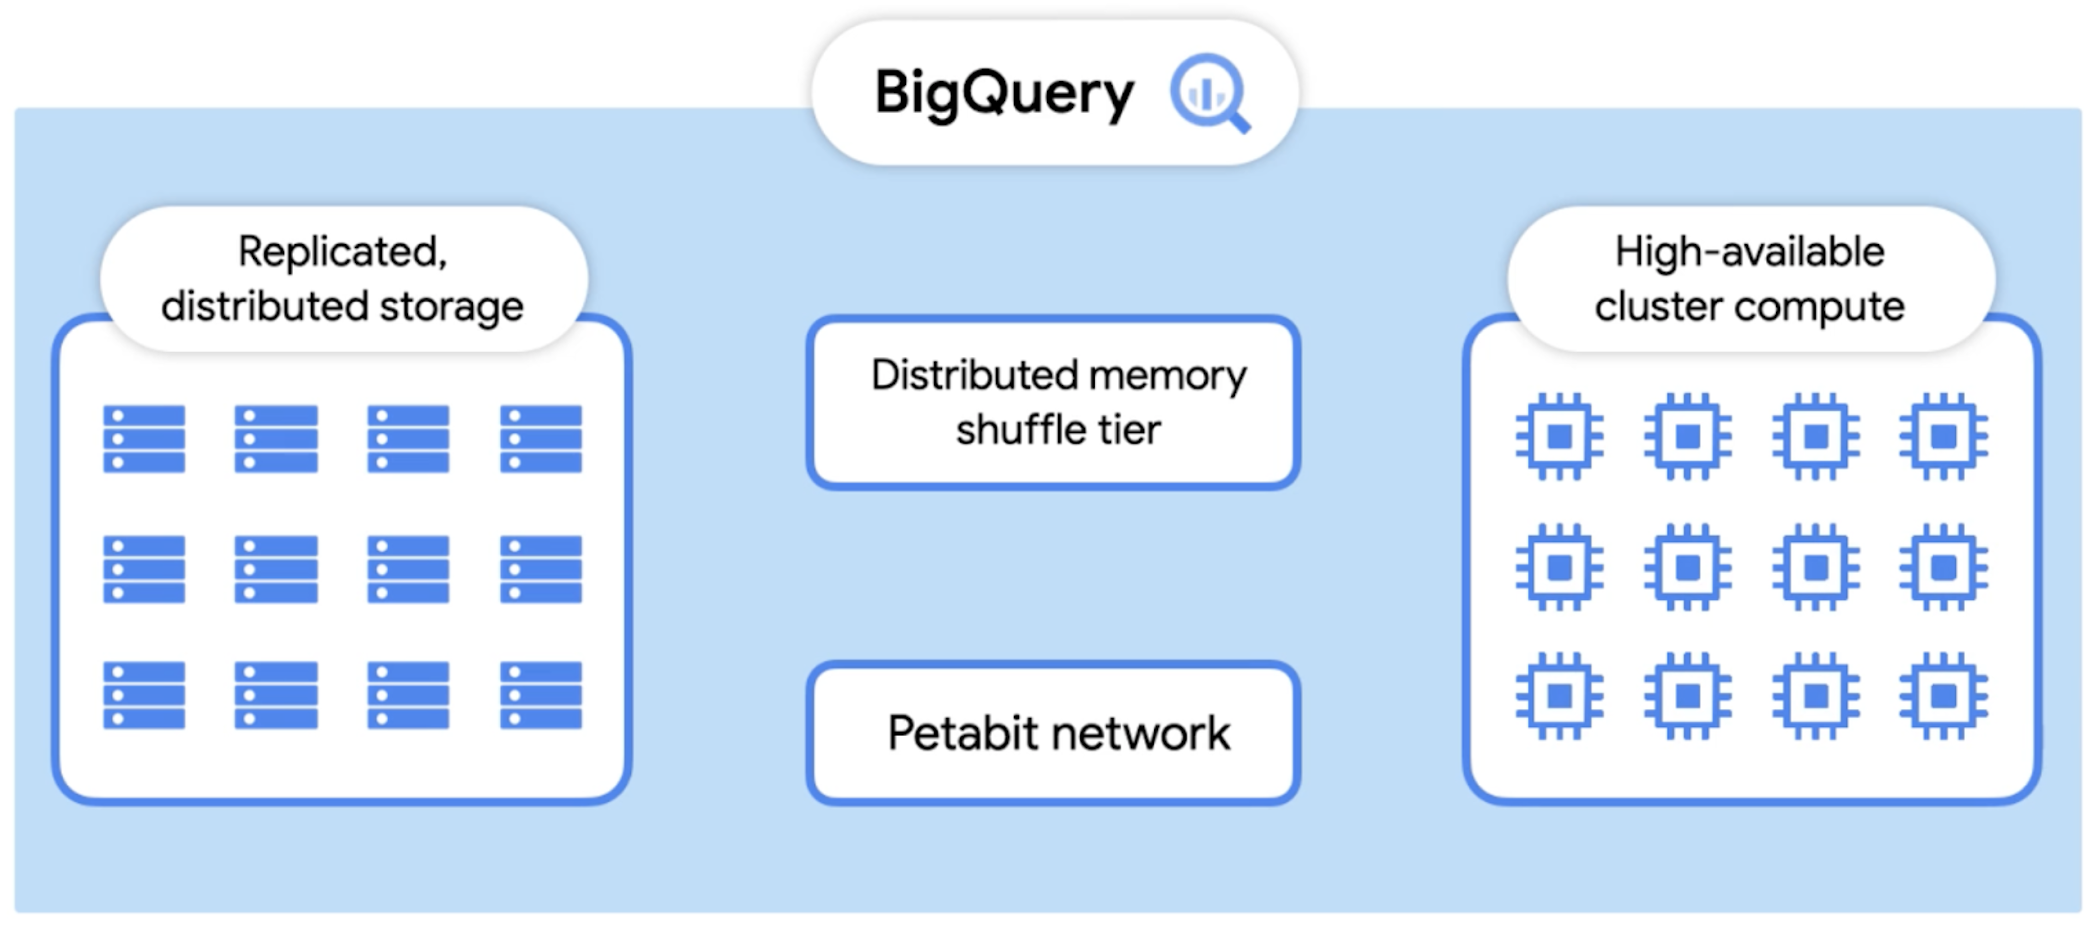

As you can see from the diagram, dremel is made up of a cluster of workers. Each one of these workers executes a part of a task independently and in parallel. BigQuery uses a distributed memory shuffle tier to store intermediate data produced from workers at various stages of execution. The shuffle leverages some fairly interesting Google technologies, such as our very fast petabit network technology, and RAM wherever possible. Each shuffled row can be consumed by workers as soon as it’s created by the producers.
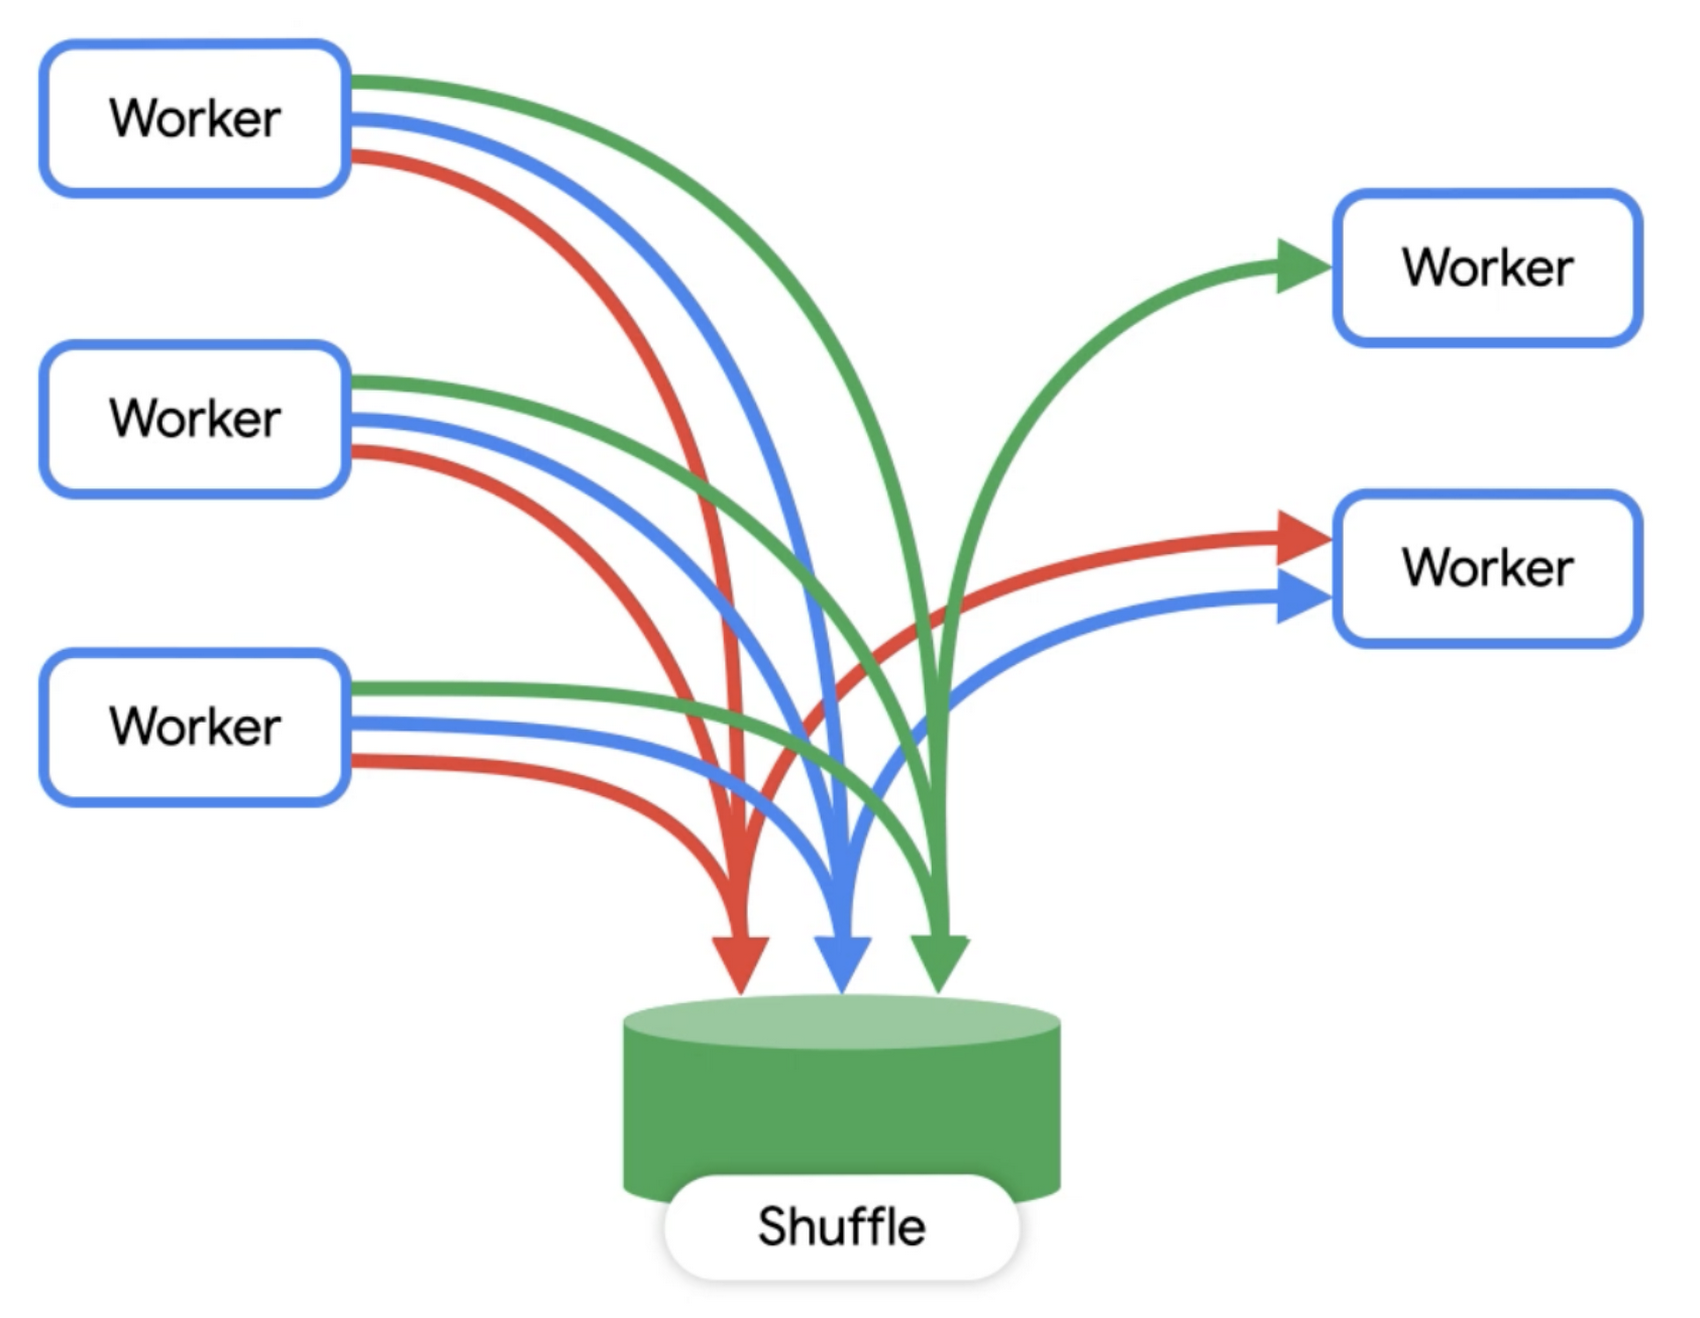

This makes it possible to execute distributed operations in a pipeline. Additionally, if a worker has partially written some of its output and then terminated (for example, the underlying hardware suffered a power event), that unit of work can simply be re-queued and sent to another worker. A failure of a single worker in a stage doesn't mean all the workers need to re-run.
When a query is complete, the results are written out to persistent storage and returned to the user. This also enables us to serve up cached results the next time that query executes.
Overview of query processing
Now that you understand the query processing architecture, we’ll run through query execution at a high level, to see how each step comes together.
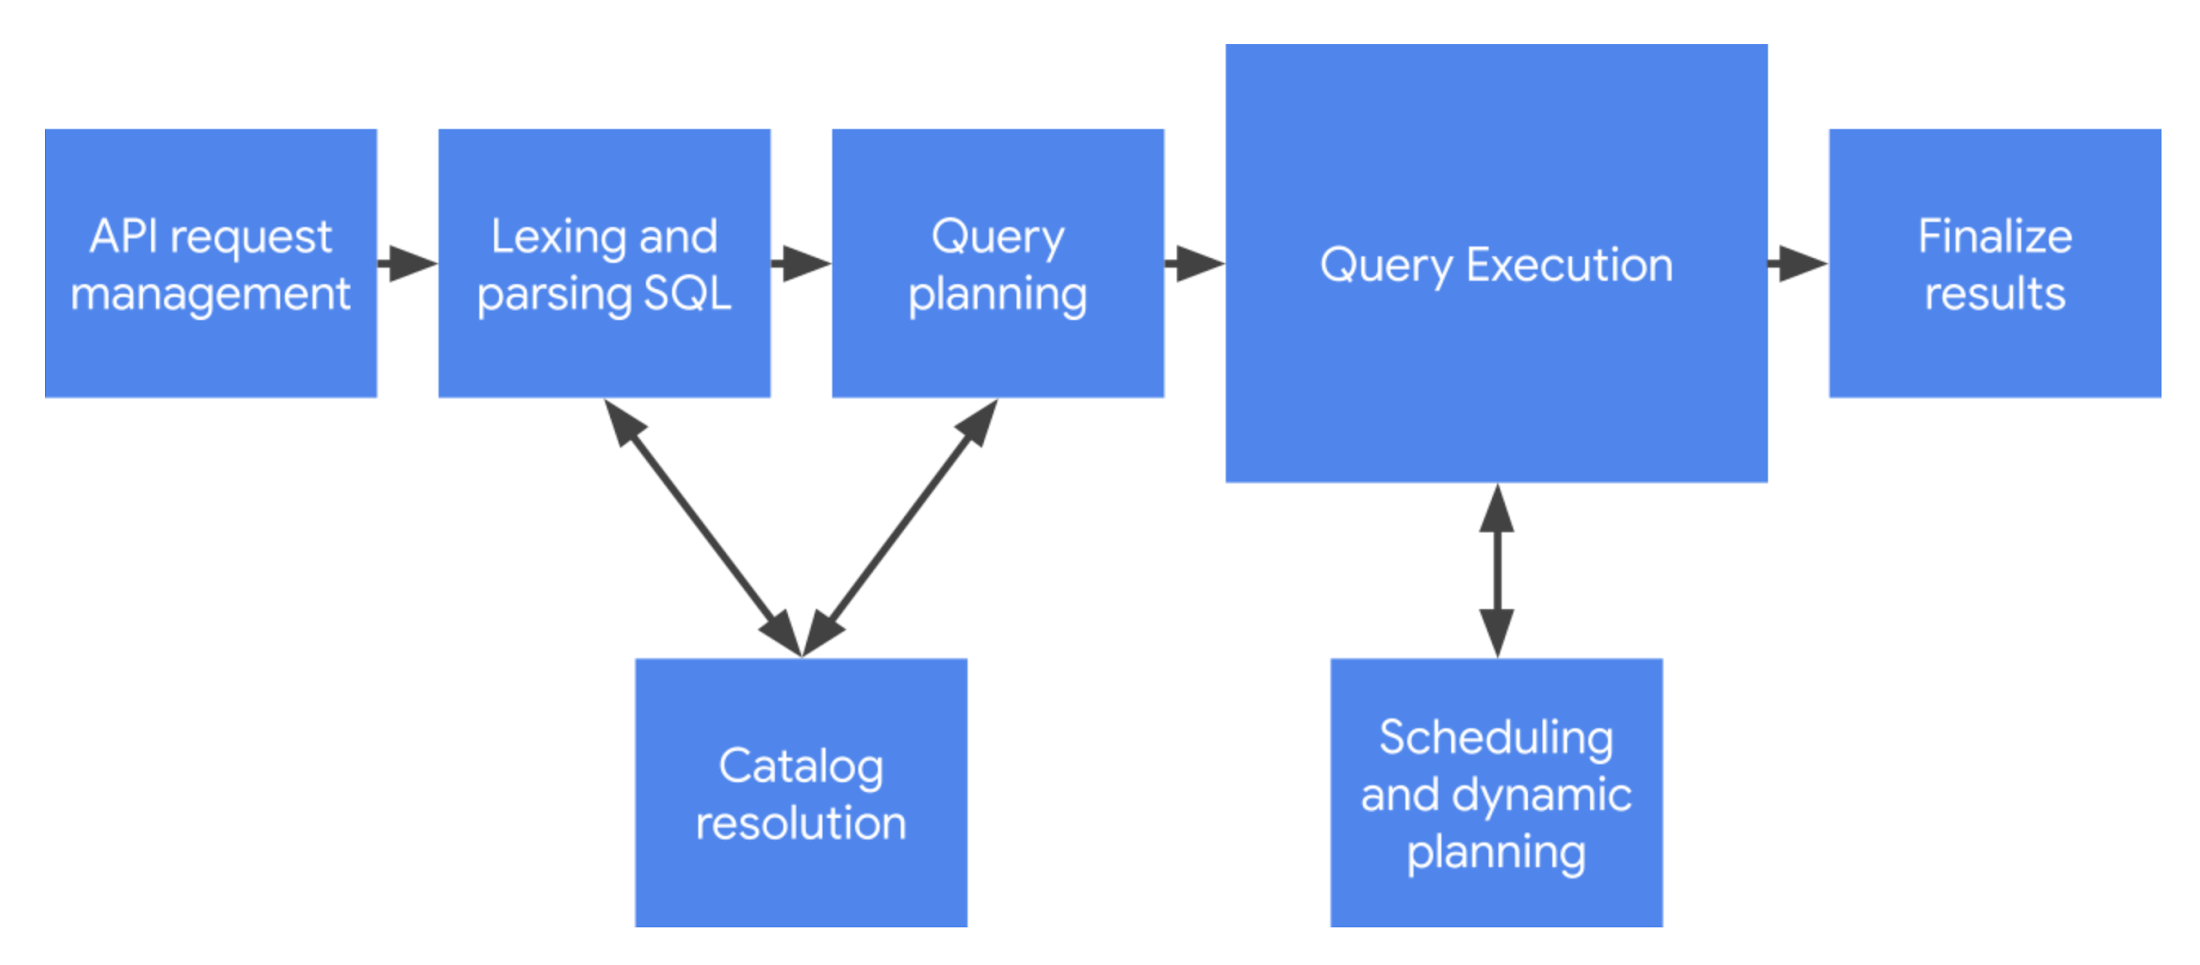

First Steps: API request management
BigQuery supports an asynchronous API for executing queries: callers can insert a query job request, and then poll it until complete - as we discussed a few weeks ago. BigQuery supports a REST-based protocol for this, which accepts queries encoded via JSON.
To proceed, there’s some level of API processing that must occur. Some of things that must be done are authenticating and authorizing the request, plus building and tracking associated metadata such as the SQL statement, cloud project, and/or query parameters.
Decoding the query text: Lexing and parsing
Lexing and parsing is a common task for programming languages, and SQL is no different. Lexing refers to the process of scanning an array of bytes (the raw SQL statement) and converting that into a series of tokens. Parsing is the process of consuming those tokens to build up a syntactical representation of the query that can be validated and understood by BigQuery’s software architecture.
If you're super interested in this, we recommend checking out the ZetaSQL project, which includes the open source reference implementation of the SQL engine used by BigQuery and other GCP projects.
Referencing resources: Catalog resolution
SQL commonly contains references to entities retained by the BigQuery system - such as tables, views, stored procedures and functions. For BigQuery to process these references, it must resolve them into something more comprehensible. This stage helps the query processing system answer questions like:
Is this a valid identifier? What does it reference?
Is this entity a managed table, or a logical view?
What’s the SQL definition for this logical view?
What columns and data types are present in this table?
How do I read the data present in the table? Is there a set of URIs I should consume?
Resolutions are often interleaved through the parsing and planning phases of query execution.
Building a blueprint: Query planning
As a more fully-formed picture of the request is exposed via parsing and resolution, a query plan begins to emerge. Many techniques exist to refactor and improve a query plan to make it faster and more efficient. Algebraization, for example, converts the parse tree into a form that makes it possible to refactor and simplify subqueries. Other techniques can be used to optimize things further, moving tasks like pruning data closer to data reads (reducing the overall work of the system).
Another element is adapting it to run as a set of distributed execution tasks. Like we mentioned in the beginning of this post, BigQuery leverages large pools of query computation nodes, or workers. So, it must coordinate how different stages of the query plan share data through reading and writing from storage, and how to stage temporary data within the shuffle system.
Doing the work: Query execution
Query execution is simply the process of working through the query stages in the execution graph, towards completion. A query stage may have a single unit of work, or it may be represented by many thousands of units of work, like when a query stage reads all the data in a large table composed of many separate columnar input files.
Query management: scheduling and dynamic planning
Besides the workers that perform the work of the query plan itself, additional workers monitor and direct the overall progress of work throughout the system. Scheduling is concerned with how aggressively work is queued, executed and completed.
However, an interesting property of the BigQuery query engine is that it has dynamic planning capabilities. A query plan often contains ambiguities, and as a query progresses it may need further adjustment to ensure success. Repartitioning data as it flows through the system is one example of a plan adaptation that may be added, as it helps ensure that data is properly balanced and sized for subsequent stages to consume.
Finishing up: finalizing results
As a query completes, it often yields output artifacts in the form of results, or changes to tables within the system. Finalizing results includes the work to commit these changes back to the storage layer. BigQuery also needs to communicate back to you, the user, that the system is done processing the query. The metadata around the query is updated to note the work is done, or the error stream is attached to indicate where things went wrong.
Understanding query execution
Armed with our new understanding of the life of a query, we can dive more deeply into query plans. First, let’s look at a simple plan. Here, we are running a query against a public BigQuery dataset to count the total number of citi bike trips that began at stations with “Broadway” in the name.
SELECT COUNT(*)
FROM `bigquery-public-data.new_york.citibike_trips`
WHERE start_station_name LIKE "%Broadway%"
Now let's consider what is happening behind the scenes when BigQuery processes this query.
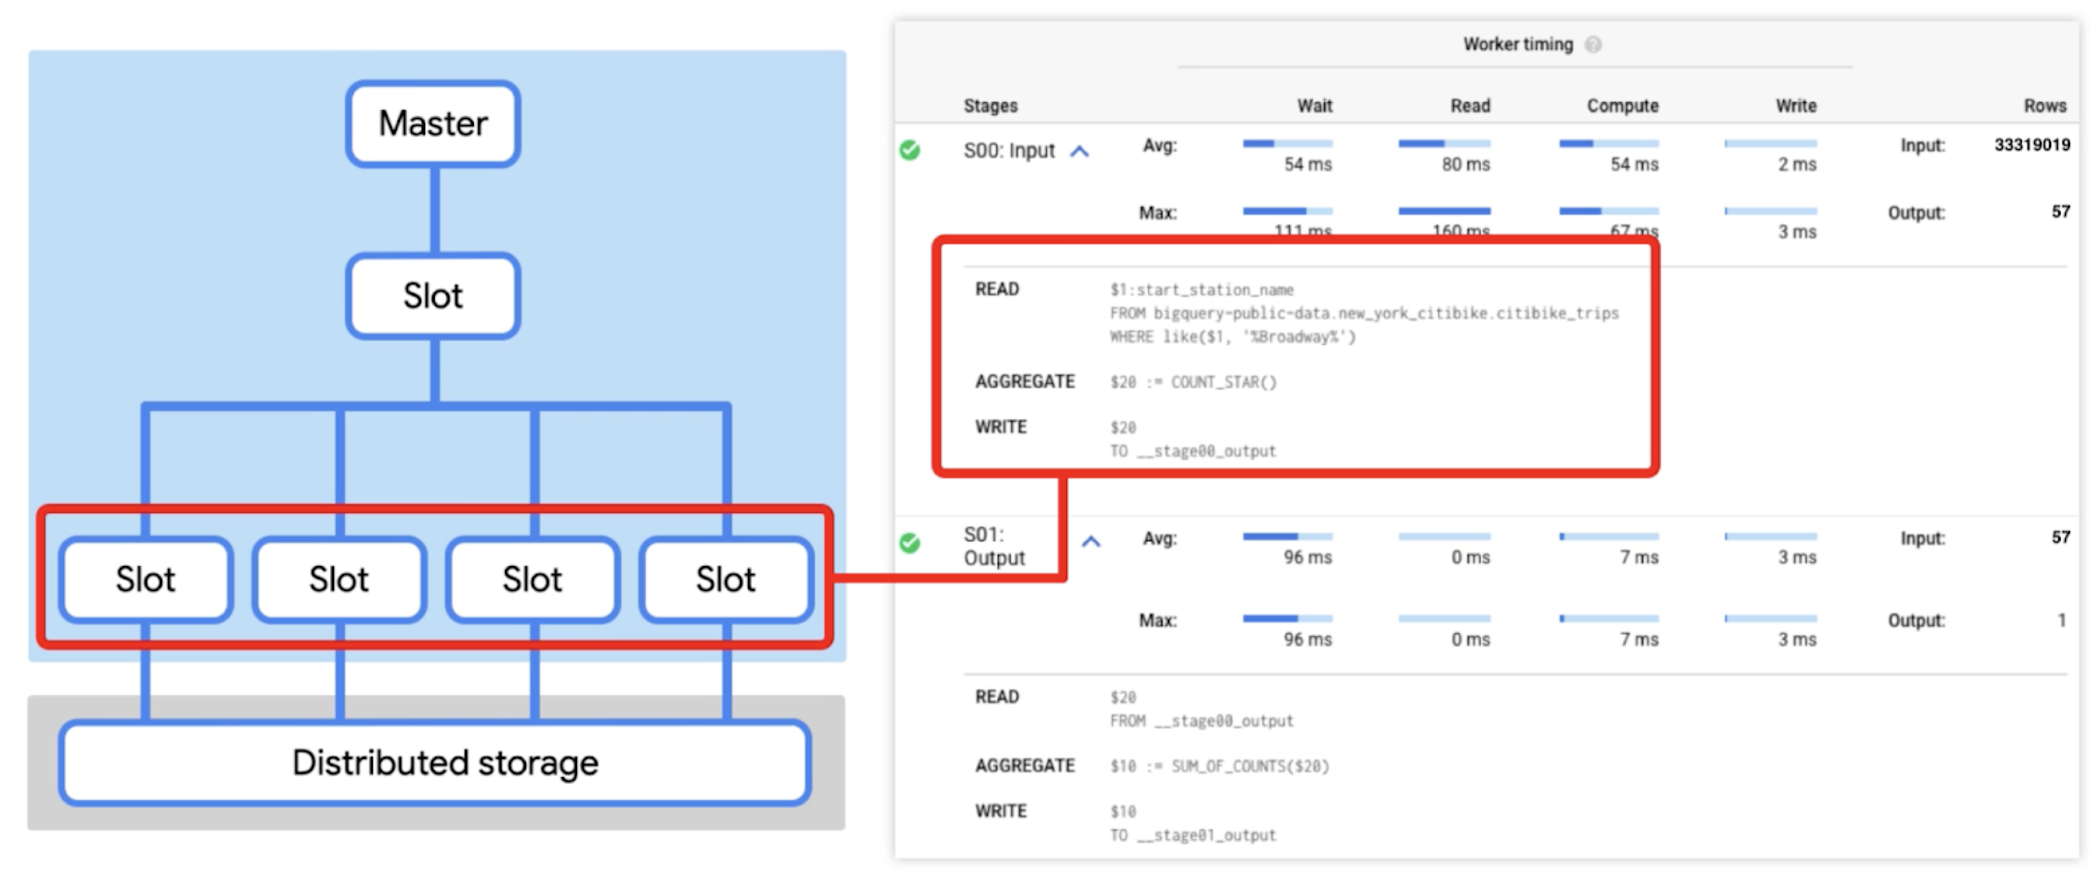
First, a set of workers access the distributed storage to read the table, filter the data, and generate partial counts. Next, these workers send their counts to the shuffle.
The second stage reads from those shuffle records as its input, and sums them together. It then writes the output file into a single file, which becomes accessible as the result of the query.
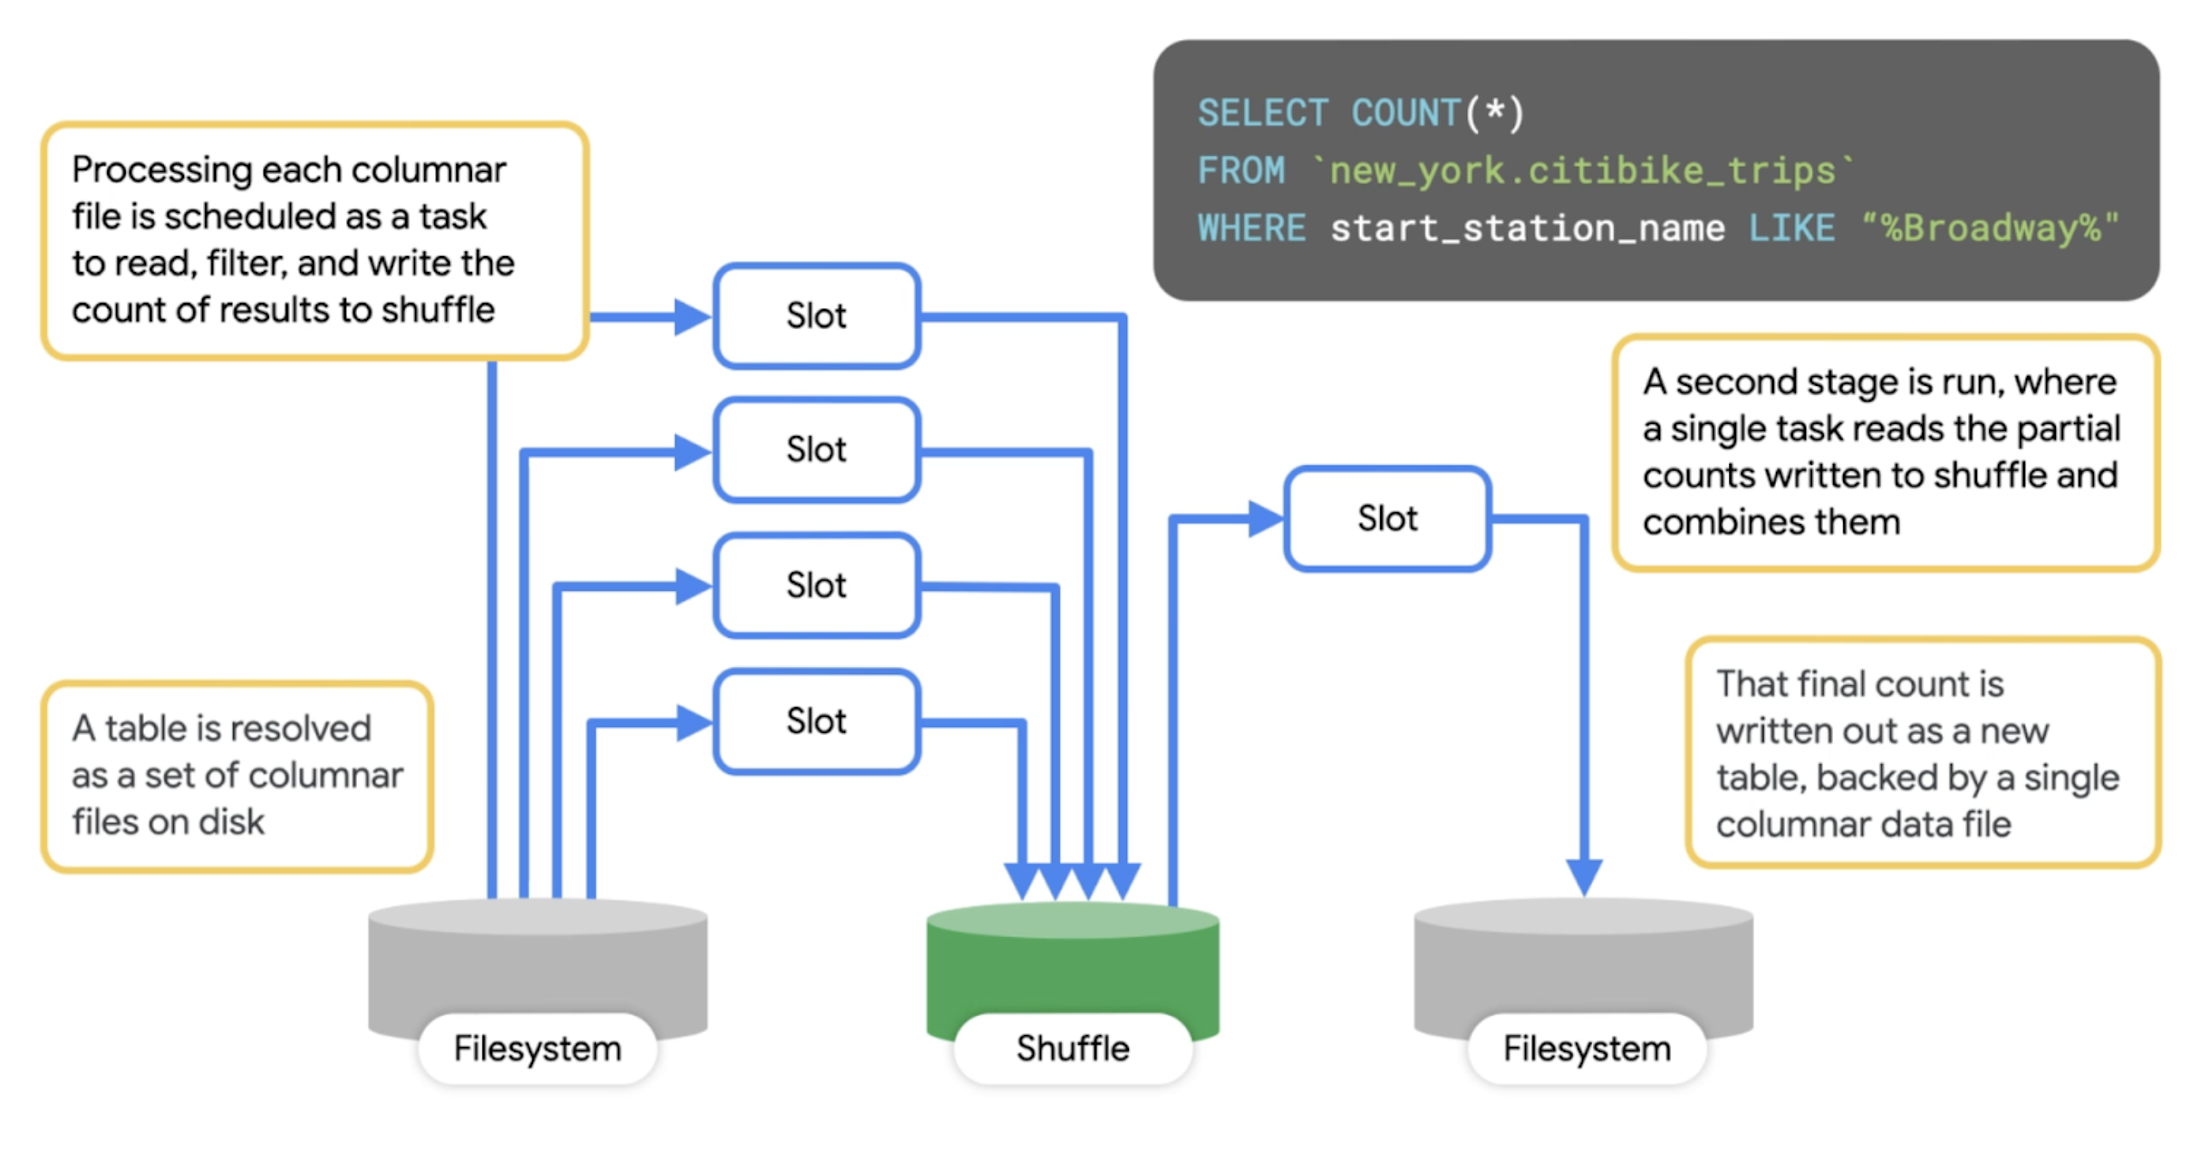

You can clearly see that the workers don't communicate directly with one another at all; they communicate through reading and writing data. After running the query in the BigQuery console, you can see the execution details and gather information about the query plan (note that the execution details shown below may be slightly different than what you see in the console since this data changes).

Note that you can also get execution details from the information_schema tables or the Jobs API. For example, by running:
SELECT
*
FROM
`region-us`.INFORMATION_SCHEMA.JOBS_BY_PROJECT
WHERE
job_id = "bquxjob_49c5bc47_17ad3d7778f"
Interpreting the query statistics
Query statistics include information about how many work units existed in a stage, as well as how many were completed. For example, inspecting the result of the information schema query used earlier we can get the following:


Input and output
Using the parallel_inputs field, we can see how finely divided the input is. In the case of a table read, it indicates how many distinct file blocks were in the input. In the case of a stage that reads from shuffle, the number of inputs tells us how many distinct data buckets are present. Each of these represent a distinct unit of work that can be scheduled independently. So, in our case, there are 57 different columnar file blocks in the table.


In this representation, we can also see the query scanned more than 33 million rows while processing the table. The second stage read 57 rows, as the shuffle system contained one row for each input from the first stage.


It's also perfectly valid for a stage to finish with only a subset of the inputs processed. Cases where this happens tend to be execution stages where not all the inputs need to be processed to satisfy what output is needed; a common example of this might be a query stage that consumes part of the input and uses a LIMIT clause to restrict the output to some smaller number of rows.
It is also worth exploring the notion of parallelism. Having 57 inputs for a stage doesn't mean the stage won't start until there's 57 workers (slots) available. It means that there's a queue of work with 57 elements to work through. You can process that queue with a single worker, in which case you've essentially got a serial execution. If you have multiple workers, you can process it faster as they're working independently to process the units. However, more than 57 slots doesn't do anything for you; the work cannot be more finely distributed.
Aside from reading from native distributed storage, and from shuffle, it's also possible for BigQuery to perform data reads and writes from external sources, such as Cloud Storage (as we discussed in our earlier post). In such cases the notion of parallel access still applies, but it’s typically less performant.
Slot utilization
BigQuery communicates resource usage through a computational unit known as a slot. It's simplest to think of it as similar to a virtual CPU and it’s a measure that represents the number of workers available / used. When we talk about slots, we're talking about overall computational throughput, or rate of change. For example, a single slot gives you the ability to make 1 slot-second of compute progress per second. As we just mentioned, having fewer workers - or less slots - doesn’t mean that a job won’t run. It simply means that it may run slower.
In the query statistics, we can see the amount of slot_ms (slot-milliseconds) consumed. If we divide this number by the amount of milliseconds it took for the query stage to execute, we can calculate how many fully saturated slots this stage represents.
SELECT job_stages.name, job_stages.slot_ms/(job_stages.end_ms - job_stages.start_ms) as full_slots
FROM
`region-us`.INFORMATION_SCHEMA.JOBS_BY_PROJECT
, UNNEST(job_stages) as job_stages
WHERE
job_id = "bquxjob_49c5bc47_17ad3d7778f"
This information is helpful, as it gives us a view of how many slots are being used on average across different workloads or projects - which can be helpful for sizing reservations (more on that soon). If you see areas where there is a higher number of parallel inputs compared to fully saturated slots, that may represent a query that will run faster if it had access to more slots.
Time spent in phases
We can also see the average and maximum time each of the workers spent in the wait, read, compute and write phase for each stage of the query execution:
Wait Phase: the engine is waiting for either workers to become available or for a previous stage to start writing results that it can begin consuming. A lot of time spent in the wait phase may indicate that more slots would result in faster processing time.
Read Phase: the slot is reading data either from distributed storage or from shuffle. A lot of time spent here indicates that there might be an opportunity to limit the amount of data consumed by the query (by limiting the result set or filtering data).
Compute Phase: where the actual processing takes place, such as evaluating SQL functions or expressions. A well-tuned query typically spends most of its time in the compute phase. Some ways to try and reduce time spent in the compute phase are to leverage approximation functions or investigate costly string manipulations like complex regexes.
Write phase: where data is written, either to the next stage, shuffle, or final output returned to the user. A lot of time spent here indicates that there might be an opportunity to limit the results of the stage (by limiting the result set or filtering data)
If you notice that the maximum time spent in each phase is much greater than the average time, there may be an uneven distribution of data coming out of the previous stage. One way to try and reduce data skew is by filtering early in the query.
Large shuffles
While many query patterns use reasonable volumes of shuffle, large queries may exhaust available shuffle resources. Particularly, if you see that a query stage is heavily attributing its time spent to writing out to shuffle, take a look at the shuffle statistics. The shuffleOutputBytesSpilled tells us if the shuffle was forced to leverage disk resources beyond in-memory resources.
SELECT job_stages.name, job_stages.shuffle_output_bytes_spilled
FROM
`region-us`.INFORMATION_SCHEMA.JOBS_BY_PROJECT
, UNNEST(job_stages) as job_stages
WHERE
job_id = "bquxjob_49c5bc47_17ad3d7778f"
Note that a disk-based write takes longer than an in-memory write. To prevent this from happening, you’ll want to filter or limit the data so that less information is passed to the shuffle.
Tune in next week
Next week, we’ll be digging into more advanced queries and talking through tactical query optimization techniques so make sure to tune in! You can keep an eye out for more in this series by following Leigha on LinkedIn and Twitter.


