Using logging for your apps running on Kubernetes Engine
Charles Baer
Product Manager, Google Cloud
Xiang Shen
Solutions Architect
Whether you’re a developer debugging an application or on the DevOps team monitoring applications across several production clusters, logs are the lifeblood of the IT organization. And if you run on top of Google Kubernetes Engine (GKE), you can use Cloud Logging, one of the many services integrated into GKE, to find that useful information.
Cloud Logging, and its companion tool Cloud Monitoring, are full featured products that are both deeply integrated into GKE. In this blog post, we’ll go over how logging works on GKE and some best practices for log collection. Then we’ll go over some common logging use cases, so you can make the most out of the extensive logging functionality built into GKE and Google Cloud Platform.
What’s included in Cloud Logging on GKE
By default, GKE clusters are natively integrated with Cloud Logging (and Monitoring). When you create a GKE cluster, both Monitoring and Cloud Logging are enabled by default. That means you get a monitoring dashboard specifically tailored for Kubernetes and your logs are sent to Cloud Logging’s dedicated, persistent datastore, and indexed for both searches and visualization in the Cloud Logs Viewer.
If you have an existing cluster with Cloud Logging and Monitoring disabled, you can still enable logging and monitoring for the cluster. That’s important because with Cloud Logging disabled, a GKE-based application temporarily writes logs to the worker node, which may be removed when a pod is removed, or overwritten when log files are rotated. Nor are these logs centrally accessible, making it difficult to troubleshoot your system or application.
In addition to cluster audit logs, and logs for the worker nodes, GKE automatically collects application logs written to either STDOUT or STDERR. If you’d prefer not to collect application logs, you can also now choose to collect only system logs. Collecting system logs are critical for production clusters as it significantly accelerates the troubleshooting process. No matter how you plan to use logs, GKE and Cloud Logging make it simple and easy–simply start your cluster, deploy your applications and your logs appear in Cloud Logging!
How GKE collects logs
GKE deploys a per-node logging agent that reads container logs, adds helpful metadata, and then sends the logs to the logs router, which sends the logs to Cloud Logging and any of the Logging sink destinations that you have configured. Cloud Logging stores logs for the duration that you specify or 30 days by default. Because Cloud Logging automatically collects standard output and error logs for containerized processes, you can start viewing your logs as soon as your application is deployed.
Where to find your logs
There are several different ways to access your logs in Logging depending on your use case. Assuming you’ve already enabled the workspace, you can access your logs using:
- Cloud Logging console – You can see your logs directly from the Cloud Logging console by using the appropriate logging filters to select the Kubernetes resources such as cluster, node, namespace, pod or container logs. Here are some sample Kubernetes-related queries to help get you started.
- GKE console – In the Kubernetes Engine section of the Google Cloud Console, select the Kubernetes resources listed in Workloads, and then the Container or Audit Logs links.
- Monitoring console – In the Kubernetes Engine section of the Monitoring console, select the appropriate cluster, nodes, pod or containers to view the associated logs.
- gcloud command line tool – Using the gcloud logging read command, select the appropriate cluster, node, pod and container logs.
For custom log aggregation, log analytics or to integrate with third-party systems, you can also use the logging sinks feature to export logs to BigQuery, Cloud Storage and Pub/Sub. For example, you can export logs to BigQuery and then use SQL queries to analyze application logs over an entire year. Or you may need to export specific logs to an existing third-party system using an integration with Pub/Sub. The best way to access your logs depends on your use case.
Logging recommendations for containerized applications
Before we dive into some typical use cases for logging in GKE, let's first review some best practices for using Cloud Logging with containerized applications:
- Use the native logging mechanisms of containers to write the logs to stdout and stderr.
- Log directly with structured logging with different fields. You can then search your logs more effectively based on those fields.
- Use severities for better filtering and reducing noise. By default, logs written to the standard output are on the INFO level and logs written to the standard error are on the ERROR level. Structured logs with JSON payload can include a severity field, which defines the log's severity.
- Use the links to the logs directly from the Kubernetes Engine section of the Cloud Console for containers which makes it quick to find the logs corresponding to the container.
- Understand the pricing, quota, and limits of Cloud Logging to understand the associated costs.
Use cases
Now, let's look at some simple yet common use cases for logs in a GKE environment: diagnosing application errors, analyzing simple log data, analyzing complex log data, and integrating Cloud Logging with third-party applications. Read on for more.
Using Cloud Logging to diagnose application errors
Imagine you’re a developer and need to diagnose an application error in a development cluster. To use a concrete example, we will work through a scenario based on a sample microservices demo app deployed to a GKE cluster. You can deploy this demo app in your own Google Cloud project or you can go through the Site Reliability Troubleshooting Qwiklab to deploy a version of this demo app that includes an error.
In the demo app, there are many microservices and dependencies among them.
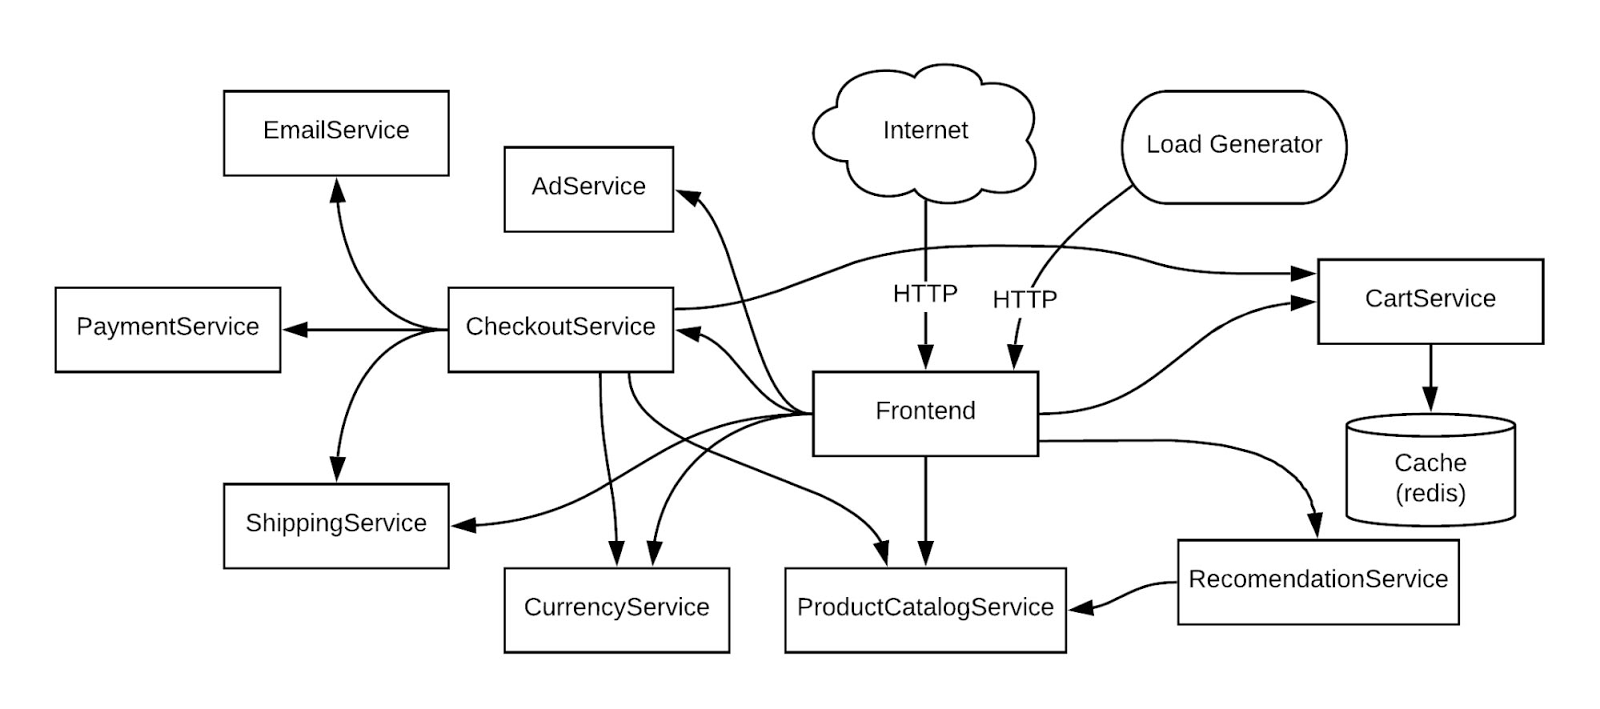

Let’s say you start receiving ‘500’ Internal Server Errors from the app when you try to place an order:


Let the debugging begin! There are two quick ways to find the logs:
1. Use the Kubernetes Engine console – Start by opening the checkout service in the Kubernetes Engine console, which has all the technical details about the serving pod, the container and links to the container and audit logs.
There, you can find the technical details about the pod along with the links for container and audit logs.
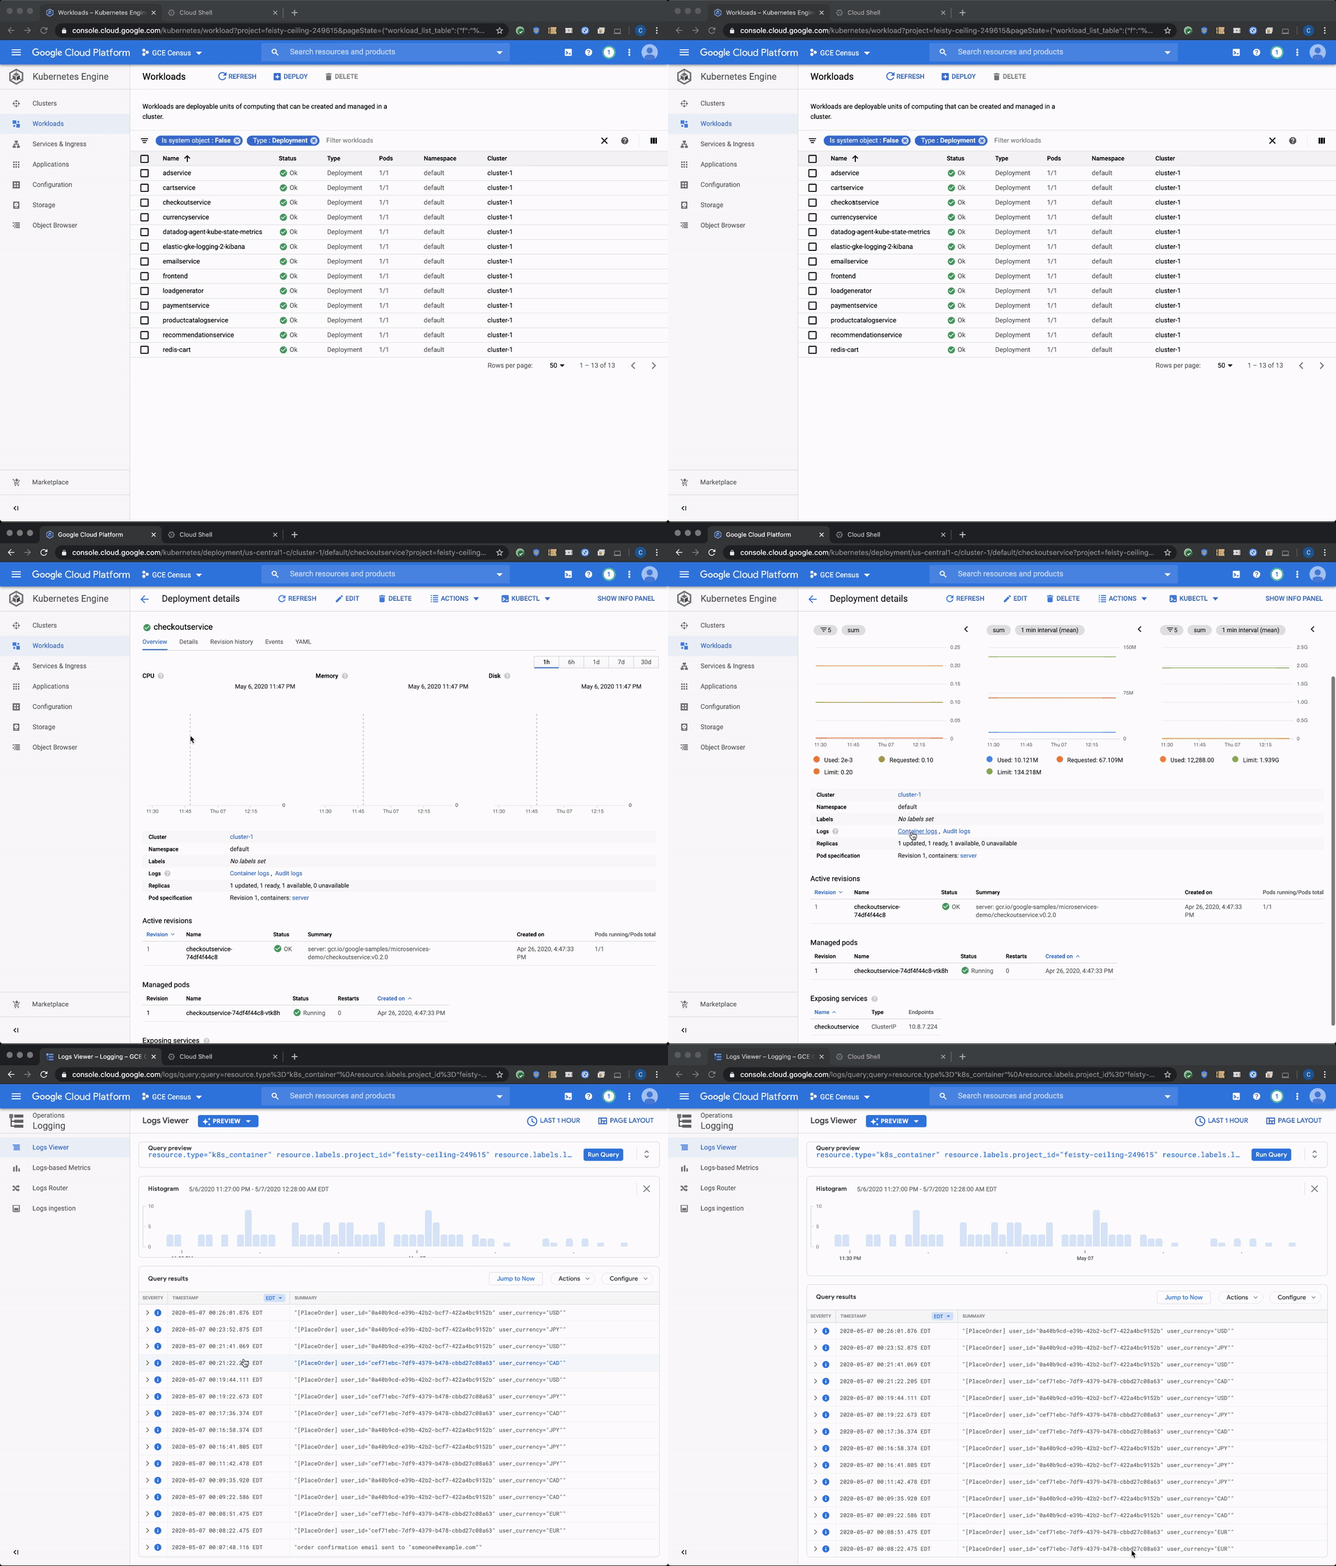

If you click the log link for the container, you will be directed to the Cloud Logging’s logs viewer with a pre-populated search query similar to the one below. This is created for you and points you to the specific container logs for the application running in the checkoutservice pod (if you experience missing labels on a heavily loaded node, please click here for details and workarounds).
2. Use the Logs Viewer in the Cloud Logging console – you can go directly to the Cloud Logging console and use the Logs Viewer to search for error messages across specific logs.
You can specify the resource types, search fields, and a time range to speed up your query (more tips here). The Logs Viewer provides both a Classic and a Preview option. The Query builder in the Logs Viewer Preview lets you specify those filtering conditions quickly. For instance, you can select the resources in the dropdown menus for the cluster, namespace, and container.


This selection in the Query Builder yields the following query:
If you are not familiar with the codebase for the app, you’ll need to do some debugging with the logs to fix the issue. One good starting point is to search for the error message in the logs to understand the context of the error. You can add the field jsonPayload.error to your query to look for the specific log message that you received. To keep your queries most efficient, make sure to include the resource.type field.
One of the helpful features included in the Preview of the Logs Viewer is a histogram, which lets you visualize the frequency of the logs matched by your query. In this example, this helps us understand how often our error appears in the logs.


Next, you can look at the specific log entries that matched the query.
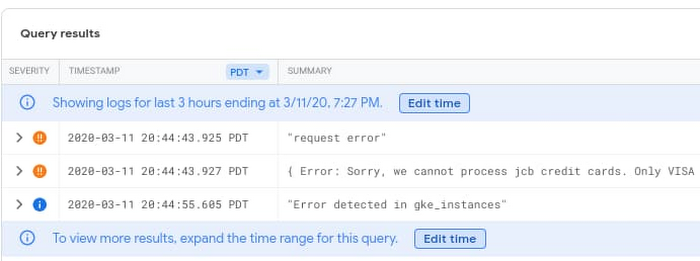

If you expand the log entries, the payment-related log entry provides you with details about the pod, container, and a stack trace of the error. The logs point to the exact location of the defective code.
Alternatively, if you prefer to use the command-line interface, you can run the same commands via Cloud Shell. Notice the conditions used in the query and the stderr log it searches.
Analyzing log data
Another common use case for logging is to analyze the log data with complex and powerful queries using built-in logging query language. You can use the query builder to build your queries or use the autocomplete to build a custom query. To find log entries quickly, you can include the exact values for the indexed log fields such as resource.type, logName and severity. Below are several example queries.
You can use this query to check if an authorized user is trying to execute a command inside a container by replacing cluster_name and location with your specific cluster’s name and zone values:
You can use this query to check if a specific user is trying to execute a command inside a container by replacing cluster_name, location and principalEmail with your specific cluster’s name, zone and email address values:
This query filters pod-related log entries within a given time period by replacing replacing cluster_name, location, pod and timestamp with your specific cluster’s name, zone, pod and time values:
You can find more sample queries for product-specific examples of querying logs across Google Cloud. You can also find specific GKE audit log query examples to help answer your audit logging questions.
Using Cloud Logging for advanced analytics
For more advanced analytics, you may want to export your logs to BigQuery. You can then use standard SQL queries to analyze the logs, correlate data from other sources and enrich the output. For example, the following SQL query returns log data related to the email 'user@example.com' from the default namespace on a GKE cluster running the microservices demo app.
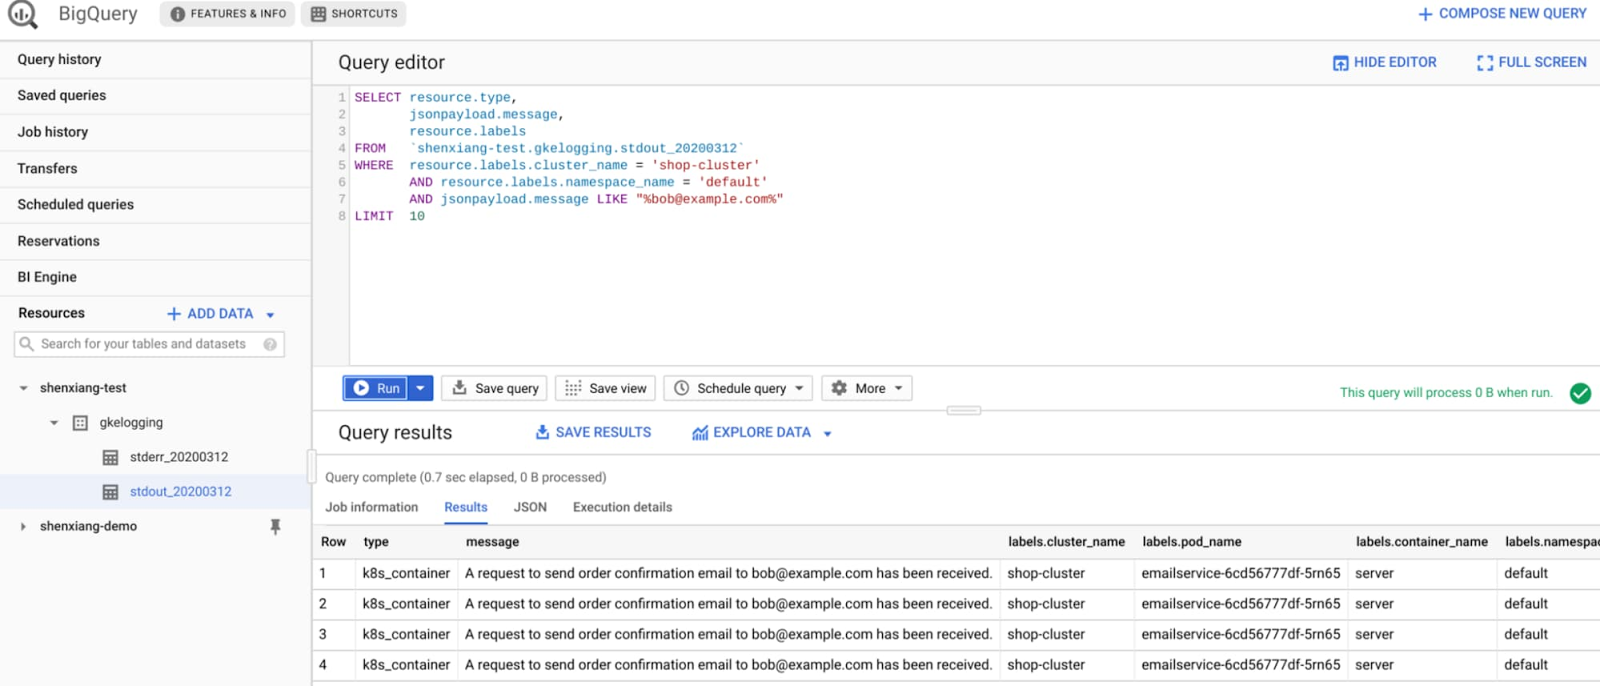

This log data may also provide valuable business insights. For example, the query below lets you know how many times a particular product was recommended by the recommendationservice in the last two days:
You can also analyze the activity and audit logs. For example, the following query returns all kubelet warnings in a specific timeframe:
If you are interested, you can find more sample queries in the Scenarios for exporting Cloud Logging: Security and access analytics article.
Using Cloud Logging for third-party tools or automation
The last use case we want to mention is integrating Cloud Logging with Pub/Sub. You can create sinks and export logs to Pub/Sub topics. This is more than simply exporting the log data. With Pub/Sub, you can create an event-driven architecture and process the log events in real time in an automated fashion. If you implement this event-driven architecture with serverless technologies such as Cloud Run or Cloud Functions, you can significantly reduce the cost and management overhead of the automation.
Learn more about Cloud Logging and GKE
We built our logging capabilities for GKE into Cloud Logging to make it easy for you to store, search, analyze, and monitor your logs. If you haven’t already, get started with Cloud Logging on GKE and join the discussion on our mailing list.
